使用keras内置函数获取F1值,并绘制F1统计图。
在老版本的keras值没有内置函数来获得f1值,需要自己写一堆来实现。
而在keras/tensorflow升级2.14.0之后,具备了该功能。
使用keras.metrics.F1Score()即可:
例如在model.compile中接入红色部分代码.
model.compile(loss="categorical_crossentropy",
optimizer="adam",
metrics=['accuracy', keras.metrics.Precision(), keras.metrics.Recall(),keras.metrics.F1Score()])
这样模型返回值里面就包含每一代的f1值.
通常把模型赋值给history,这样history就包含看了我们想要的各种信息,包含f1.
history=model.fit(... )
print(history.history)
从模型返回信息中的histroy获取F1值,包含训练集"f1_score"和测试集中的"val_f1_score",注意是返回的每一代的f1。
y=history.history["val_f1_score"]
y2=history.history["f1_score"]
f1的打印结果为(训练集,案例有10个分类):
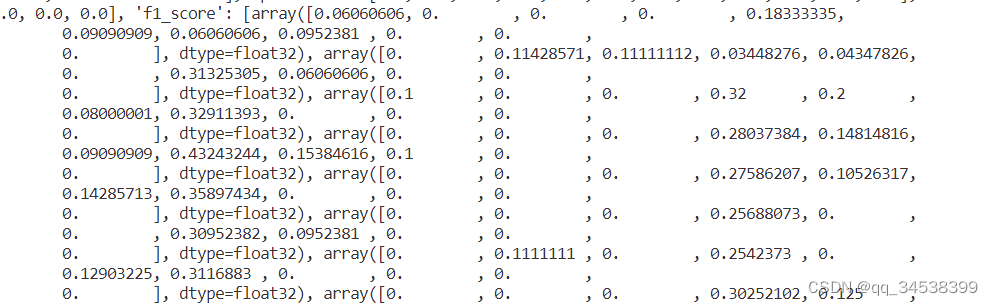
观察发现f1包含了每一代结果中每一个分类的f1结果,所以并不能以下这样的方式直接绘图:
plt.plot(history.epoch, history.history["val_f1_score"],color='g'', linestyle="--")
需要把每一代中每个分类的f1拿出来做平均值总F1绘制:
y=history.history["val_f1_score"]
y2=history.history["f1_score"]
while i<len(y):
x.append(sum(y[i])/len(y)) #x为list列表,存储测试集f1
x2.append(sum(y2[i])/len(y2)) #x2为list列表,存储训练集f1
i+=1
plt.plot(history.epoch, x,color='b', label='var_f1')
plt.plot(history.epoch, x2,color='r', label='f1')
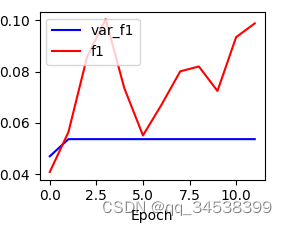
绘制训练集与测试集F1
效果如图所示:
也可以对每个分类绘制F1,开发办法还有很多,具体情况具体分析。

有“AI”的1024 = 2048,欢迎大家加入2048 AI社区
更多推荐


 17
17 0
0- 0


 已为社区贡献1条内容

所有评论(0)