虽然也在工作使用使用ai 补全代码或者完善代码,但还是没有完全使用ai 做一款应用,不依赖手工编程、不依赖人查找资料

所以决定自己写一个应用玩玩,感受一下全完使用ai开发一款应用的乐趣, 跟上时代发展的步伐

不得不说以前写玩具项目挺枯燥,现在用ai写 还是挺有意思的

应用的需求:

使用ai 分析 k线,并进行点评,让天底下的韭菜没有看不懂的k线,让ai进行cosplay 扮演各路专家进行点评,这不是一款应用这是一款ai驱动的综艺节目

考虑我国复杂的金融监管环境,对股票分析限制非常多,所以对 美股 和港股还有web3 领域的token 进行分析

下面是项目和代码文件

主要是一个图表组件TradingChart.tsx和首页 page.tsx 
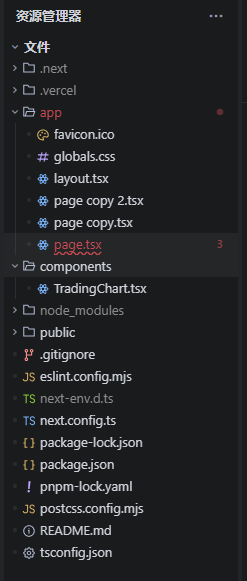
image

TradingChart.tsx

1

2

3

4

5

6

7

8

9

10

11

12

13

14

15

16

17

18

19

20

21

22

23

24

25

26

27

28

29

30

31

32

33

34

35

36

37

38

39

40

41

42

43

44

45

46

47

48

49

50

51

52

53

54

55

56

57

58

59

60

61

62

63

64

65

66

67

68

69

70

71

72

73

74

75

76

77

78

79

80

81

82

83

84

85

86

87

88

89

90

91

92

93

94

95

96

97

98

99

100

101

102

103

104

105

106

107

108

109

110

111

112

113

114

115

116

117

118

119

120

121

122

123

124

125

126

127

128

129

130

131

132

'use client'// 确保只在客户端渲染

import { useEffect, useRef } from 'react';

import {

  createChart,

  CandlestickSeries,

  HistogramSeries,

from 'lightweight-charts';

export interface KLine {

  time: string// 'YYYY-MM-DD'

  open: number;

  high: number;

  low: number;

  close: number;

  volume: number;

}

interface Props {

  data: KLine[];

}

export default function TradingChart({ data }: Props) {

  console.log(data);

  const containerRef = useRef<HTMLDivElement>(null);

  useEffect(() => {

    if (!containerRef.current || !data.length) return;

    const chart = createChart(containerRef.current, {

      width: containerRef.current.clientWidth,

      height: containerRef.current.clientHeight,

      layout: { textColor: '#d1d4dc', background: { color: '#111' } },

      grid:   { vertLines: { color: '#2a2e39' }, horzLines: { color: '#2a2e39' } },

      rightPriceScale: { visible: true },

      leftPriceScale:  { visible: true },


      crosshair: { mode: 1 },

      timeScale: {


        fixLeftEdge: false,

        fixRightEdge: false,

        barSpacing: 10,

        minBarSpacing: 5,

      },

    });

   chart.applyOptions({

    localization:{

      dateFormat: 'yyyy-MM-dd',

    }

   })

    /* ---- 蜡烛图 Pane(上方)---- */

    const candlePane = chart.panes()[0];

    const candleSeries = candlePane.addSeries(CandlestickSeries, {

      upColor: '#26a69a',

      downColor: '#ef5350',

      borderVisible: false,

      wickUpColor: '#26a69a',

      wickDownColor: '#ef5350',

      priceScaleId: 'right',

    });

    candleSeries.setData(

      data.map(({ time, open, high, low, close }) => ({ time, open, high, low, close }))

    );

    /* ---- 成交量 Pane(下方 30%)---- */

    const volumePane = chart.addPane();

    volumePane.setHeight(80);

    const volumeSeries = volumePane.addSeries(HistogramSeries, {

      color: '#26a69a',

      priceScaleId: 'right',

      base: 0,

    });


    // 格式化成交量Y轴标签 - 调整为20%高度

    volumePane.priceScale('right').applyOptions({

      //设置高度


      scaleMargins: {

        top: 0.2,

        bottom: 0,

      },

      borderVisible: false,

    });


    // 自定义成交量格式化

    volumeSeries.priceScale().applyOptions({

      invertScale: false,

      borderColor: '#2a2e39',

    });


    // 使用priceFormatter来格式化成交量数值

    volumeSeries.applyOptions({

      priceFormat: {

        type: 'custom',

        minMove: 1,

        formatter: (price: number) => {

          if (price >= 1000000) {

            return (price / 1000000).toFixed(1) + 'M';

          else if (price >= 1000) {

            return (price / 1000).toFixed(0) + 'K';

          else {

            return price.toFixed(0);

          }

        }

      }

    });

    volumeSeries.setData(

      data.map(d => ({

        time: d.time,

        value: d.volume,

        color: d.close >= d.open ? '#26a69a' '#ef5350',

      }))

    );

    chart.timeScale().fitContent();

    /* 自适应窗口大小 */

    const ro = new ResizeObserver(() => chart.applyOptions({

      width: containerRef.current!.clientWidth,

      height: containerRef.current!.clientHeight,


    }));

    ro.observe(containerRef.current);

    return () => {

      ro.disconnect();

      chart.remove();

    };

  }, [data]);

  return <div ref={containerRef} style={{ width: '100%', height: '100%' }} />;

}

  page.tsx

1

2

3

4

5

6

7

8

9

10

11

12

13

14

15

16

17

18

19

20

21

22

23

24

25

26

27

28

29

30

31

32

33

34

35

36

37

38

39

40

41

42

43

44

45

46

47

48

49

50

51

52

53

54

55

56

57

58

59

60

61

62

63

64

65

66

67

68

69

70

71

72

73

74

75

76

77

78

79

80

81

82

83

84

85

86

87

88

89

90

91

92

93

94

95

96

97

98

99

100

101

102

103

104

105

// app/page.tsx 或 pages/index.tsx

"use client"

import dynamic from 'next/dynamic';

import { KLine } from '@/components/TradingChart';

import TradingChart from '@/components/TradingChart';

import { useState, useEffect } from 'react';

interface Coin {

  id: string;

  symbol: string;

  name: string;

}

export default function HomePage() {

  const [kLineData, setKLineData] = useState<KLine[]>([]);

  const [coins, setCoins] = useState<Coin[]>([]);

  const [selectedCoin, setSelectedCoin] = useState<string>('bitcoin');

  useEffect(() => {

    const fetchCoins = async () => {

      try {

        const response = await fetch('https://api.coingecko.com/api/v3/coins/markets?vs_currency=usd&order=market_cap_desc&per_page=100&page=1&sparkline=false');

        const data = await response.json();

        setCoins(data);

      catch (error) {

        console.error('获取币种列表失败:', error);

      }

    };

    fetchCoins();

  }, []);

  useEffect(() => {

    const fetchData = async () => {

      if (!selectedCoin) return;


      try {

        // 180 天 和30天数据

        // 并行获取OHLC和成交量数据

        const [ohlcRes, volumeRes] = await Promise.all([

          fetch(`https://api.coingecko.com/api/v3/coins/${selectedCoin}/ohlc?vs_currency=usd&days=180`),

          fetch(`https://api.coingecko.com/api/v3/coins/${selectedCoin}/market_chart?vs_currency=usd&days=180&interval=daily`,{cache:'force-cache'})

        ]);

        const ohlcData = await ohlcRes.json();

        const volumeData = await volumeRes.json();

        // 合并数据并转换格式

        const formattedData = ohlcData.map(([timestamp, open, high, low, close]: [number, number, number, number, number]) => {

          // 匹配对应时间戳的成交量

          const volumeEntry = volumeData.total_volumes?.find(([volTimestamp]: [number, number]) => volTimestamp === timestamp);

          const volume = volumeEntry ? volumeEntry[1] : 0;

          // 转换时间戳为YYYY-MM-DD格式

          const date = new Date(timestamp);

          // const time = `${date.getFullYear()}-${String(date.getMonth() + 1).padStart(2, '0')}-${String(date.getDate()).padStart(2, '0')}`;

          return { time:timestamp/1000, open, high, low, close, volume };

        });

        setKLineData(formattedData);

      catch (error) {

        console.error('数据获取失败:', error);

      }

    };

    fetchData();

  }, [selectedCoin]);

  return (

    <div >

        <div className='w-[70%]' style={{ height: '600px' }}>

        <div className=' flex  align-center'>

           <select

          value={selectedCoin}

          onChange={(e) => setSelectedCoin(e.target.value)}

          className="px-4 py-2 border border-gray-300 rounded-lg bg-white text-gray-700 shadow-sm focus:outline-none focus:ring-2 focus:ring-blue-500 focus:border-blue-500 hover:border-gray-400 transition-colors duration-200"

        >

          {coins.map((coin) => (

            <option key={coin.id} value={coin.id} className="py-1">

              {coin.name} ({coin.symbol.toUpperCase()})

            </option>

          ))}

        </select>

        {/* 显示 下拉列表中选中的币种的current_price */}

        <div className='flex items-center'>

          {coins.find((coin) => coin.id === selectedCoin)?.current_price} usdt

        </div>

        </div>


        <TradingChart data={kLineData} />

      </div>

      <div className='w-[30%]'>

       对话框组件

      </div>

    </div>


    );

  }


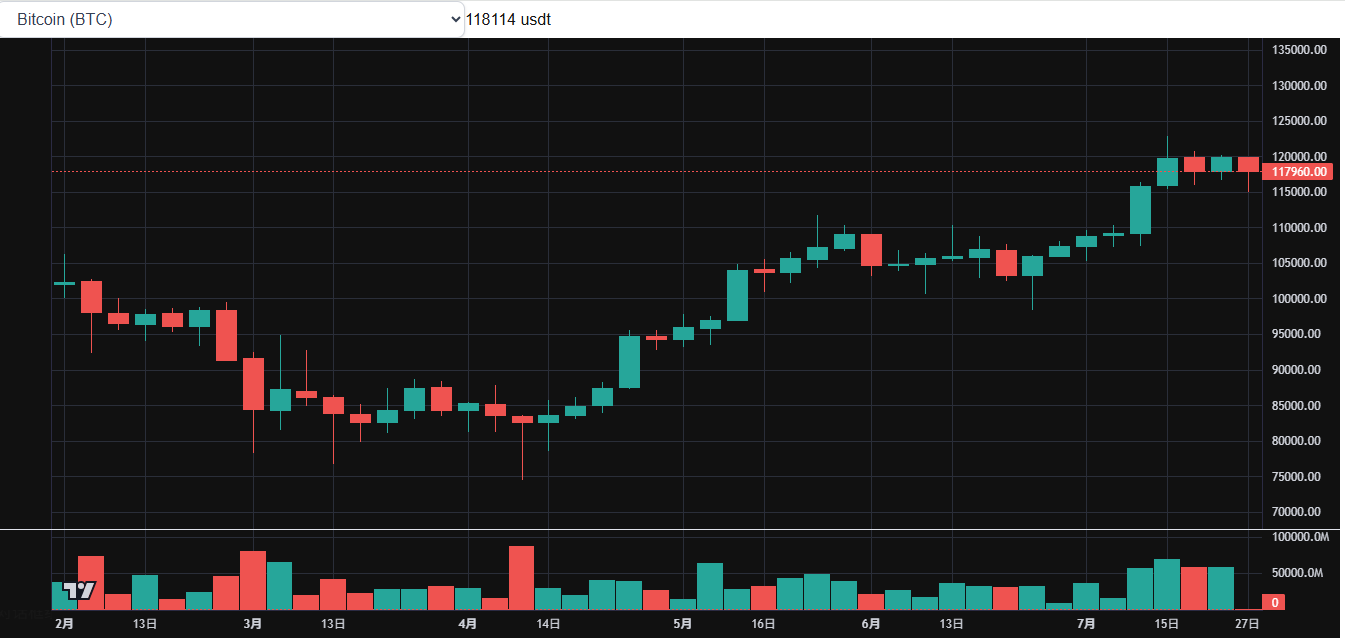
下面是上周工作的成果 绘制了k线和显示了下拉列表还有价格

image

下面说一下我开发的步骤

Logo

有“AI”的1024 = 2048,欢迎大家加入2048 AI社区

更多推荐