使用OpenTelemetry来监控Java应用
本文介绍了使用OpenTelemetry结合Grafana LGTM Stack监控Java应用的方案。通过下载OpenTelemetry Java Agent和Pyroscope Agent,可以非侵入式地采集应用的metrics、traces、logs和profiles数据。文章详细展示了如何搭建监控后端系统、配置Java应用以及使用Grafana查看各类监控数据。其他语言也有各自的实现方式。
1. 前言
前几天我写了一篇文章,简单介绍了OpenTelemetry OBI,也就是OpenTelemetry+eBPF的方案。这个方案采用零侵入的方式,做起来很容易,工具下载下来以后几分钟搞定演示程序,适用于各种编程语言。但是这种方式监控的metrics和trace都比较受限。
有人问我为什么不介绍一下最近OpenTelemetry发展起来的对Profiling的支持(traces,metrics,logs之外的第4类监控信号数据)。这个主要是因为OpenTelemetry对Profiling的支持还在发展之中。另外很多人不喜欢那种修改代码的侵入式解决方案。OpenTelemetry有基于eBPF的零侵入方案支持Profiling,但是它对系统安装和编译的要求又比较繁琐,出来的火焰图与高级编程语言的堆栈很难对照。
相对而言,如果采用OpenTelemetry加上Grafana提供的LGTM(Looks Good To Me)后端系统,可以轻松地得到traces,metrics,logs和profiles,可以很容易做一个演示程序。其中traces,metrics,logs是纯粹OpenTelemetry的解决方案。而profiles只是一个过渡方案,等OpenTelemetry Profiles稳定下来,就会并入纯OpenTelemetry工具。
这篇文章只选择Java应用的做法。其它语言也有类似的方案。有些语言在非侵入监控方面还做得不够好。
我在这个演示里面没有直接用到OpenTelemetry Collector。OpenTelemetry Collector是极其重要的工具,但LGTM里面已经内置了OpenTelemetry Collector。
2. 下载工具并运行Java应用
2.1 搭建一个支持OTLP端口的后端监控系统
目前所有的一流商业应用监控系统(APM)都支持OpenTelemetry定义的OTLP端口。支持OTLP端口的开源或免费系统也很多。我们可以使用简单易用的开源系统Grafana LGTM Stack搭建个人测试用的后端系统。它内置了OpenTelemetry Collector并支持OpenTelemetry Metrics, Traces, Logs,和Profiles。以下是我执行的命令:
docker pull grafana/otel-lgtm
docker run --name lgtm -p 3100:3000 -p 4317:4317 -p 4318:4318 -p 4040:4040 --rm -ti grafana/otel-lgtm
注意:
- 我这里把对外的端口从3000改为3100,避免和本地使用3000端口的应用冲突。
- 我的Grafana LGTM Stack运行的宿主机IP为:192.168.108.128。
- 这里只是演示。如果您想用于生产系统,还是建议用官方提供的脚本来启动,主要设置相应的参数。
这时候在可以访问http://192.168.108.128:3100/,使用admin/admin登录Grafana。
2.2 下载OpenTelemetry Java Agent (opentelemetry-javaagent.jar)
这个Agent被用于自动注入Java应用,输出OpenTelemetry traces,metrics,logs。到这个地址下载最新版本即可。
2.3 下载pyroscope.jar
这个Agent被用于自动注入Java应用,输出profiles。到这个地址下载最新版本即可。等OpenTelemetry Profiles成熟了,应该会被加入到上面那个标准的opentelemetry-javaagent.jar。如果您不想用OpenTelemetry Profiles,也可以不下载这个Agent。
2.4 运行一个自己的Java应用
如果手头没有Java应用的话,可以到这里下载一个(这个示例程序叫做petclinic)。注意这个应用要用JDK17和比较新版本的Maven进行编译:
./mvnw clean package -Dmaven.test.skip=true
然后用以下命令去执行它(opentelemetry-javaagent.jar和pyroscope.jar要在当前的目录):
export OTEL_SERVICE_NAME=my-service
export OTEL_TRACES_EXPORTER=otlp
export OTEL_METRICS_EXPORTER=otlp
export OTEL_LOGS_EXPORTER=otlp
export OTEL_EXPORTER_OTLP_ENDPOINT="http://localhost:4317"
export OTEL_EXPORTER_OTLP_PROTOCOL=grpc
java -javaagent:./opentelemetry-javaagent.jar -javaagent:./pyroscope.jar -jar target/*.jar --server.port=28080
注意:
- 如果您的应用和LGTM不在一台机器上,那就用它的IP来替换“http://localhost:4317”,比如“http://192.168.108.128:4317”。
- 如果您不用OpenTelemetry Profiles,那就删除“-javaagent:/opt/dev/otel/res/pyroscope.jar”。
- 上面列出的环境变量都是OpenTelemetry的标准环境变量,适用于各种编程语言。读者可自行查询其含义。
3. 配置LGTM的Grafana来观察metrics,traces,logs和profiles
以下是我创建的一个Dashboard的页面(关于JVM的metrics非常多,但我没有在这个Dashboard里面展现它们):

下面是该dashboard的源码:
{
"annotations": {
"list": [
{
"builtIn": 1,
"datasource": {
"type": "grafana",
"uid": "-- Grafana --"
},
"enable": true,
"hide": true,
"iconColor": "rgba(0, 211, 255, 1)",
"name": "Annotations & Alerts",
"type": "dashboard"
}
]
},
"editable": true,
"fiscalYearStartMonth": 0,
"graphTooltip": 0,
"id": 4,
"links": [],
"panels": [
{
"datasource": {
"type": "prometheus",
"uid": "prometheus"
},
"fieldConfig": {
"defaults": {
"color": {
"mode": "palette-classic"
},
"custom": {
"axisBorderShow": false,
"axisCenteredZero": false,
"axisColorMode": "text",
"axisLabel": "",
"axisPlacement": "auto",
"barAlignment": 0,
"barWidthFactor": 0.6,
"drawStyle": "line",
"fillOpacity": 0,
"gradientMode": "none",
"hideFrom": {
"legend": false,
"tooltip": false,
"viz": false
},
"insertNulls": false,
"lineInterpolation": "linear",
"lineWidth": 1,
"pointSize": 5,
"scaleDistribution": {
"type": "linear"
},
"showPoints": "auto",
"showValues": false,
"spanNulls": false,
"stacking": {
"group": "A",
"mode": "none"
},
"thresholdsStyle": {
"mode": "off"
}
},
"mappings": [],
"thresholds": {
"mode": "absolute",
"steps": [
{
"color": "green",
"value": 0
},
{
"color": "red",
"value": 80
}
]
},
"unit": "reqps"
},
"overrides": []
},
"gridPos": {
"h": 8,
"w": 12,
"x": 0,
"y": 0
},
"id": 2,
"options": {
"legend": {
"calcs": [],
"displayMode": "list",
"placement": "bottom",
"showLegend": true
},
"tooltip": {
"hideZeros": false,
"mode": "single",
"sort": "none"
}
},
"pluginVersion": "12.3.3",
"targets": [
{
"datasource": {
"type": "prometheus",
"uid": "prometheus"
},
"editorMode": "code",
"expr": "sum by (http_route, http_response_status_code) (\r\n rate(http_server_request_duration_seconds_count[2m])\r\n)",
"instant": true,
"legendFormat": "__auto",
"range": true,
"refId": "A"
}
],
"title": "吞吐量",
"type": "timeseries"
},
{
"datasource": {
"type": "prometheus",
"uid": "prometheus"
},
"fieldConfig": {
"defaults": {
"color": {
"mode": "palette-classic"
},
"custom": {
"axisBorderShow": false,
"axisCenteredZero": false,
"axisColorMode": "text",
"axisLabel": "",
"axisPlacement": "auto",
"barAlignment": 0,
"barWidthFactor": 0.6,
"drawStyle": "line",
"fillOpacity": 0,
"gradientMode": "none",
"hideFrom": {
"legend": false,
"tooltip": false,
"viz": false
},
"insertNulls": false,
"lineInterpolation": "linear",
"lineWidth": 1,
"pointSize": 5,
"scaleDistribution": {
"type": "linear"
},
"showPoints": "auto",
"showValues": false,
"spanNulls": false,
"stacking": {
"group": "A",
"mode": "none"
},
"thresholdsStyle": {
"mode": "off"
}
},
"mappings": [],
"thresholds": {
"mode": "absolute",
"steps": [
{
"color": "green",
"value": 0
},
{
"color": "red",
"value": 80
}
]
},
"unit": "s"
},
"overrides": []
},
"gridPos": {
"h": 8,
"w": 12,
"x": 12,
"y": 0
},
"id": 1,
"options": {
"legend": {
"calcs": [],
"displayMode": "list",
"placement": "bottom",
"showLegend": true
},
"tooltip": {
"hideZeros": false,
"mode": "single",
"sort": "none"
}
},
"pluginVersion": "12.3.3",
"targets": [
{
"datasource": {
"type": "prometheus",
"uid": "prometheus"
},
"editorMode": "code",
"expr": "histogram_quantile(0.90, sum by (le, http_route) (rate(http_server_request_duration_seconds_bucket[2m])))\r\n",
"instant": true,
"legendFormat": "__auto",
"range": true,
"refId": "A"
}
],
"title": "延迟时间",
"type": "timeseries"
},
{
"datasource": {
"type": "tempo",
"uid": "tempo"
},
"fieldConfig": {
"defaults": {
"custom": {
"align": "auto",
"cellOptions": {
"type": "auto"
},
"footer": {
"reducers": []
},
"inspect": false
},
"mappings": [],
"thresholds": {
"mode": "absolute",
"steps": [
{
"color": "green",
"value": 0
},
{
"color": "red",
"value": 80
}
]
}
},
"overrides": []
},
"gridPos": {
"h": 8,
"w": 24,
"x": 0,
"y": 8
},
"id": 4,
"options": {
"cellHeight": "sm",
"showHeader": true
},
"pluginVersion": "12.3.3",
"targets": [
{
"datasource": {
"type": "tempo",
"uid": "tempo"
},
"filters": [
{
"id": "3aaf9885",
"operator": "=",
"scope": "span"
}
],
"key": "Q-a3d09f2b-d713-4e41-964b-de64d135e60a-0",
"limit": 20,
"metricsQueryType": "range",
"queryType": "traceqlSearch",
"refId": "A",
"serviceMapUseNativeHistograms": false,
"tableType": "traces"
}
],
"title": "Traces",
"type": "table"
}
],
"preload": false,
"schemaVersion": 42,
"tags": [],
"templating": {
"list": []
},
"time": {
"from": "now-1h",
"to": "now"
},
"timepicker": {},
"timezone": "browser",
"title": "OBI dashboard",
"uid": "ad8krnh",
"version": 10
}
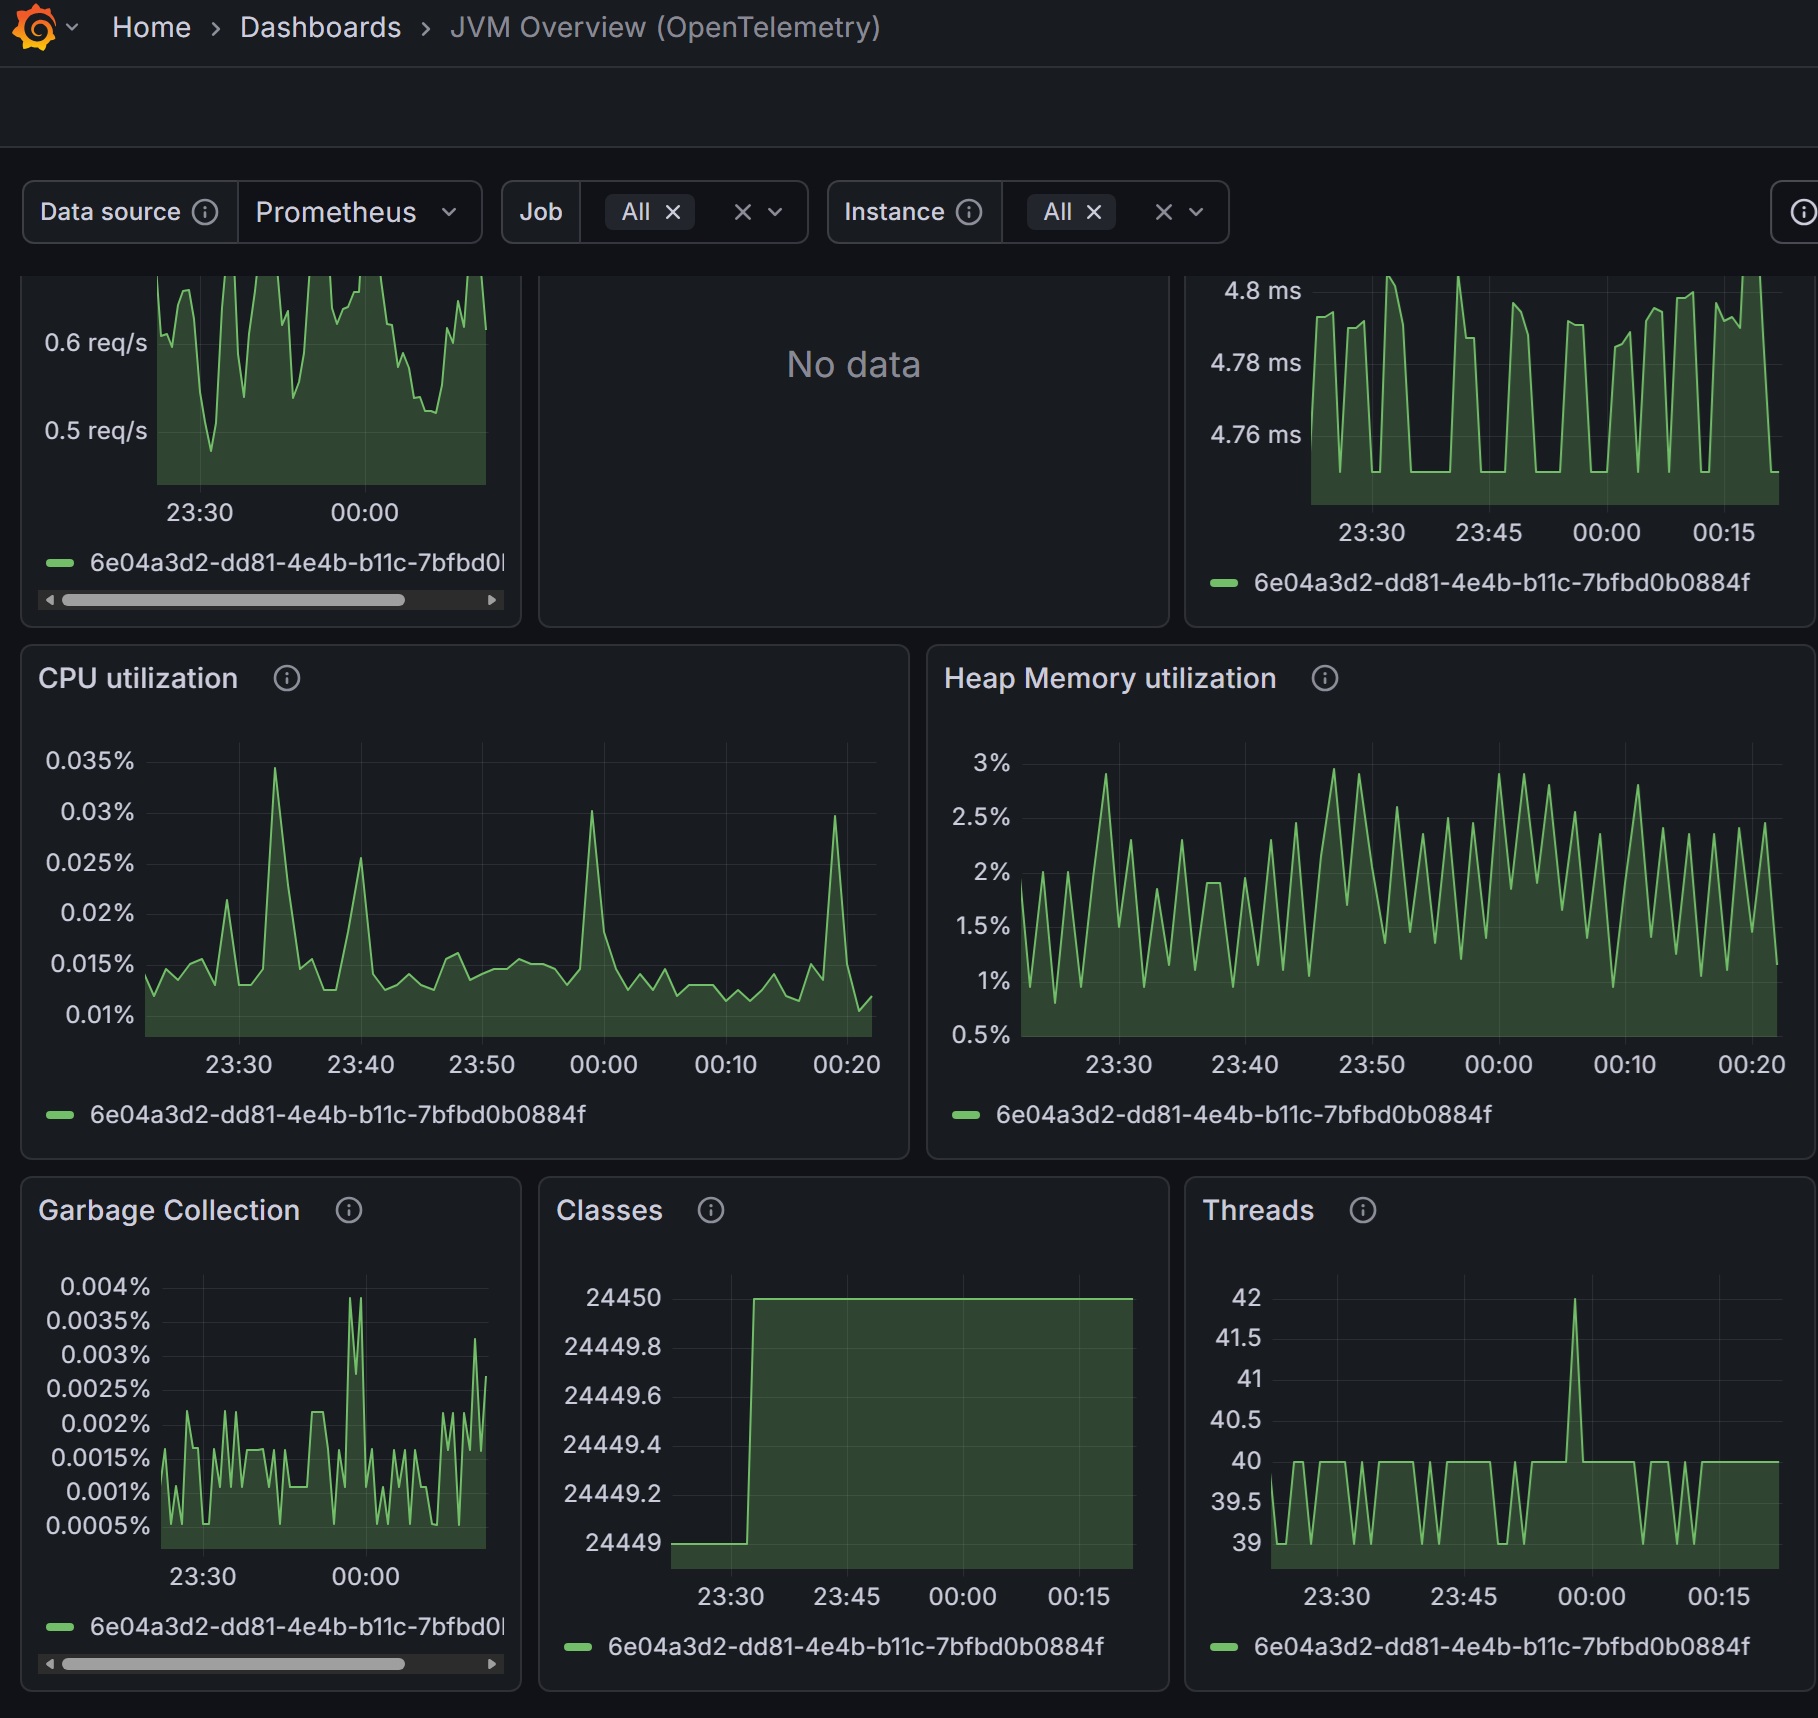
这是系统自带的一个Dashboard(名字叫做JVM Overview)的片段,读者可以自己看它的源码。OpenTelemetry Java Agent提供的metrics非常多,可以做一个内容非常丰富的Dashboard:

以下是在Explorer上配置metrics的页面:
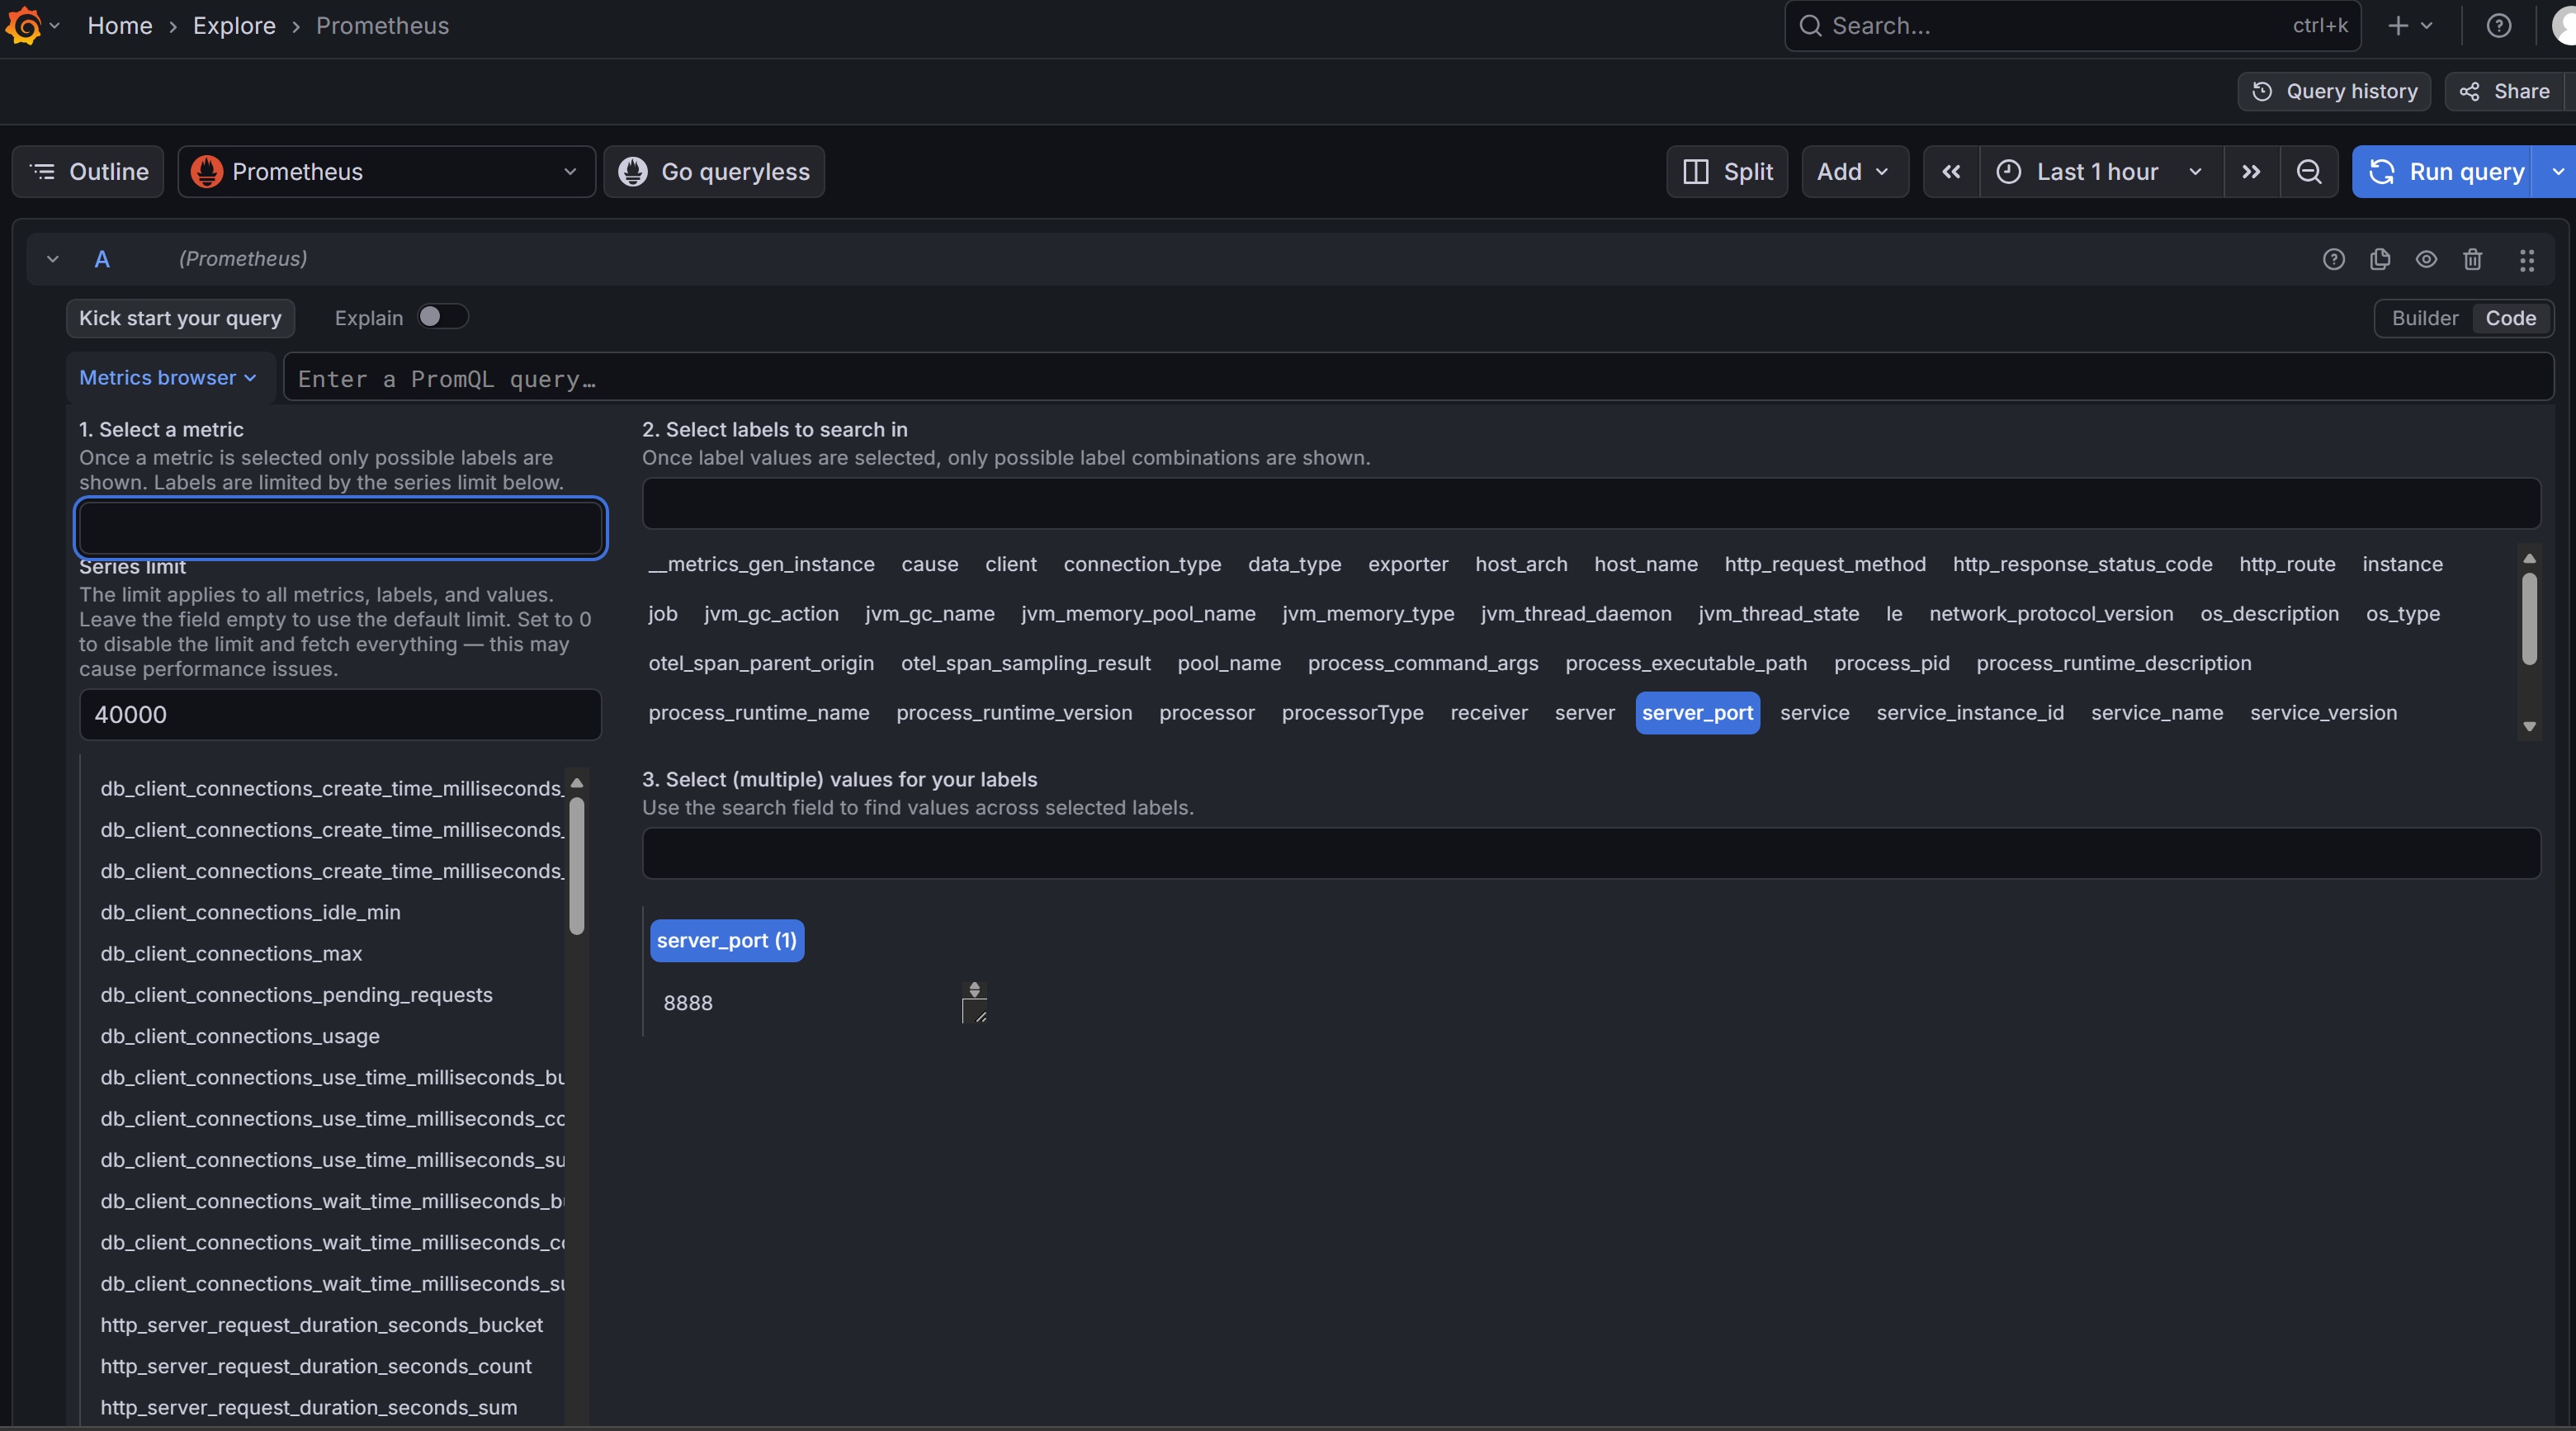
以下是查看Traces(追踪)的页面:
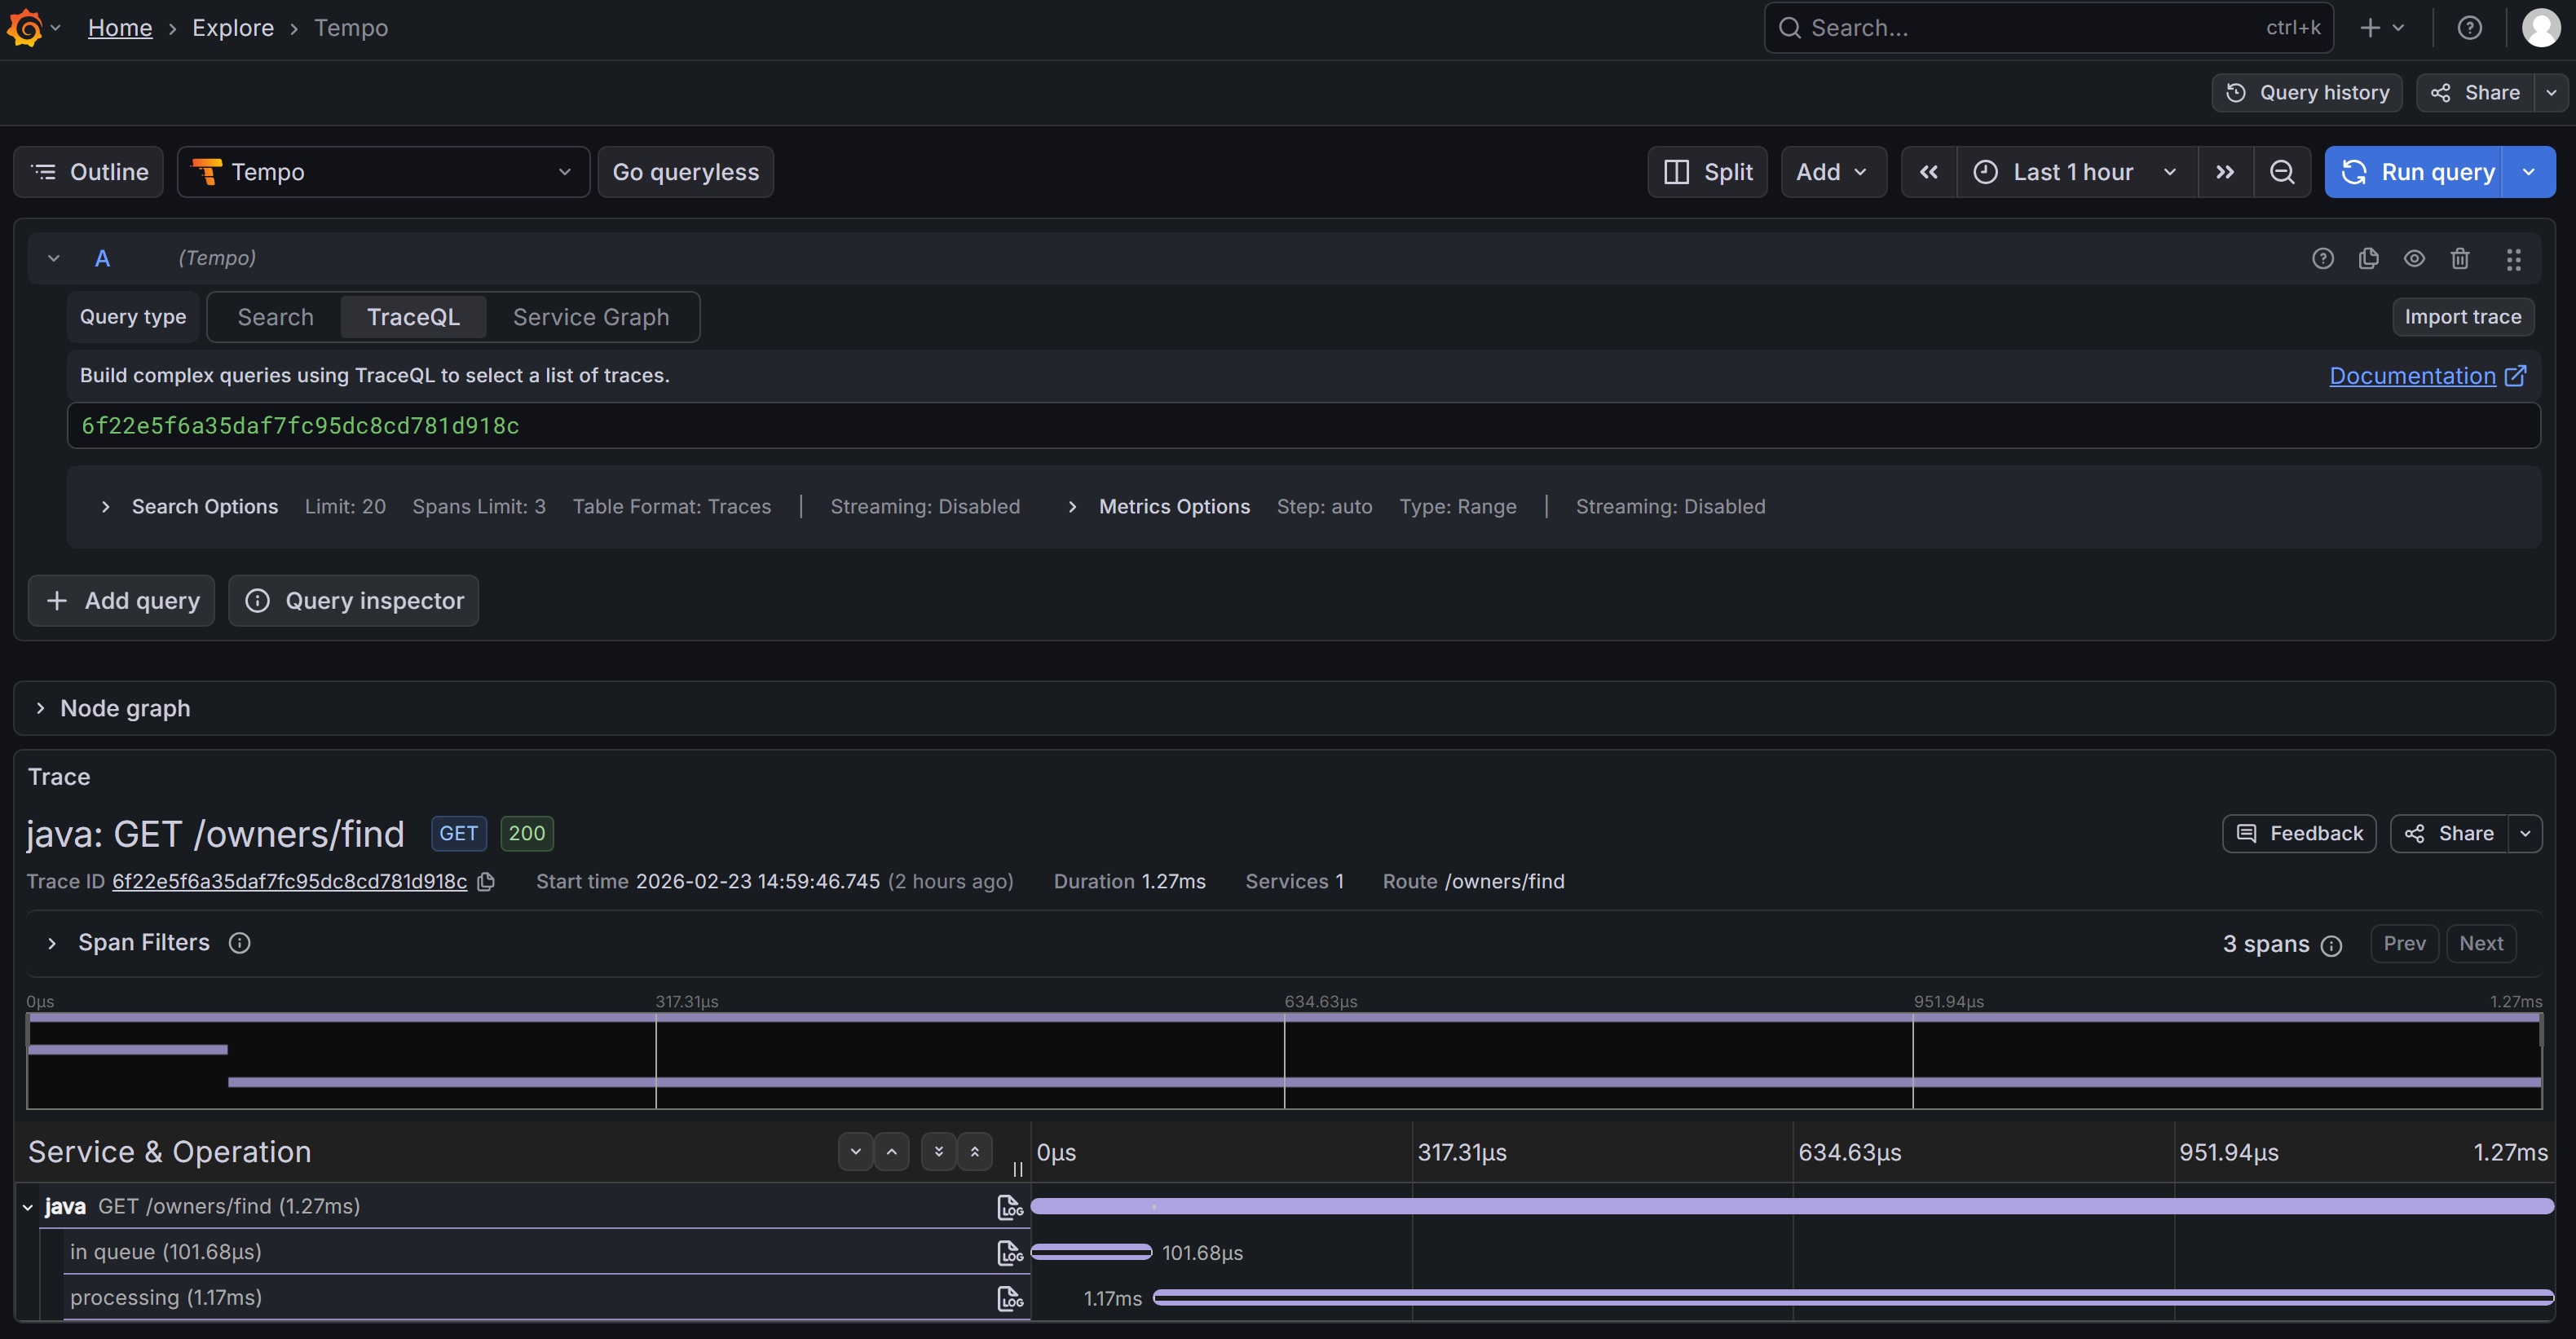
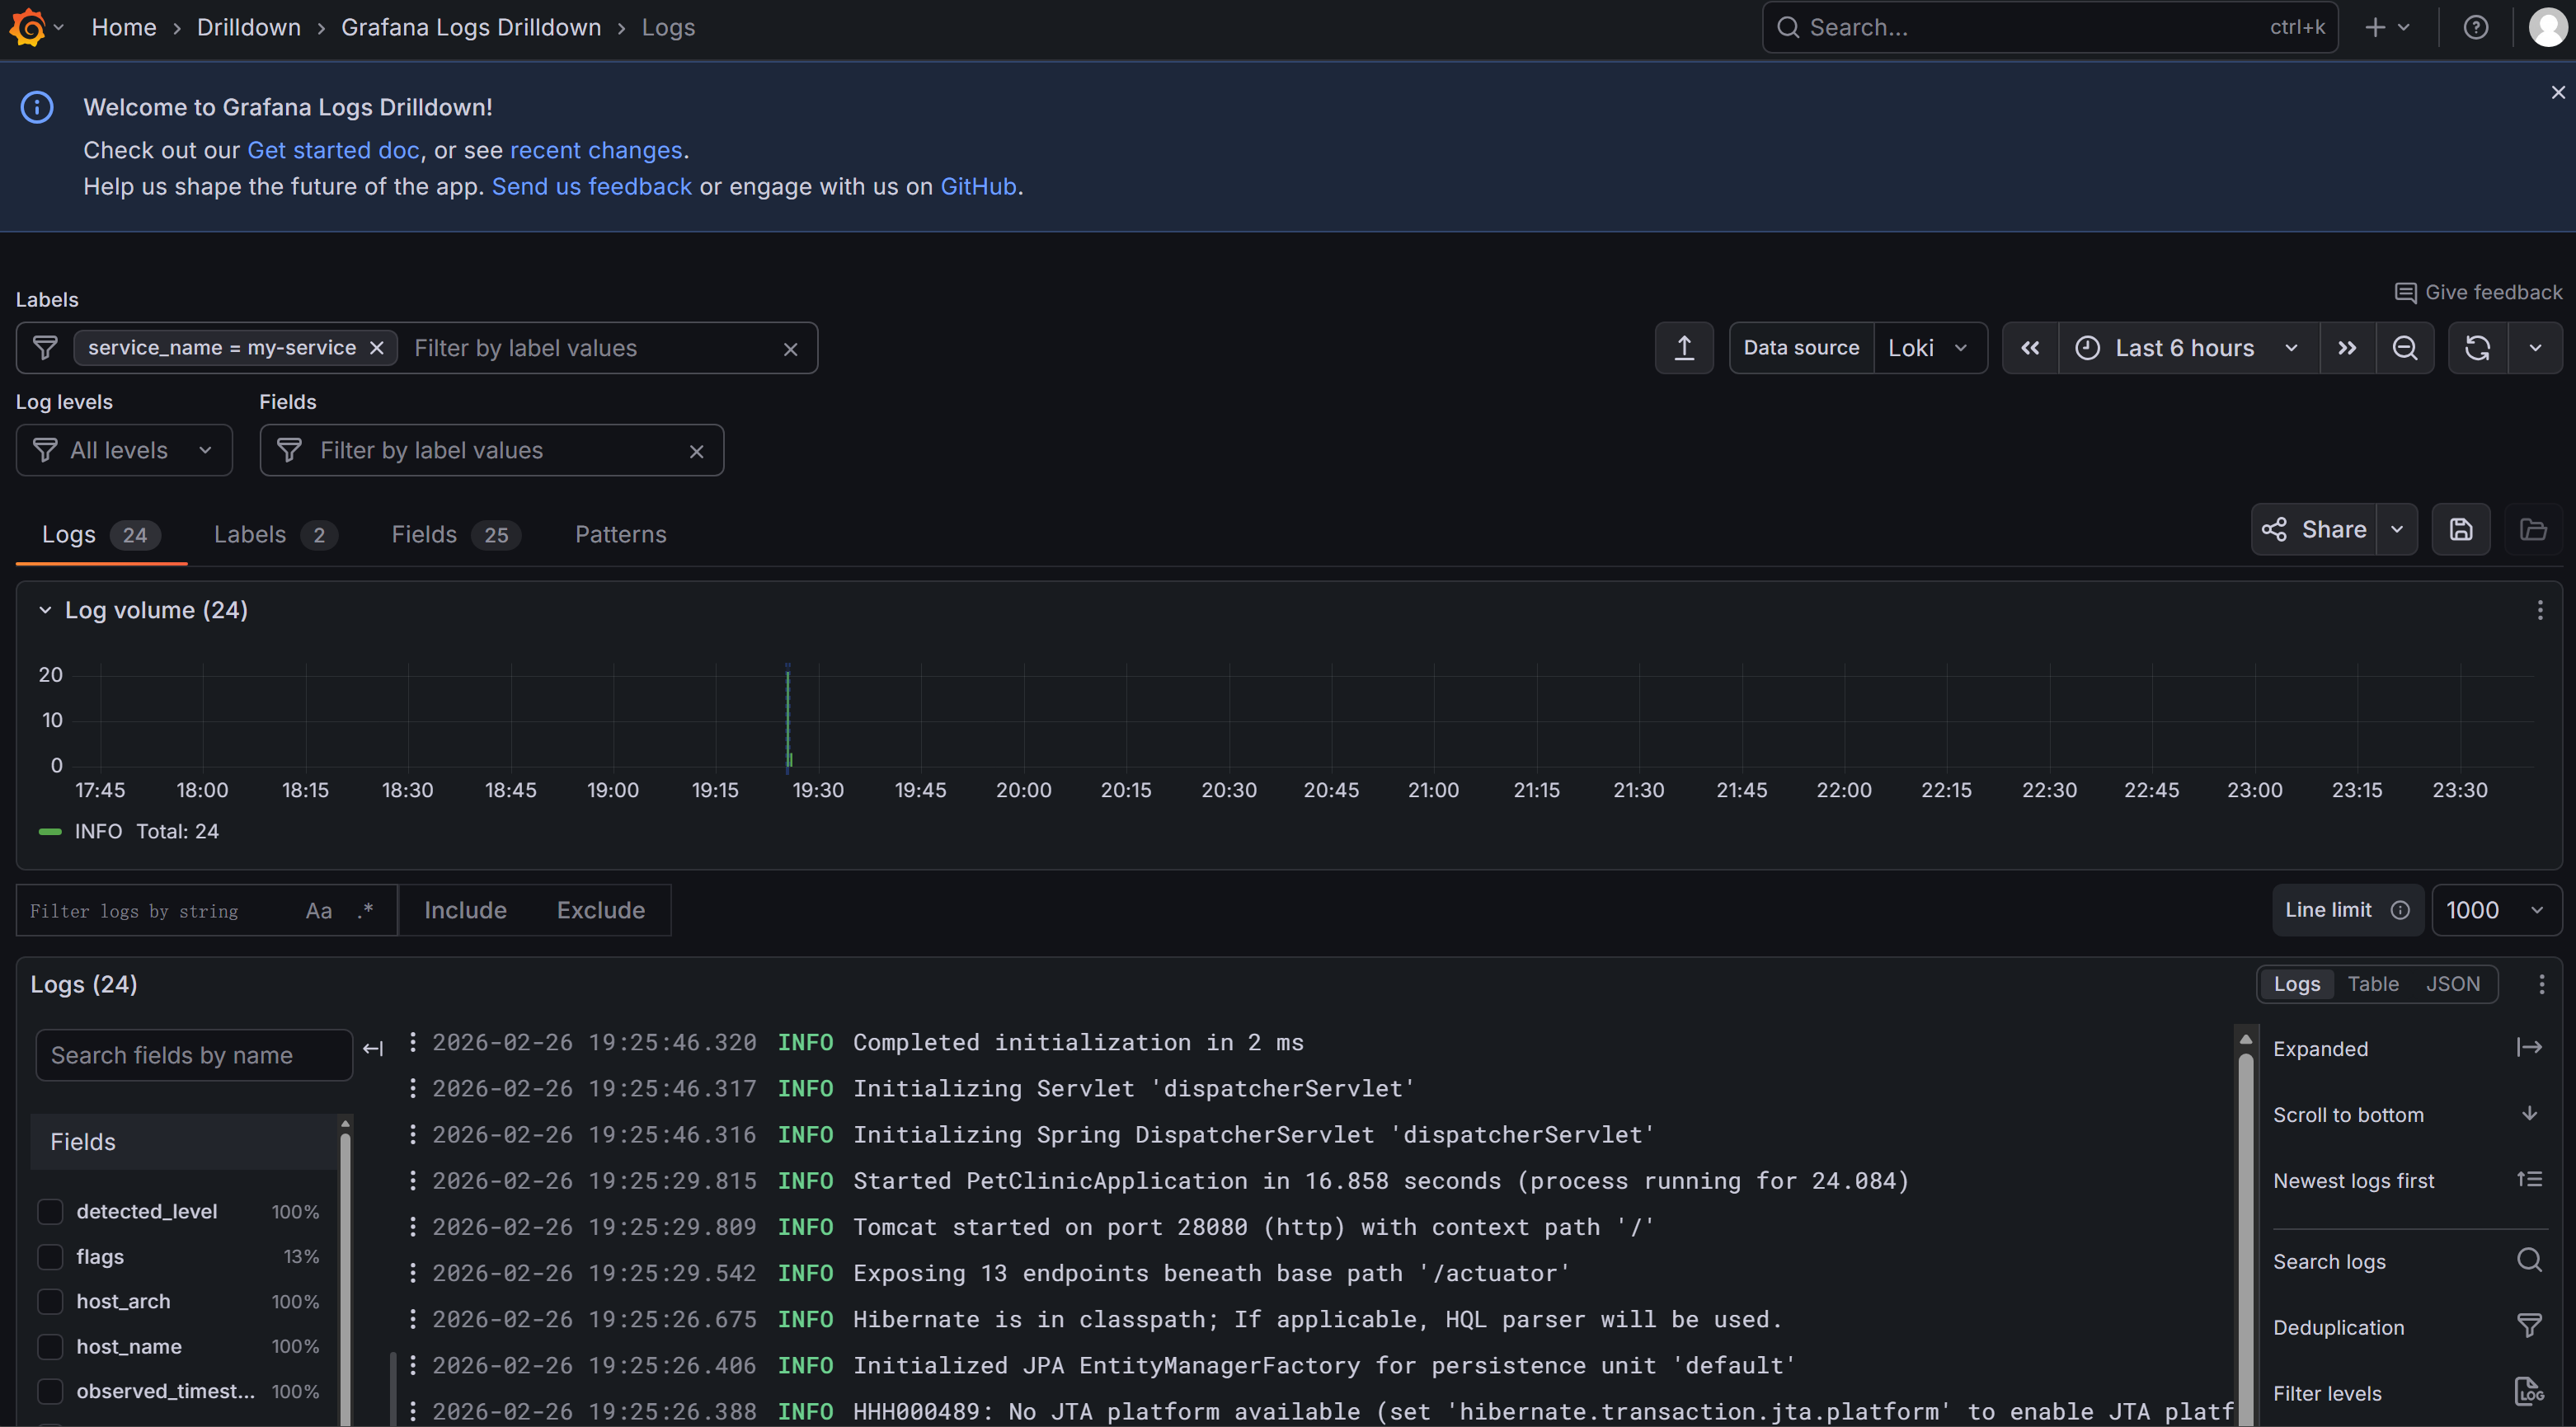
以下是查看Logs(日志)的页面(没有出错的情况下这个Agent收集的日志较少):

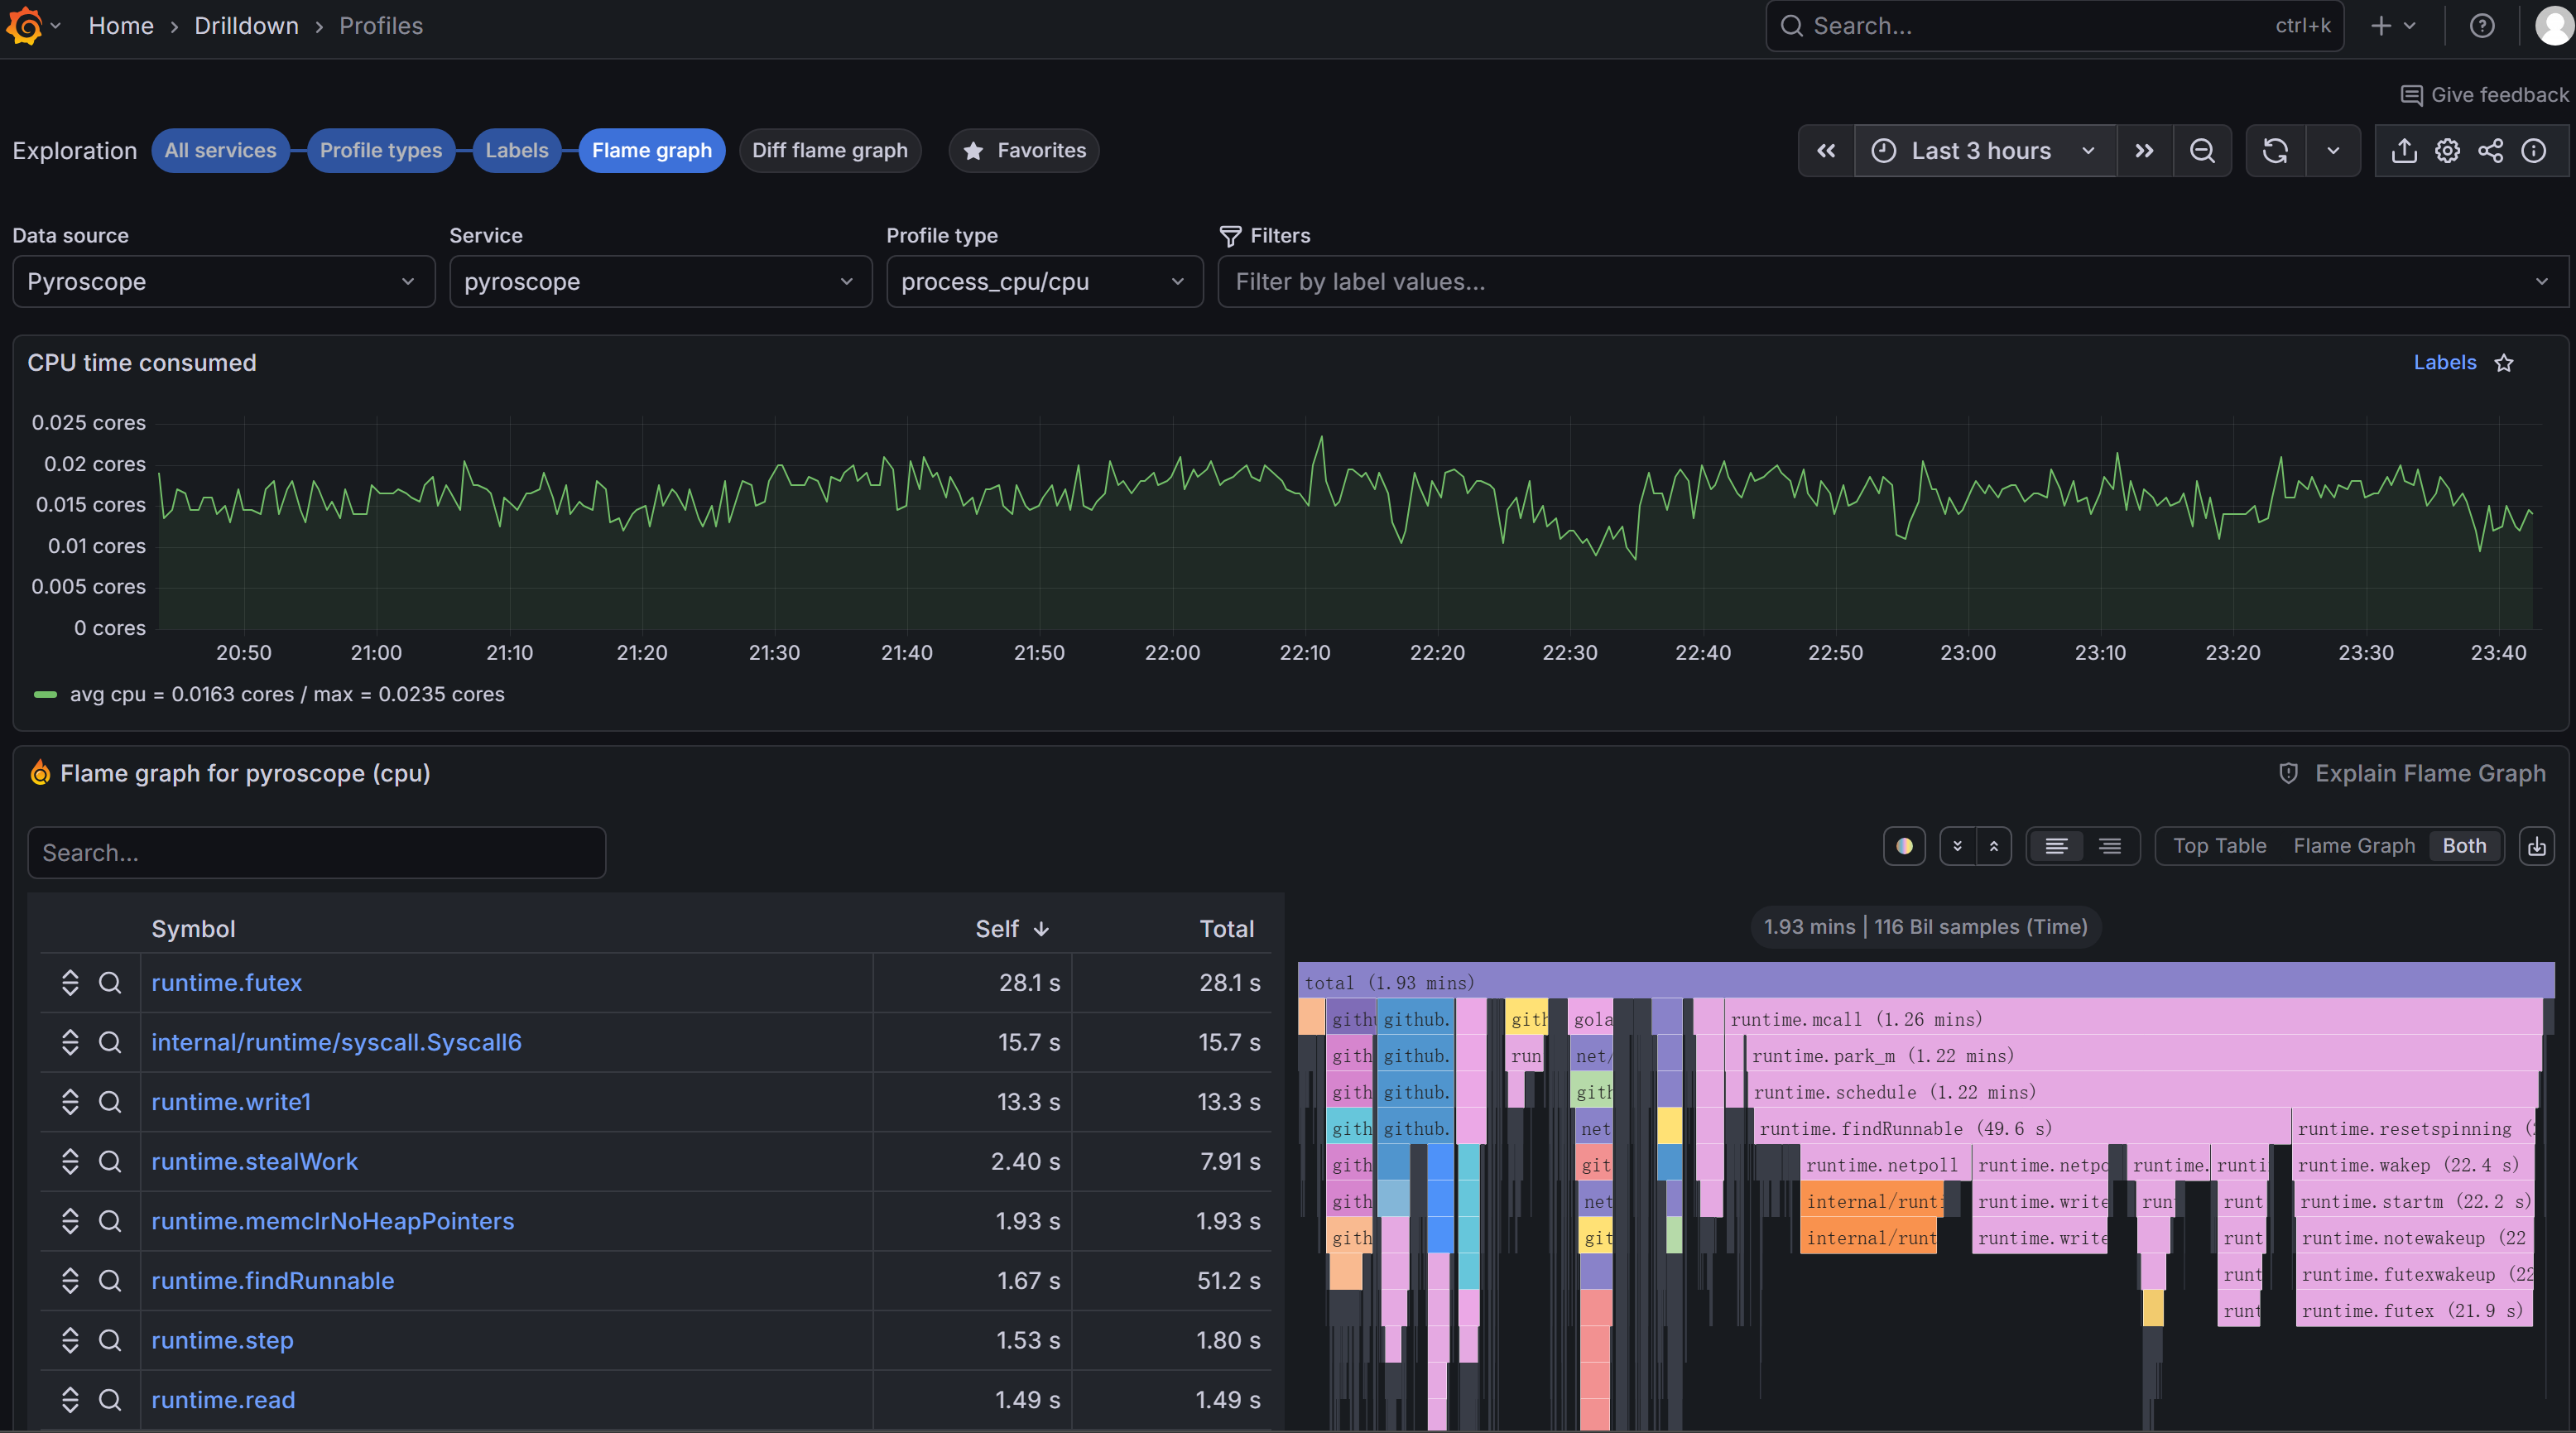
以下是查看Profiles的页面(我选择了火焰图(Flame Graph),可以看出不同调用栈的CPU消耗):

4. 总结
从上面的描述可以看出,使用OpenTelemetry监控Java应用是非常容易的。其主要工具是一个OpenTelemetry Java agent。另外还可以采用一个Grafana提供的Agent来采基Profiles的数据。其实,如果应用使用了Spring Boot 3提供的OpenTelemetry内置支持,OpenTelemetry Java agent也可以省略。当然OpenTelemetry Java agent可以支持各种Java框架,不一定是Spring Boot。
支持OpenTelemetry非侵入式的注入(或者说Automatic Instrumentation)的编程语言有很多,比如Java, Python, .Net, Node.JS等等。其它编程语言也各自有自己的办法。比如Go语言与eBPF结合的效果特别好。
更多推荐


所有评论(0)