【收尾以及复盘】flutter开发鸿蒙APP之本月数据统计页面
摘要:本文介绍了一个基于Flutter开发的用户打卡数据可视化页面,包含以下核心功能:1)顶部4个统计卡片展示今日摄入、连续打卡等关键指标;2)中间柱状图展示月度打卡趋势,支持点击查看每日详情;3)底部环形图统计水果类别占比。页面采用StatefulWidget管理多个数据源,通过Future.wait并行加载4个API接口数据。技术实现包含自定义柱状图、环形图绘制、下拉刷新等功能,数据结构使用D
欢迎加入开源鸿蒙跨平台社区:https://openharmonycrossplatform.csdn.net
1.本月数据统计页面先看截图效果
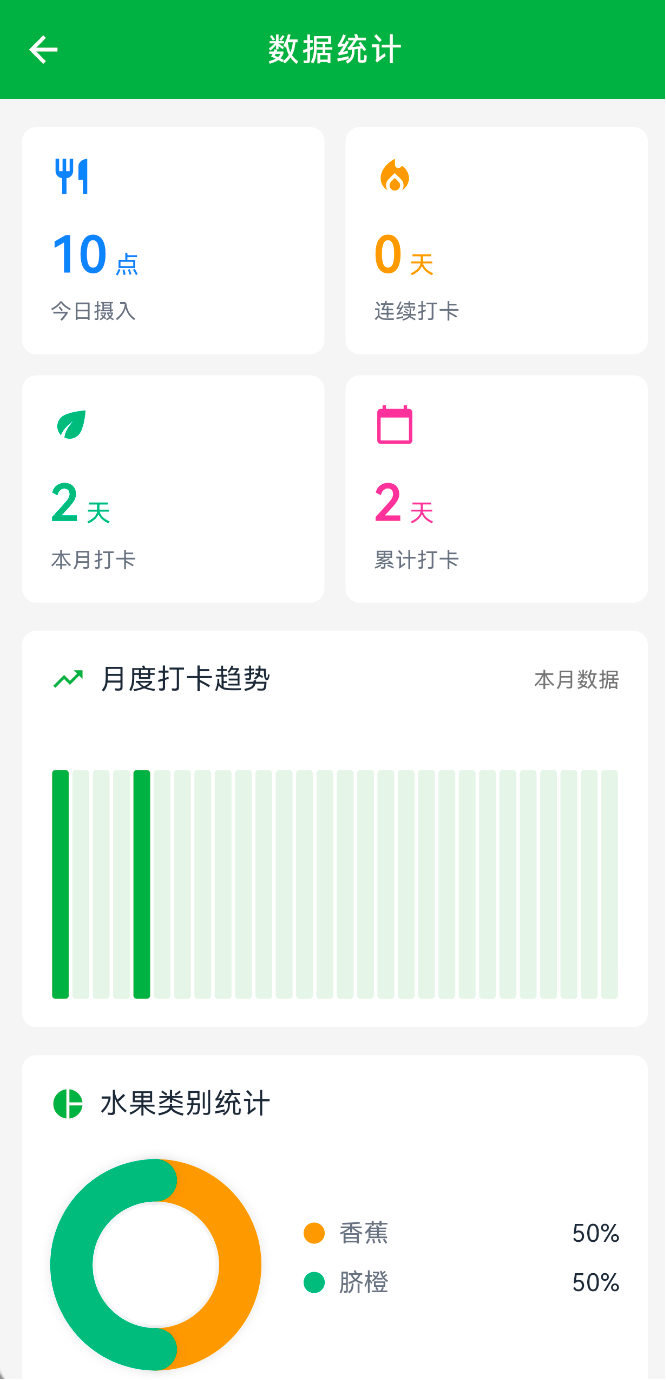
这是一个数据可视化页面,把用户的打卡数据用图表展示出来。
2.页面功能
- 顶部 4 个统计卡片:今日摄入、连续打卡、本月打卡、累计打卡
- 中间是月度打卡趋势图,用柱状图显示本月每天的打卡情况
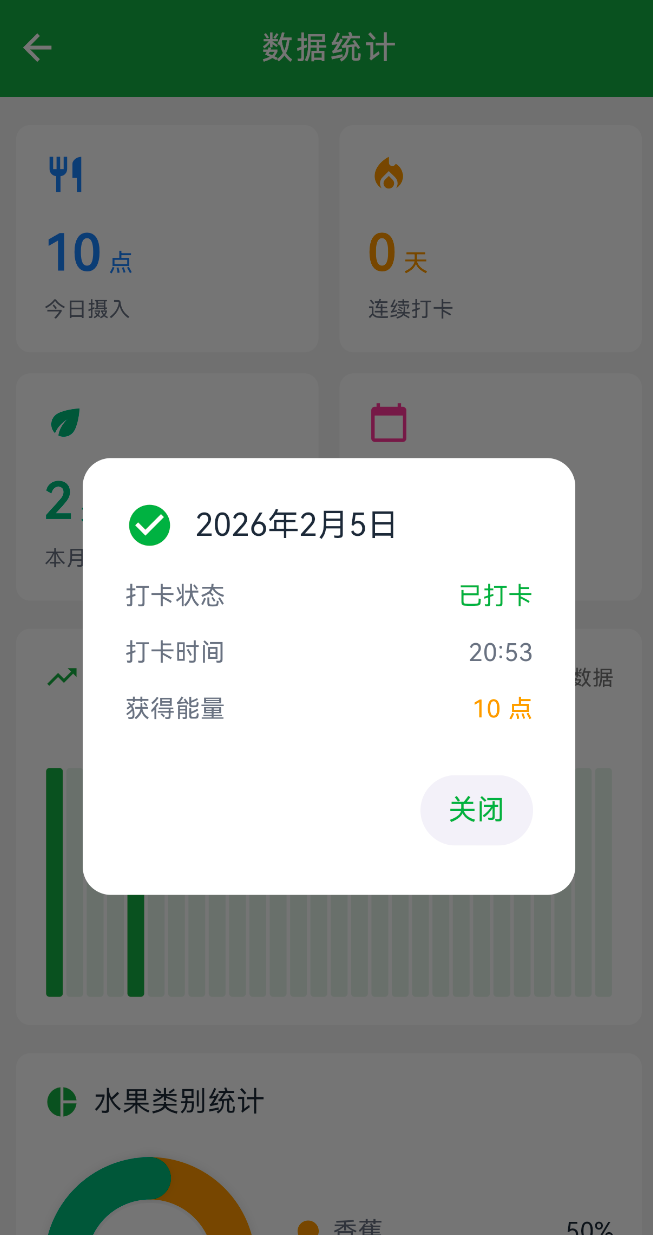
- 点击柱状图的某一天,弹窗显示那天的打卡详情
- 底部是水果类别统计,用环形图显示本月吃了哪些水果的占比
- 支持下拉刷新
3. 数据结构
页面用的是 StatefulWidget,需要管理多个数据源。
class _StatisticsPageState extends State<StatisticsPage> {
  DataStatistics? _statistics;              // 数据统计(累计打卡、连续打卡等)
  MonthlyStatistics? _monthlyStats;         // 月度统计
  List<CalendarDate> _calendarData = [];    // 日历数据(用于柱状图)
  List<CheckInHistoryRecord> _historyRecords = []; // 打卡历史(用于水果统计)
  bool _loading = true;                     // 加载状态
}
数据模型(在 check_in_model.dart 里)
class DataStatistics {
  final int totalCheckInDays;    // 累计打卡天数
  final int currentStreak;       // 连续打卡天数
  final int longestStreak;       // 最长连续打卡
  final int totalEnergyPoints;   // 总能量值
}

class CalendarDate {
  final String date;             // 日期 "2025-02-05"
  final bool hasCheckedIn;       // 是否打卡
  final String? checkInTime;     // 打卡时间
  final int energyPoints;        // 能量值
}

class CheckInHistoryRecord {
  final String date;             // 日期
  final String time;             // 时间
  final String fruitName;        // 水果名称
  final int fruitCount;          // 数量
  // ... 其他字段
}
4. 功能实现
4.1 数据加载
页面打开时,并行加载 4 个接口的数据
Future<void> _loadStatistics() async {
  setState(() => _loading = true);

  final now = DateTime.now();

  // 并行加载 4 个接口
  final results = await Future.wait([
    CheckInApi.getDataStatistics(),                              // 数据统计
    CheckInApi.getMonthlyStatistics(),                           // 月度统计
    CheckInApi.getCheckInCalendar(year: now.year, month: now.month), // 日历数据
    CheckInApi.getCheckInHistory(page: 1, pageSize: 100),        // 打卡历史
  ]);

  if (mounted) {
    setState(() {
      _statistics = results[0] as DataStatistics?;
      _monthlyStats = results[1] as MonthlyStatistics?;
      final calendarResponse = results[2] as CalendarResponse?;
      _calendarData = calendarResponse?.calendar ?? [];
      final historyResponse = results[3] as CheckInHistoryResponse?;
      _historyRecords = historyResponse?.records ?? [];
      _loading = false;
    });
  }
}
用 Future.wait 并行请求,比一个一个请求快多了。
4.2 统计卡片网格
顶部 4 个卡片,2x2 布局
Widget _buildStatsGrid() {
  final totalDays = _statistics?.totalCheckInDays ?? 0;
  final currentStreak = _statistics?.currentStreak ?? 0;

  // 计算今日摄入(从日历数据里找今天的能量值)
  final now = DateTime.now();
  final todayStr = '${now.year}-${now.month.toString().padLeft(2, '0')}-${now.day.toString().padLeft(2, '0')}';
  int todayEnergyPoints = 0;

  try {
    final todayData = _calendarData.firstWhere(
      (d) => d.date == todayStr && d.hasCheckedIn,
      orElse: () => CalendarDate(date: todayStr, hasCheckedIn: false, energyPoints: 0),
    );
    todayEnergyPoints = todayData.energyPoints;
  } catch (e) {}

  // 计算本月打卡天数
  final checkedInDays = _calendarData.where((d) => d.hasCheckedIn).length;

  return Padding(
    padding: const EdgeInsets.symmetric(horizontal: 16),
    child: Column(
      children: [
        Row(
          children: [
            Expanded(child: _buildStatCard('$todayEnergyPoints', '点', '今日摄入', Icons.restaurant, Color(0xFF3B82F6))),
            const SizedBox(width: 12),
            Expanded(child: _buildStatCard('$currentStreak', '天', '连续打卡', Icons.local_fire_department, Color(0xFFF59E0B))),
          ],
        ),
        const SizedBox(height: 12),
        Row(
          children: [
            Expanded(child: _buildStatCard('$checkedInDays', '天', '本月打卡', Icons.eco, Color(0xFF10B981))),
            const SizedBox(width: 12),
            Expanded(child: _buildStatCard('$totalDays', '天', '累计打卡', Icons.calendar_today, Color(0xFFEC4899))),
          ],
        ),
      ],
    ),
  );
}
每个卡片的结构
Widget _buildStatCard(String value, String unit, String label, IconData icon, Color color) {
  return Container(
    padding: const EdgeInsets.all(16),
    decoration: BoxDecoration(
      color: Colors.white,
      borderRadius: BorderRadius.circular(8),
    ),
    child: Column(
      crossAxisAlignment: CrossAxisAlignment.start,
      children: [
        Icon(icon, color: color, size: 24),
        const SizedBox(height: 12),
        Row(
          crossAxisAlignment: CrossAxisAlignment.end,
          children: [
            Text(value, style: TextStyle(fontSize: 28, fontWeight: FontWeight.bold, color: color)),
            const SizedBox(width: 4),
            Padding(
              padding: const EdgeInsets.only(bottom: 4),
              child: Text(unit, style: TextStyle(fontSize: 14, color: color)),
            ),
          ],
        ),
        const SizedBox(height: 4),
        Text(label, style: const TextStyle(fontSize: 12, color: Color(0xFF6B7280))),
      ],
    ),
  );
}
4.3 月度打卡趋势图
这是个简化版的柱状图,每天一根柱子,打卡了是深绿色,没打卡是淡绿色。
Widget _buildSimpleBarChart() {
  if (_calendarData.isEmpty) {
    return SizedBox(
      height: 150,
      child: Center(child: Text('暂无数据', style: TextStyle(color: Colors.grey[400], fontSize: 14))),
    );
  }

  final now = DateTime.now();
  final daysInMonth = DateTime(now.year, now.month + 1, 0).day;

  // 创建每天的打卡状态数组
  final List<int> dailyCheckIns = List.filled(daysInMonth, 0);

  // 填充实际打卡数据
  for (var calendarDate in _calendarData) {
    try {
      final date = DateTime.parse(calendarDate.date);
      if (date.month == now.month && date.year == now.year) {
        final day = date.day;
        if (day >= 1 && day <= daysInMonth) {
          dailyCheckIns[day - 1] = calendarDate.hasCheckedIn ? 1 : 0;
        }
      }
    } catch (e) {}
  }

  // 渲染柱状图
  return SizedBox(
    height: 150,
    child: Row(
      crossAxisAlignment: CrossAxisAlignment.end,
      mainAxisAlignment: MainAxisAlignment.spaceEvenly,
      children: List.generate(daysInMonth, (index) {
        final hasCheckedIn = dailyCheckIns[index] == 1;
        final day = index + 1;

        // 查找该天的打卡详情
        CalendarDate? dayData;
        try {
          final dateStr = '${now.year}-${now.month.toString().padLeft(2, '0')}-${day.toString().padLeft(2, '0')}';
          dayData = _calendarData.firstWhere(
            (d) => d.date == dateStr,
            orElse: () => CalendarDate(date: dateStr, hasCheckedIn: false, energyPoints: 0),
          );
        } catch (e) {}

        return Expanded(
          child: GestureDetector(
            onTap: () => _showDayDetailDialog(day, dayData),
            child: Container(
              margin: const EdgeInsets.symmetric(horizontal: 1),
              height: 130.0,  // 所有柱子都是满高度
              decoration: BoxDecoration(
                color: hasCheckedIn
                    ? const Color(0xFF4CAF50)  // 已打卡:深绿色
                    : const Color(0xFFE8F5E9), // 未打卡:淡绿色
                borderRadius: BorderRadius.circular(2),
              ),
            ),
          ),
        );
      }),
    ),
  );
}
关键点:
- 所有柱子高度一样(130),不是按数值比例变化的
- 用颜色区分打卡状态,不是用高度
- 每根柱子都可以点击,弹窗显示详情
4.4 点击柱子显示详情
点击某一天的柱子,弹窗显示那天的打卡详情
void _showDayDetailDialog(int day, CalendarDate? dayData) {
  final now = DateTime.now();
  final year = now.year;
  final month = now.month;

  showDialog(
    context: context,
    builder: (BuildContext context) {
      return AlertDialog(
        backgroundColor: Colors.white,
        shape: RoundedRectangleBorder(borderRadius: BorderRadius.circular(16)),
        title: Row(
          children: [
            Icon(
              dayData?.hasCheckedIn == true ? Icons.check_circle : Icons.cancel,
              color: dayData?.hasCheckedIn == true ? const Color(0xFF4CAF50) : Colors.grey,
              size: 28,
            ),
            const SizedBox(width: 12),
            Text('$year年$month月$day日', style: const TextStyle(fontSize: 18, fontWeight: FontWeight.w500)),
          ],
        ),
        content: Column(
          mainAxisSize: MainAxisSize.min,
          crossAxisAlignment: CrossAxisAlignment.start,
          children: [
            _buildDetailRow('打卡状态', dayData?.hasCheckedIn == true ? '已打卡' : '未打卡',
                dayData?.hasCheckedIn == true ? const Color(0xFF4CAF50) : Colors.grey),
            const SizedBox(height: 12),
            if (dayData?.hasCheckedIn == true) ...[
              _buildDetailRow('打卡时间', dayData?.checkInTime ?? '未知', const Color(0xFF6B7280)),
              const SizedBox(height: 12),
              _buildDetailRow('获得能量', '${dayData?.energyPoints ?? 0} 点', const Color(0xFFF59E0B)),
            ] else ...[
              const Text('该日期未打卡', style: TextStyle(fontSize: 14, color: Color(0xFF6B7280))),
            ],
          ],
        ),
        actions: [
          TextButton(
            onPressed: () => Navigator.of(context).pop(),
            child: const Text('关闭', style: TextStyle(color: Color(0xFF4CAF50), fontSize: 16)),
          ),
        ],
      );
    },
  );
}

Widget _buildDetailRow(String label, String value, Color valueColor) {
  return Row(
    mainAxisAlignment: MainAxisAlignment.spaceBetween,
    children: [
      Text(label, style: const TextStyle(fontSize: 14, color: Color(0xFF6B7280))),
      Text(value, style: TextStyle(fontSize: 14, fontWeight: FontWeight.w500, color: valueColor)),
    ],
  );
}
4.5 水果类别统计(环形图)
底部的环形图,显示本月吃了哪些水果的占比。
4.5.1 数据统计
先统计本月每种水果的打卡次数
Widget _buildFruitCategoryChart() {
  final now = DateTime.now();
  final Map<String, int> fruitCounts = {};
  int totalCount = 0;

  // 统计本月每种水果的打卡次数
  for (var record in _historyRecords) {
    try {
      final recordDate = DateTime.parse(record.date);
      if (recordDate.year == now.year && recordDate.month == now.month) {
        final fruitName = record.fruitName;
        fruitCounts[fruitName] = (fruitCounts[fruitName] ?? 0) + 1;
        totalCount++;
      }
    } catch (e) {}
  }

  // 按数量排序,取前 4 个
  final sortedFruits = fruitCounts.entries.toList()
    ..sort((a, b) => b.value.compareTo(a.value));

  // 准备图表数据
  final List<Map<String, dynamic>> chartData = [];
  final colors = [
    const Color(0xFFF59E0B),  // 橙色
    const Color(0xFF10B981),  // 绿色
    const Color(0xFF3B82F6),  // 蓝色
    const Color(0xFFEC4899),  // 粉色
  ];

  for (int i = 0; i < sortedFruits.length && i < 4; i++) {
    final entry = sortedFruits[i];
    final percentage = totalCount > 0 ? (entry.value / totalCount * 100) : 0;
    chartData.add({
      'name': entry.key,
      'count': entry.value,
      'percentage': percentage,
      'color': colors[i],
    });
  }

  // ... 渲染环形图和图例
}
4.5.2 环形图渲染
环形图用 CustomPaint 自己画:
// 环形图
SizedBox(
  width: 120,
  height: 120,
  child: CustomPaint(painter: _DonutChartPainter(chartData)),
)
自定义绘制器:
class _DonutChartPainter extends CustomPainter {
  final List<Map<String, dynamic>> data;

  _DonutChartPainter(this.data);

  @override
  void paint(Canvas canvas, Size size) {
    if (data.isEmpty) return;

    final center = Offset(size.width / 2, size.height / 2);
    final radius = size.width / 2;
    final strokeWidth = 24.0;  // 环形宽度

    final paint = Paint()
      ..style = PaintingStyle.stroke
      ..strokeWidth = strokeWidth
      ..strokeCap = StrokeCap.round;  // 圆角端点

    double startAngle = -90 * (3.14159 / 180);  // 从顶部开始(-90度)

    // 先画阴影
    final shadowPaint = Paint()
      ..style = PaintingStyle.stroke
      ..strokeWidth = strokeWidth
      ..strokeCap = StrokeCap.round
      ..color = Colors.black.withOpacity(0.1)
      ..maskFilter = const MaskFilter.blur(BlurStyle.normal, 3);

    for (var item in data) {
      final percentage = item['percentage'] as double;
      final sweepAngle = (percentage / 100 * 360) * (3.14159 / 180);  // 转成弧度

      // 绘制阴影
      canvas.drawArc(
        Rect.fromCircle(center: center, radius: radius - strokeWidth / 2),
        startAngle,
        sweepAngle,
        false,
        shadowPaint,
      );

      // 绘制彩色环形
      paint.color = item['color'] as Color;
      canvas.drawArc(
        Rect.fromCircle(center: center, radius: radius - strokeWidth / 2),
        startAngle,
        sweepAngle,
        false,
        paint,
      );

      startAngle += sweepAngle;  // 下一段从这里开始
    }

    // 绘制中心白色圆形(增强立体感)
    final centerCirclePaint = Paint()
      ..color = Colors.white
      ..style = PaintingStyle.fill;

    canvas.drawCircle(center, radius - strokeWidth - 2, centerCirclePaint);
  }

  @override
  bool shouldRepaint(covariant CustomPainter oldDelegate) => true;
}
关键点:
drawArc画圆弧,参数是起始角度和扫过的角度
- 角度要转成弧度:
角度 * (π / 180)
-90度是从顶部开始(12 点钟方向)
strokeCap: StrokeCap.round让端点是圆角的
- 中间画个白色圆,形成环形效果
4.5.3 图例
环形图右边是图例,显示每种水果的名称和占比:
Widget _buildLegendItem(String label, Color color, String percentage) {
  return Row(
    children: [
      Container(
        width: 12,
        height: 12,
        decoration: BoxDecoration(color: color, shape: BoxShape.circle),
      ),
      const SizedBox(width: 8),
      Text(label, style: const TextStyle(fontSize: 14, color: Color(0xFF6B7280))),
      const Spacer(),
      Text(percentage, style: const TextStyle(fontSize: 14, fontWeight: FontWeight.w500, color: Color(0xFF1F2937))),
    ],
  );
}
4.6 下拉刷新
整个页面用 RefreshIndicator 包裹,支持下拉刷新:
body: _loading
    ? const Center(child: CircularProgressIndicator())
    : RefreshIndicator(
        onRefresh: _loadStatistics,  // 刷新时重新加载数据
        child: SingleChildScrollView(
          physics: const AlwaysScrollableScrollPhysics(),  // 即使内容不够也能下拉
          child: Column(children: [...]),
        ),
      ),
5. API 接口
调用了 4 个接口:
// 1. 数据统计
CheckInApi.getDataStatistics()
// 返回:累计打卡、连续打卡、最长连续、总能量// 2. 月度统计
CheckInApi.getMonthlyStatistics()
// 返回:本月打卡天数、完成率等// 3. 日历数据
CheckInApi.getCheckInCalendar(year: year, month: month)
// 返回:每天的打卡状态和能量值// 4. 打卡历史
CheckInApi.getCheckInHistory(page: 1, pageSize: 100)
// 返回:打卡记录列表(包含水果名称)
6. 总结
这页面最麻烦的是环形图,要自己用
CustomPaint画。
drawArc这个方法参数有点绕,起始角度和扫过的角度都要用弧度,不是角度。而且坐标系是从 3 点钟方向(0 度)开始顺时针转的,要从 12 点钟开始就得用 -90 度。百分比转角度也要算对:
percentage / 100 * 360,然后再转成弧度* (π / 180)。每画完一段,下一段的起始角度要加上这段的扫过角度,不然就重叠了。柱状图倒是简单,就是一排
Container,用Expanded让它们平分宽度。所有柱子高度一样,只是颜色不同。本来想按能量值调整高度的,但那样视觉效果不好,还是统一高度看着舒服。统计卡片那块要注意,今日摄入的能量值要从日历数据里找今天的记录,不是从
DataStatistics里拿的。因为DataStatistics返回的是累计总能量,不是今天的。水果统计那里,要遍历打卡历史记录,过滤出本月的,然后按水果名称分组计数。用
Map<String, int>存,key 是水果名,value 是次数。最后排个序取前 4 个,超过 4 种就不显示了,不然环形图太挤。并行加载 4 个接口用
Future.wait很方便,比一个一个 await 快多了。但要注意类型转换,results[0]拿到的是Object?,要手动转成对应的类型。

有“AI”的1024 = 2048,欢迎大家加入2048 AI社区
更多推荐

 4
4 0
0- 0


 已为社区贡献2条内容

所有评论(0)