Basic statistics - 10. The unpaired t-test | Independent samples t-test
The unpaired t-test | Independent samples t-test
Basic definition
One-sample t-test : Basic statistics - 07. The one-sample t-test and p-values
Unpaired Test
Example: When
Note: Two different groups should be independent.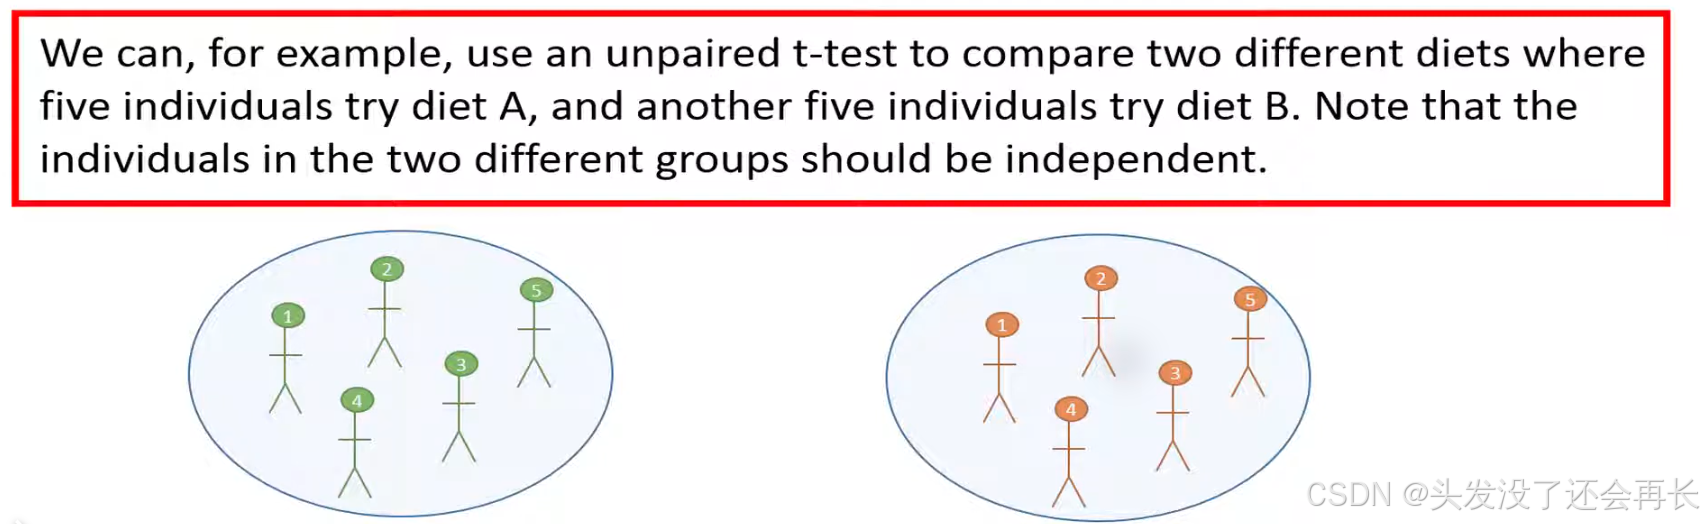
In blow, we should used paired t-test: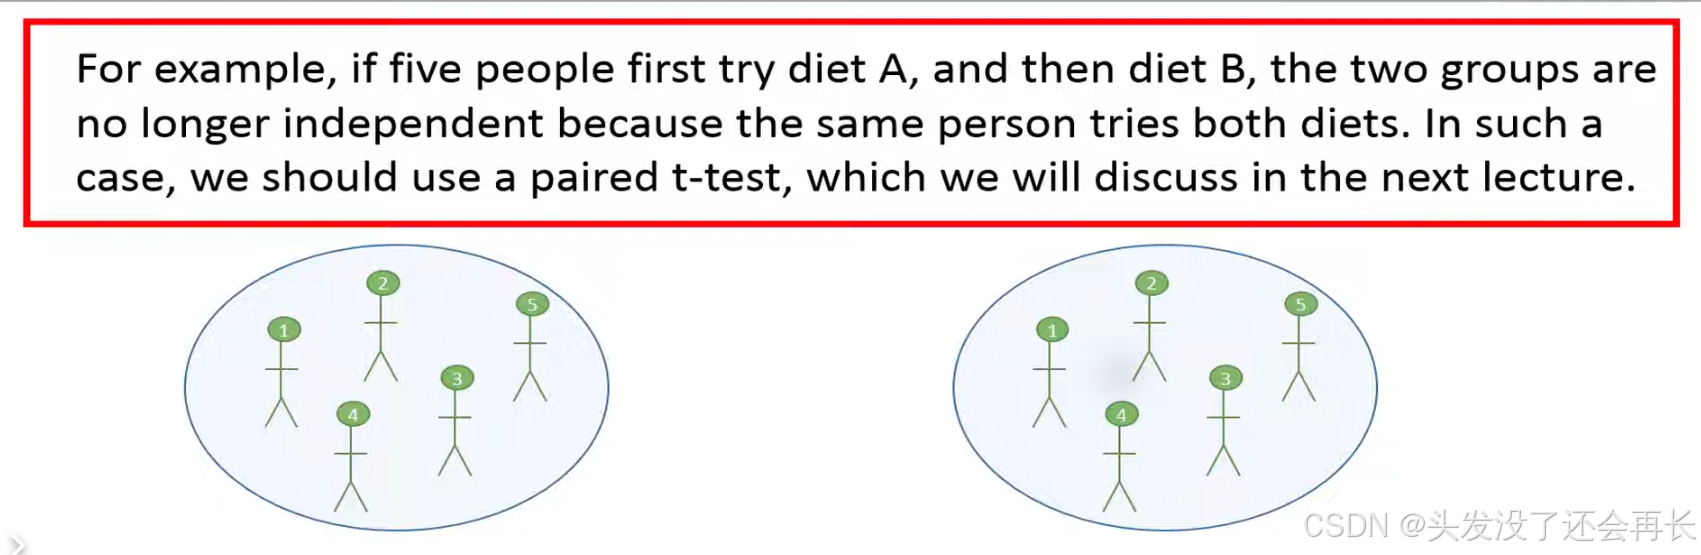
Another example:
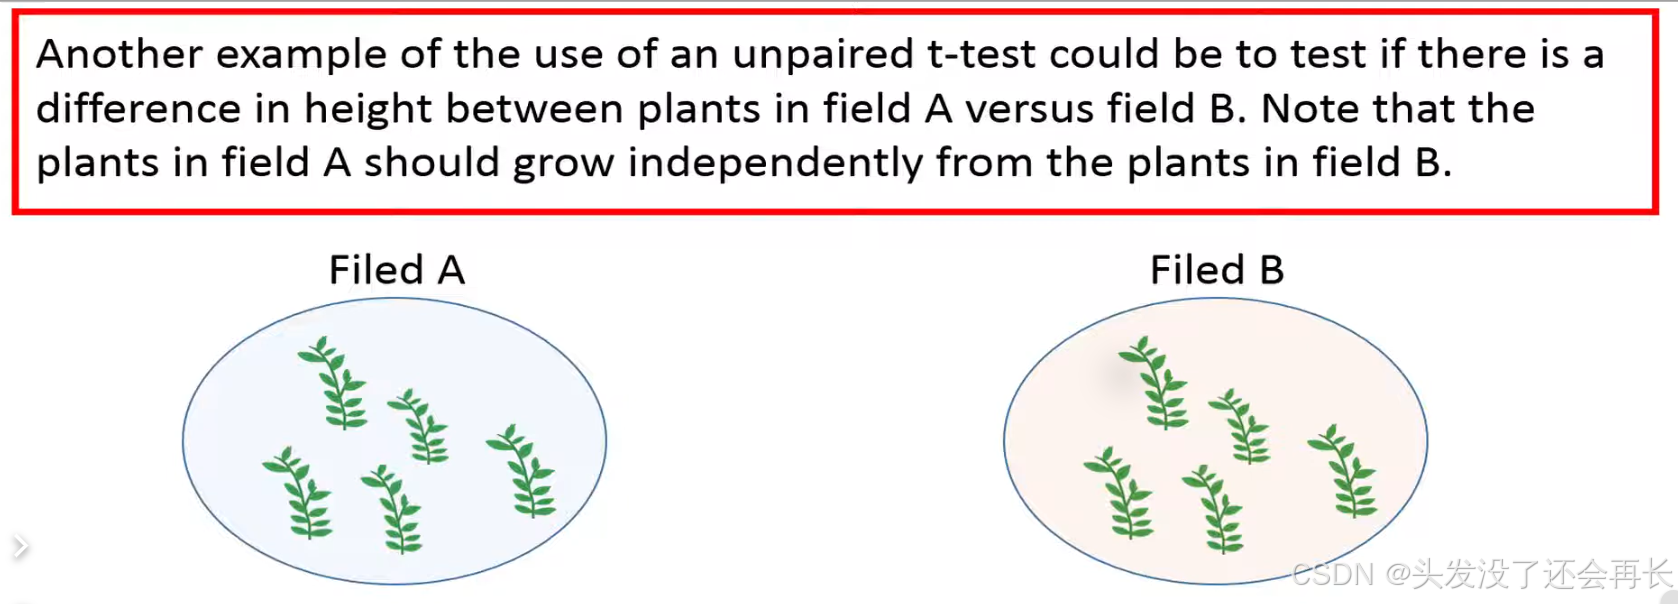
Example: How
How an unpaired t-test works by using the following example, we want to test if the upper blood pressure is different between people in the age 20 to 35 compared to people in the age 36 to 55.
To test this one is collected four random individuals from the relevant population where people are at age between 20 to 35 and four individuals from the population where people are in age between 36 to 55.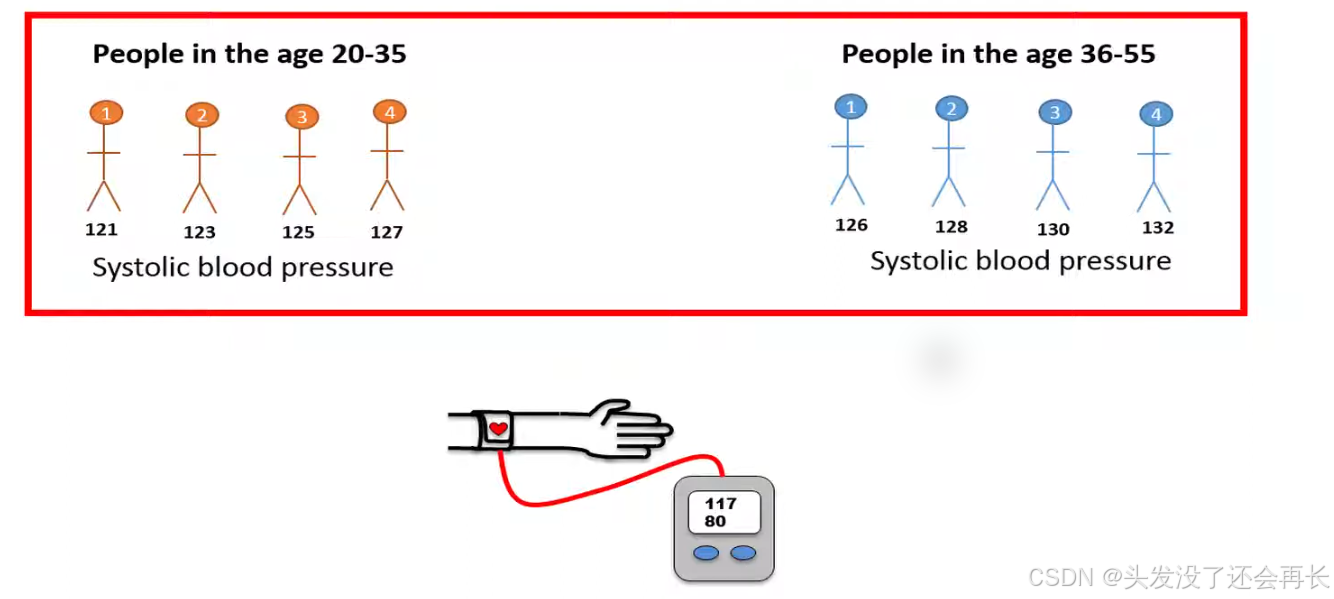
We’ll use unpaired t-test to test if there is a difference in the high blood pressure between people in the two age groups.
The null hypothesis in this case states that the two population means are equal.
The H1 is means historic blood pressure is different between the two age groups.
We set the significant level alpha = 0.05.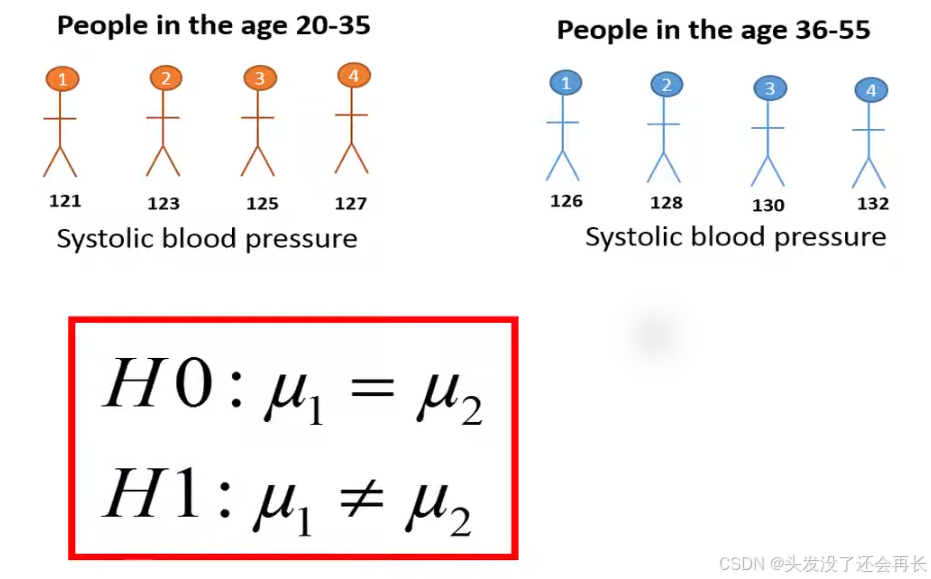
let’s first calculate the means stored blood pressure for the two age groups. The means is total blood pressure of the four individuals in the younger group is 124 and 129 of the four individuals in the older group. We can see that the mean pressure is higher in order group than younger group, but we can’t be sure if this result is duo to chance, because we randomly choose eight people from population.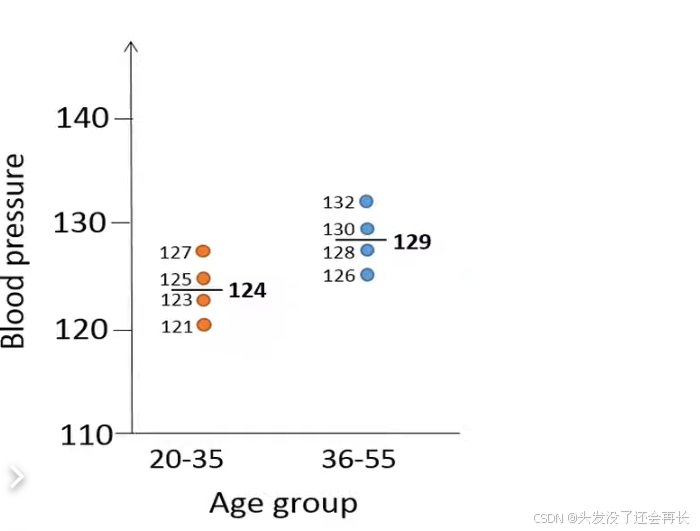
So the unpaired t-test can help us determine if this absurd difference in the sample means is due to chance or if it’s actually reflects that there is a true difference in the means of systolic blood pressure.
size since we have four observations from each group our two groups have the same sample size. X bar 1 denotes a sample mean of group 1, X bar 2 denotes a sample mean of group 2, so numerator represents the difference between two groups. S1 represents the sample variance of group 1, S2 represents the sample variance of group 1, the n1 and n2 denote the sample size of group 1 an group 2.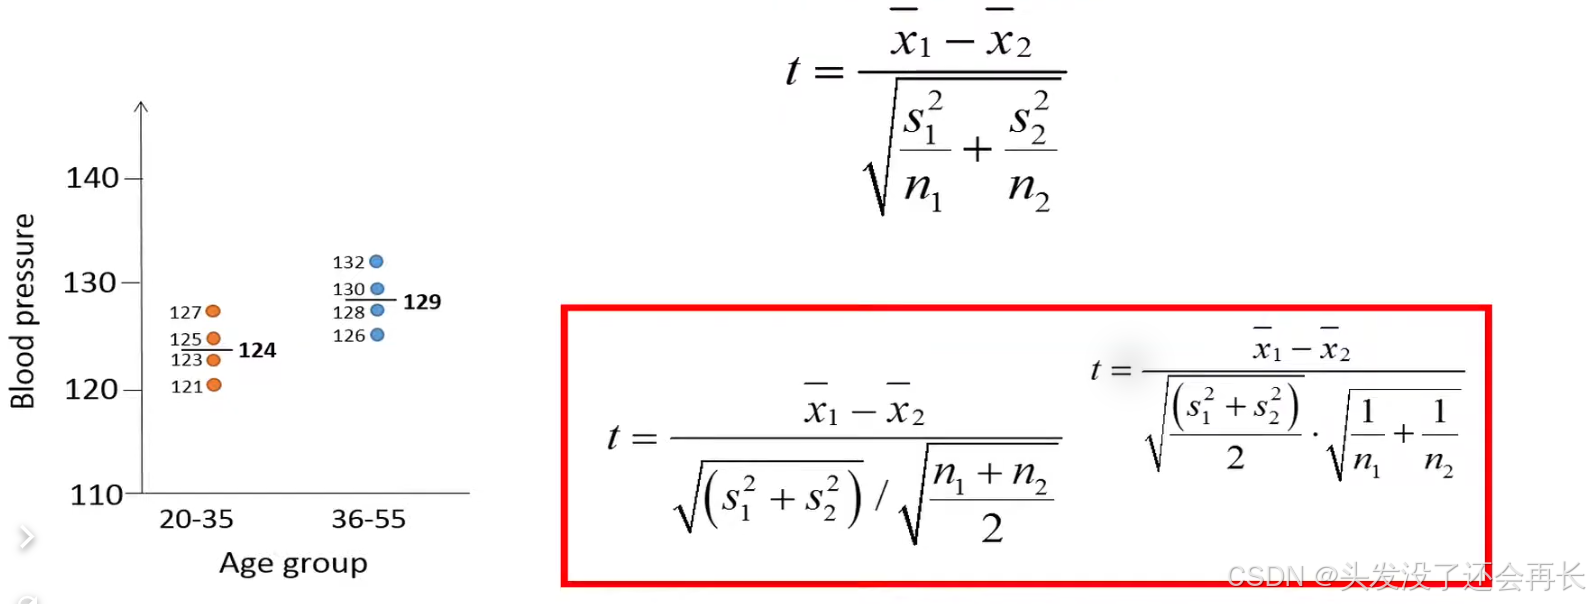
Remember that the sample variance is calculated at the sum of the square differences between observations and the mean divided by n minus 1. for example to calculate the variance of group 2.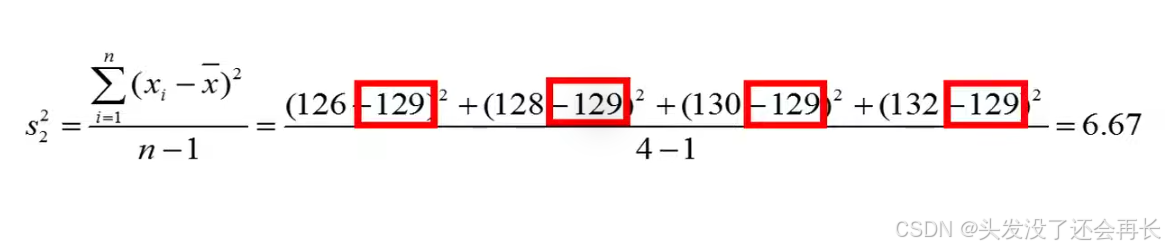
The square root of the variance divided by the sample size is the standard error of the mean.
The denominator therefore represents the standard error of the difference between the two sample means, which tells us the uncertainty of the difference we have observed, this equation is only valid if the two groups have the same sample size.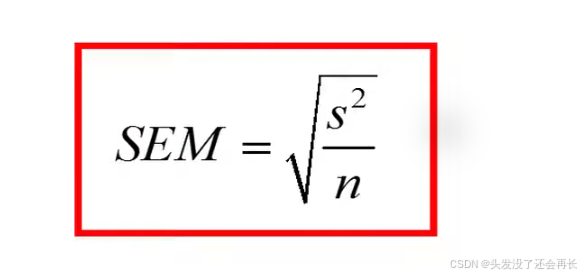
if the sample sizes of the two groups are not equal, the equation will become more complicated. this is because we put more weight on the variance of the group with the largest sample size.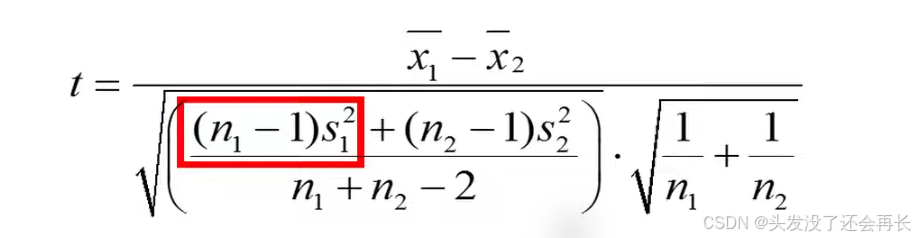
Then we can calculate t=-2.74, which represents our t statistic this number can be interpreted as the younger individuals have systolic blood pressure that is on average 2.74 standard errors lower than the older individuals.
We use t-distribution with degrees of freedom = total sample size - 2, 2 is because we estimate two means.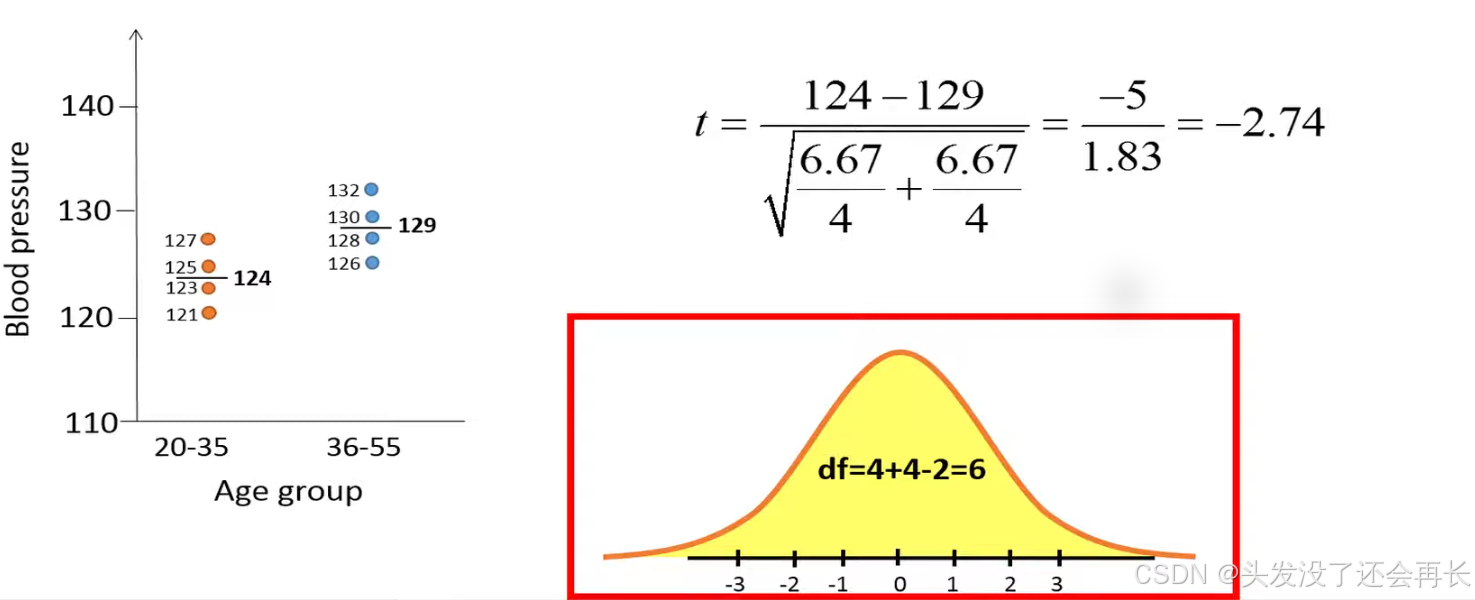
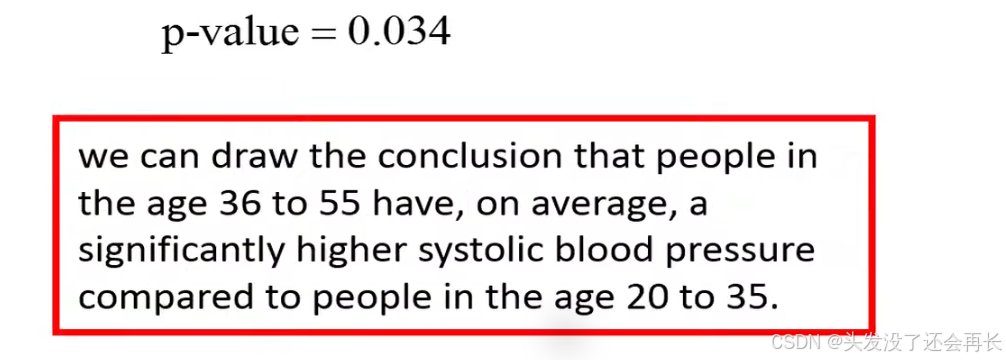
The we can calculate the area at the left-hand side of -2.74 and to the right-hand side of 2.74. We used two-sided test, the area is 0.034, so p-value = 0.034.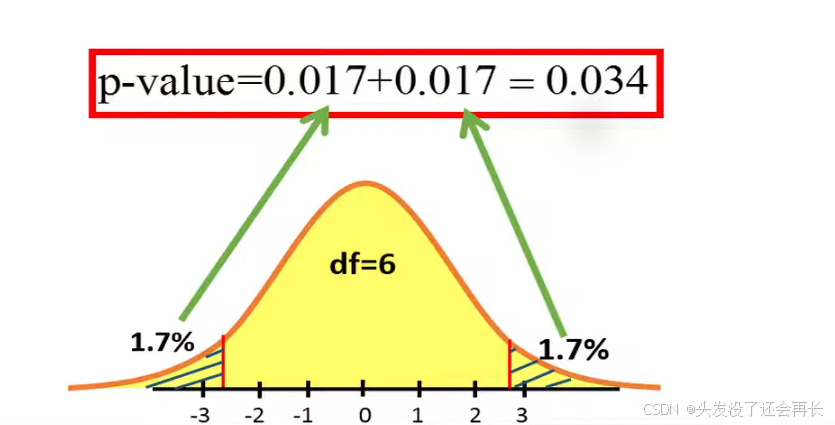
And the results from a t-test are usually reported together with 95 confidence interval this equation can be used to calculate the confidence interval for the difference between the means.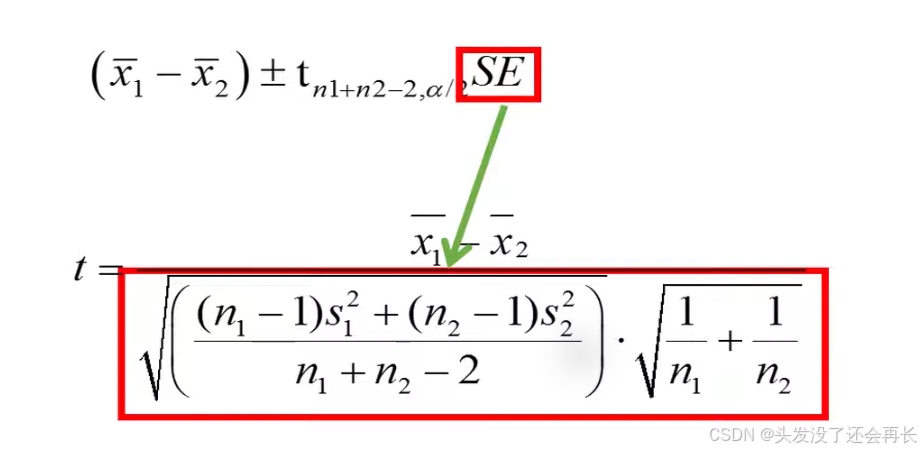
we see that we are 95 certain that the two difference between the population means lies somewhere between negative 9.5 and negative 0.5.
Note that this interval does not include the value 0, because 0 is greater than the upper limit of the confidence interval.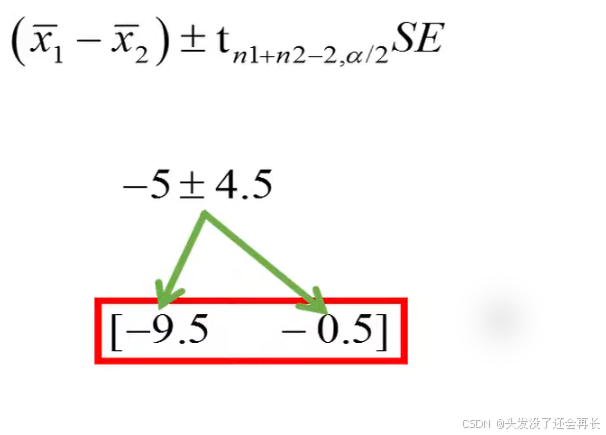

有“AI”的1024 = 2048,欢迎大家加入2048 AI社区
更多推荐

 9
9 0
0- 0


 已为社区贡献9条内容

所有评论(0)