Grafana可视化图形工具
Grafana是一个跨平台的开源的度量分析和可视化工具,可以通过将采集的数据查询然后可视化的展示,并及时通知。展示方式:快速灵活的客户端图表,面板插件有许多不同方式的可视化指标和日志,官方库中具有丰富的仪表盘插件,比如热图、折线图、图表等多种展示方式;数据源:Graphite,InfluxDB,OpenTSDB,Prometheus,Elasticsearch,CloudWatch和KairosD
·
1、什么是Grafana
Grafana是一个跨平台的开源的度量分析和可视化工具,可以通过将采集的数据查询然后可视化的展示,并及时通知。它主要有以下六大特点:
- 展示方式:快速灵活的客户端图表,面板插件有许多不同方式的可视化指标和日志,官方库中具有丰富的仪表盘插件,比如热图、折线图、图表等多种展示方式;
- 数据源:Graphite,InfluxDB,OpenTSDB,Prometheus,Elasticsearch,CloudWatch和KairosDB等;
- 通知提醒:以可视方式定义最重要指标的警报规则,Grafana将不断计算并发送通知,在数据达到阈值时通过Slack、PagerDuty等获得通知;
- 混合展示:在同一图表中混合使用不同的数据源,可以基于每个查询指定数据源,甚至自定义数据源;
- 注释:使用来自不同数据源的丰富事件注释图表,将鼠标悬停在事件上会显示完整的事件元数据和标记;
- 过滤器:Ad-hoc过滤器允许动态创建新的键/值过滤器,这些过滤器会自动应用于使用该数据源的所有查询。
2、下载安装Grafana
2.1、下载
地址:https://grafana.com/grafana/download
[root@hyy-1 prometheus]# wget https://dl.grafana.com/oss/release/grafana-7.2.0-1.x86_64.rpm2.2、安装Grafana
[root@hyy-1 prometheus]# yum install grafana-7.2.0-1.x86_64.rpm -y

# 启动服务
[root@hyy-1 prometheus]# systemctl enable --now grafana-server
[root@hyy-1 prometheus]# netstat -lnupt | grep 3000
tcp6       0      0 :::3000                 :::*                    LISTEN      5249/grafana-server
使用grafana-cli安装插件
grafana-cli plugins list-remote 列出所有可用的插件

grafana-cli plugins install grafana-worldmap-panel 安装世界地图插件
grafana-cli plugins install grafana-clock-panel 安装时间插件
grafana-cli plugins install grafana-piechart-panel 安装圆饼插件

grafana-cli plugins ls 列出已经安装的插件

安装完毕需要重启服务
systemctl restart grafana-server
2.3、使用Grafana连接Prometheus
2.3.1、登录grafana
通过浏览器访问 http:// grafana服务器IP:3000就到了登录界面,使用默认的admin用户,admin密码就可以登陆了 第一次需要修改admin密码

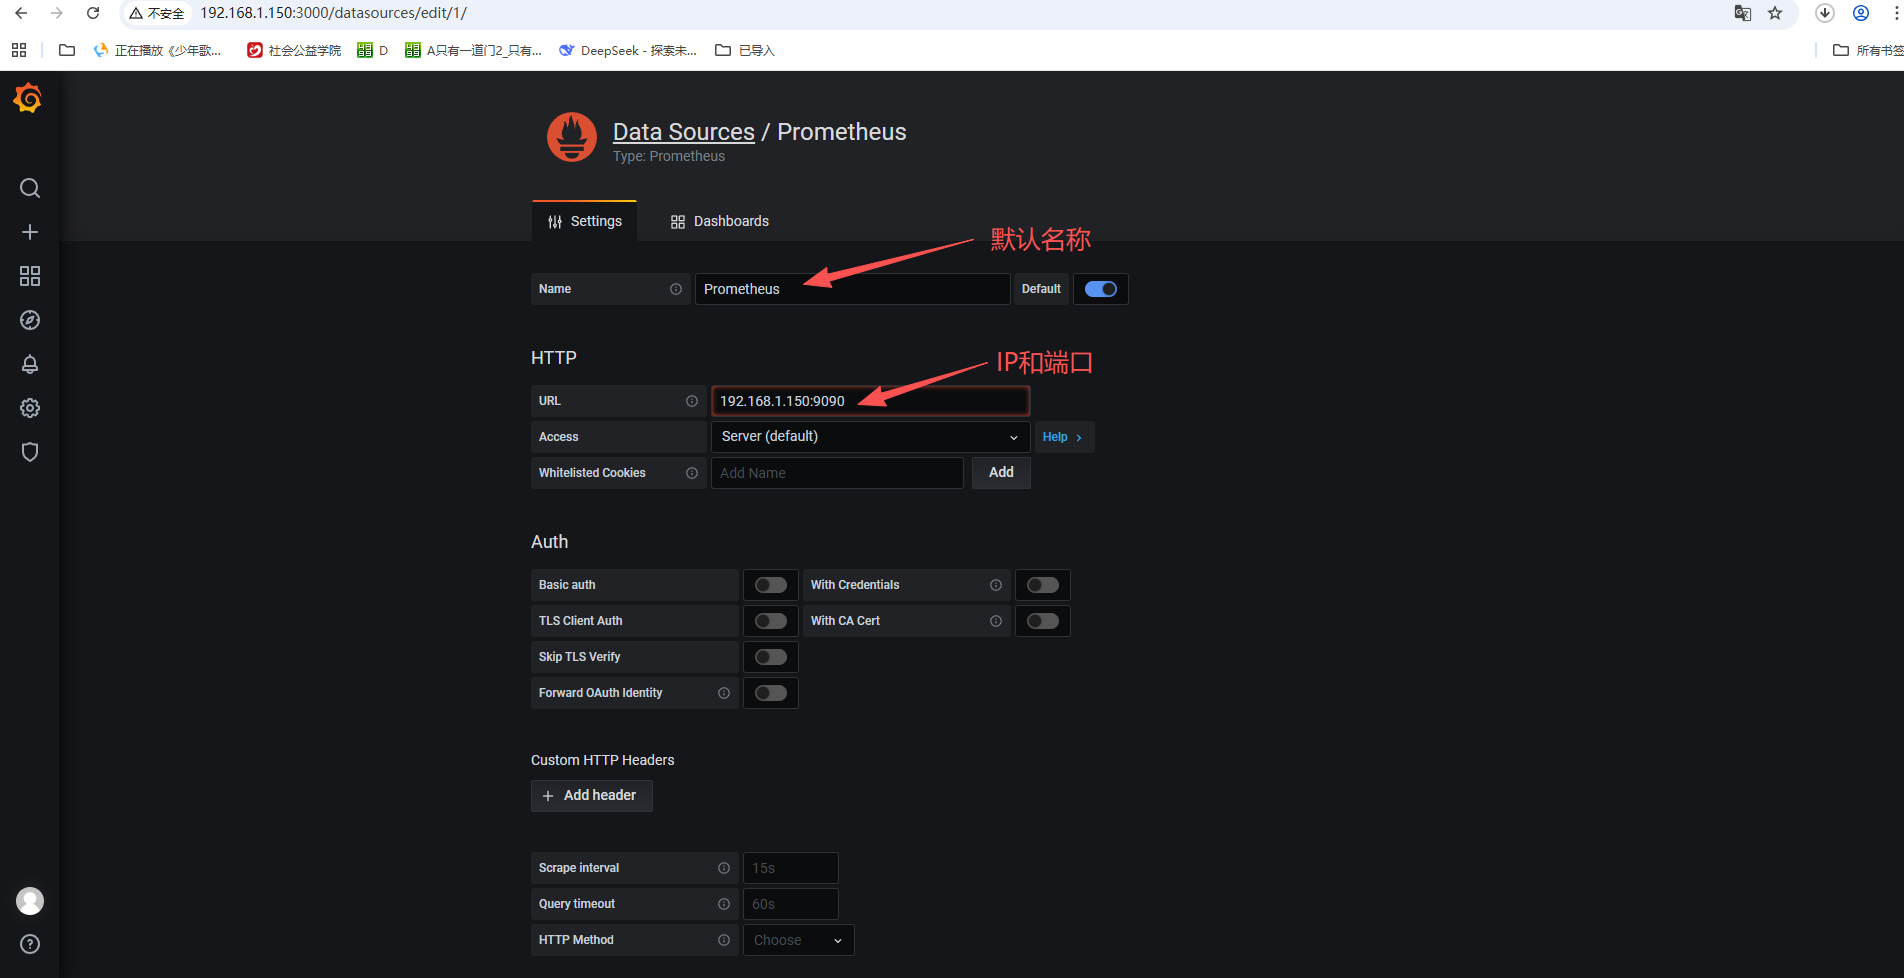
2.3.2、添加数据源
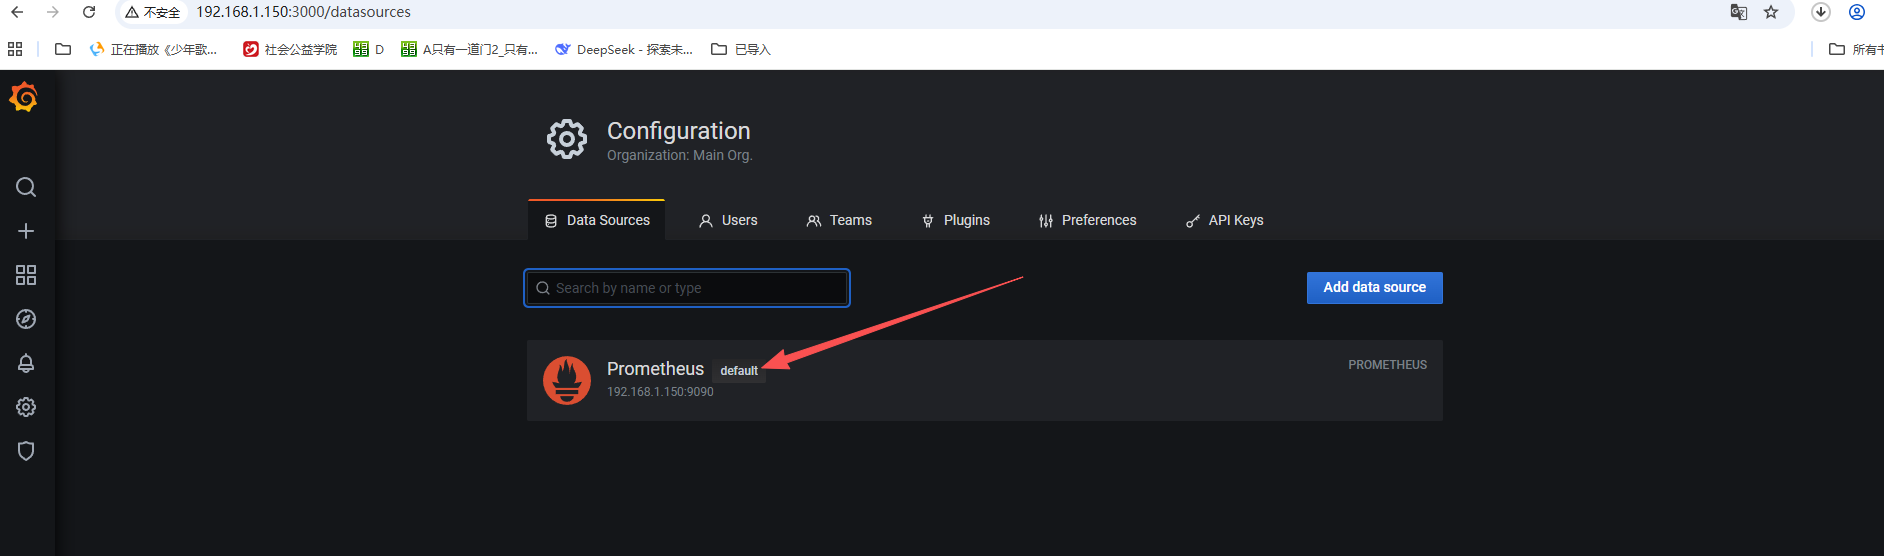
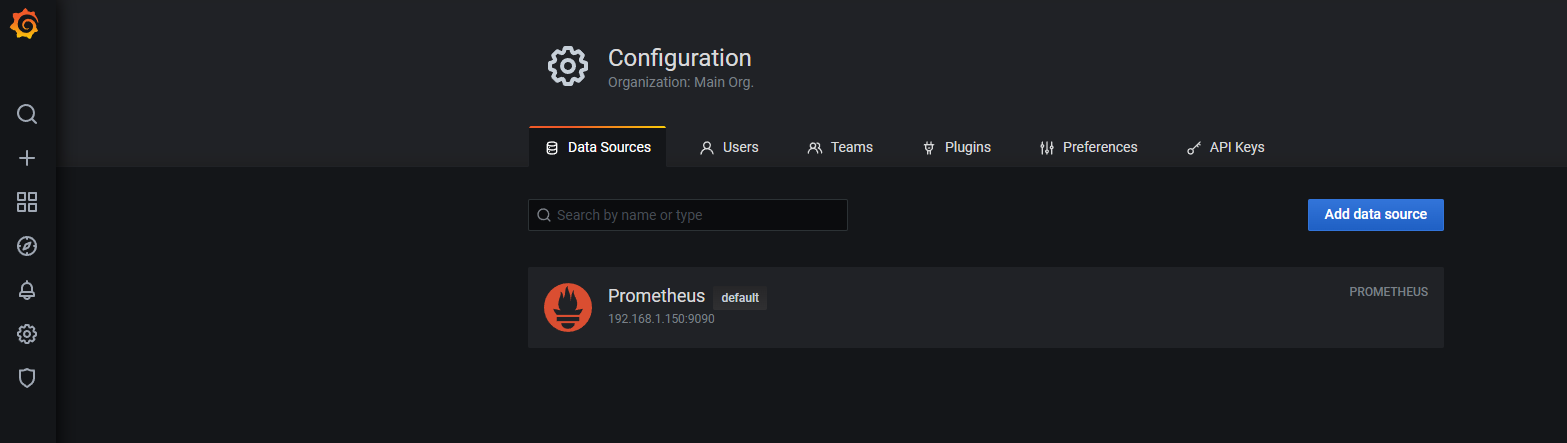
2.3.3、查看添加的数据源
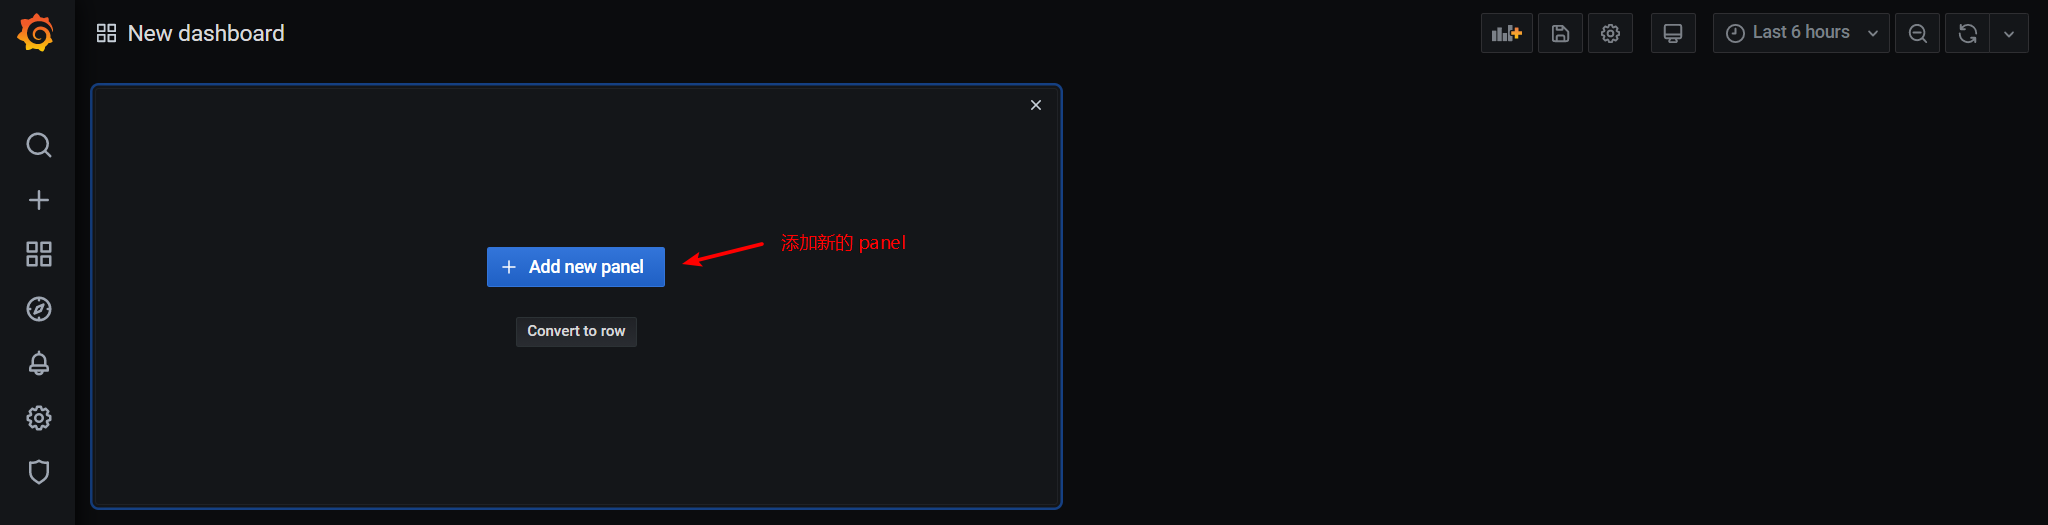
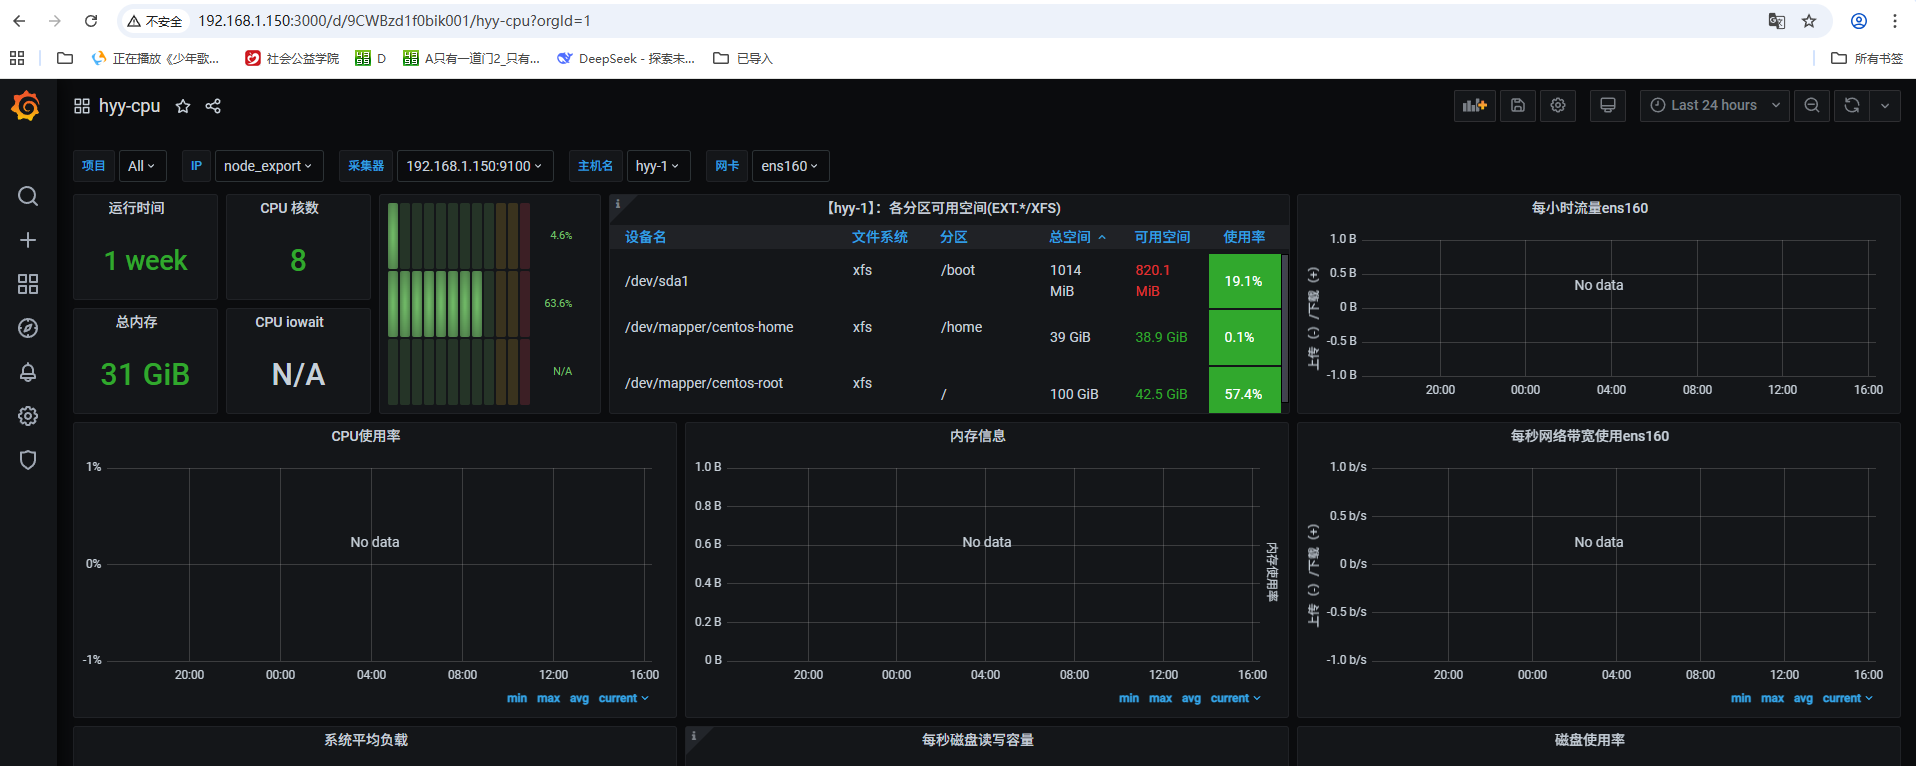
2.3.4、为添加好的数据源做图形显示
2.3.5、dashboard查看

有“AI”的1024 = 2048,欢迎大家加入2048 AI社区
更多推荐


 5
5 0
0- 0


 已为社区贡献2条内容

所有评论(0)