学习019-06-03 Display Areas on a Vector Map(在矢量地图上显示区域)
Display Areas on a Vector Map(在矢量地图上显示区域)
This topic describes how to show business objects as areas on a vector map.
本主题介绍如何在矢量地图上以区域形式显示业务对象。
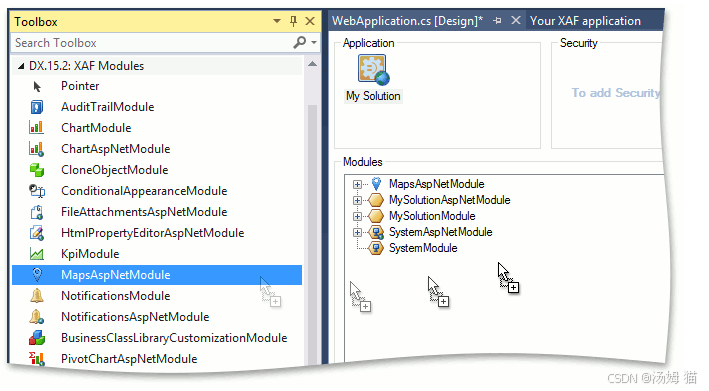
Run the Application Designer for the ASP.NET Web Forms application project. Drag the MapsAspNetModule component from the Toolbox to the designer’s Modules pane.
运行ASP.NET Web Forms应用程序项目的应用程序设计器。将“MapsAspNetModule”组件从“工具箱”拖到设计器的“模块”窗格中。
Implement the business class that supports the IAreaInfo interface. In the code below, a new Country business class is created. You can also support IAreaInfo in an existing business class.
实现支持 IAreaInfo 接口的业务类。在下面的代码中,创建了一个新的 Country 业务类。你也可以在现有业务类中支持 IAreaInfo。
C#
using DevExpress.Persistent.Base;
// ...
[DefaultClassOptions]
public class Country : IAreaInfo {
    [Browsable(false)]
    public int ID { get; set; }
    public string Title {
        get;
        set;
    }
    [Browsable(false)]
    public string Tooltip {
        get { return string.Format("<b>{0}</b><br/>Value = {1}", Title, Value); }
    }
    public float Value {
        get;
        set;
    }
}
The IAreaInfo.Tooltip return value supports HTML formatting. The first line of the tooltip will be the country name using the bold font, and the second will display the value associated with the current country.
IAreaInfo.Tooltip的返回值支持HTML格式。工具提示的第一行将以粗体显示国家名称,第二行将显示与当前国家相关联的值。
Note
The example above is for the Entity Framework. However, you can use a similar approach in an XPO persistent class. You can find the complete example for XPO in the Feature Center demo (see %PUBLIC%\Documents\DevExpress Demos 24.1\Components\XAF\FeatureCenter.NETFramework.XPO\CS\FeatureCenter.Module\ListEditors\VectorMapsListEditorDemoObject.cs).
上述示例适用于实体框架。不过,你可以在XPO持久化类中采用类似的方法。你可以在功能中心演示中找到XPO的完整示例(请参阅%PUBLIC%\Documents\DevExpress Demos 24.1\Components\XAF\FeatureCenter.NETFramework.XPO\CS\FeatureCenter.Module\ListEditors\VectorMapsListEditorDemoObject.cs)。
Run the Model Editor for the ASP.NET Web Forms application project and navigate to the Views | Location_ListView | VectorMapSettings node. Here, you can change the map options. For instance, set the IModelVectorMapSettings.Type property to Eurore.
运行ASP.NET Web Forms应用程序项目的模型编辑器,然后导航到“视图”|“Location_ListView”|“VectorMapSettings”节点。在此处,你可以更改地图选项。例如,将IModelVectorMapSettings.Type属性设置为Eurore。

Refer to the member list of the IModelMapSettings interface to see the descriptions of available options.
请参考IModelMapSettings接口的成员列表,查看可用选项的说明。
Tip
Note that the IModelListView.EditorType property of the Country_ListView node is set to WebVectorMapsListEditor. This is done automatically for any List View that displays IAreaInfo objects.
请注意,Country_ListView节点的IModelListView.EditorType属性设置为WebVectorMapsListEditor。对于任何显示IAreaInfo对象的列表视图,这都是自动完成的。
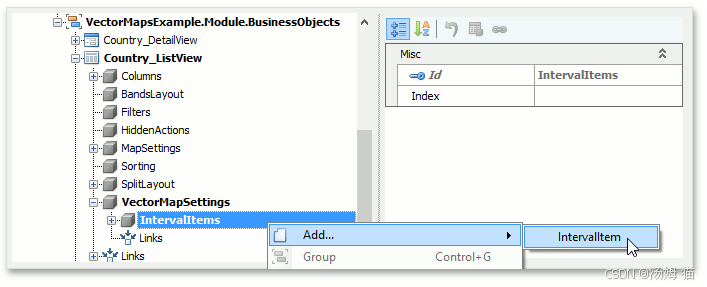
The VectorMapSettings | IntervalItems node (see IModelIntervalItems) allows you to categorize map areas by their associated values. You can use the Add… | IntervalItem context menu command to add the child IModelIntervalItem nodes to define bounds of categories.
VectorMapSettings | IntervalItems 节点(请参阅 IModelIntervalItems)允许您根据相关值对地图区域进行分类。您可以使用“添加… | IntervalItem”上下文菜单命令添加子 IModelIntervalItem 节点来定义类别的界限。
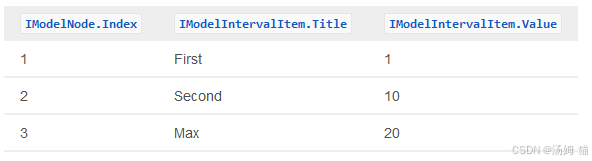
For instance, you can create the First, Second and Max child nodes with the following property values.
例如,你可以使用以下属性值创建“第一”“第二”和“最大”子节点。
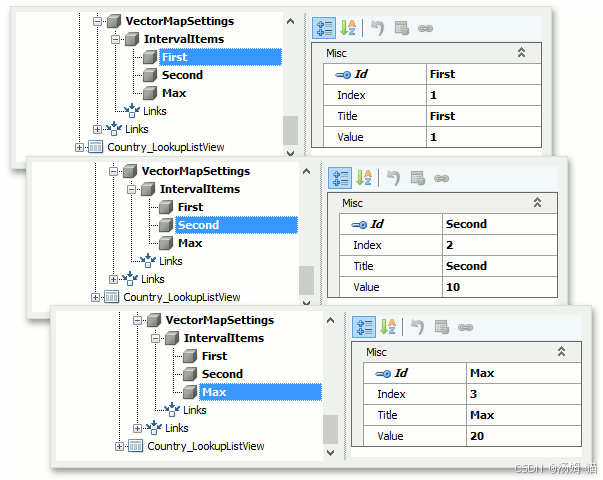
The following image demonstrates these nodes.
以下图片展示了这些节点。
As a result, map areas whose values are in the 1…10 interval will be classified as “First”. Map areas whose values are in the 10…20 interval will be classified as “Second”.
因此,值在1…10区间内的地图区域将被归类为“第一”。值在10…20区间内的地图区域将被归类为“第二”。
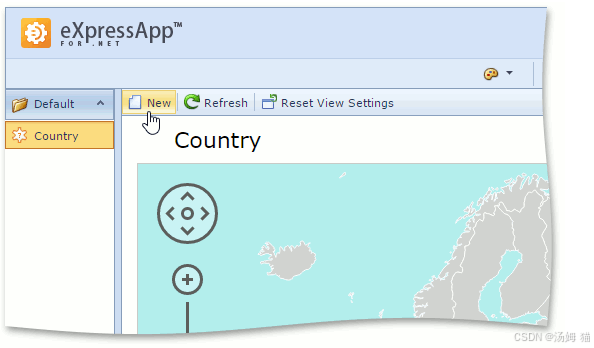
Run the ASP.NET Web Forms application. The Country List View is visualized using the MapViewer control. You can create areas using the New Action.
运行ASP.NET Web Forms应用程序。国家列表视图使用MapViewer控件进行可视化。你可以使用“新建操作”创建区域。
For instance, create the following Countries.
例如,创建以下国家。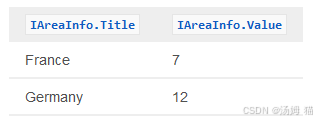
The resulting map is demonstrated below. France and Germany are highlighted with different colors because their associated values are in different intervals. Intervals and their colors are listed in the map legend located in the bottom right corner of the map.
结果地图如下所示。法国和德国用不同颜色突出显示,因为它们相关的值处于不同区间。区间及其颜色列在地图右下角的图例中。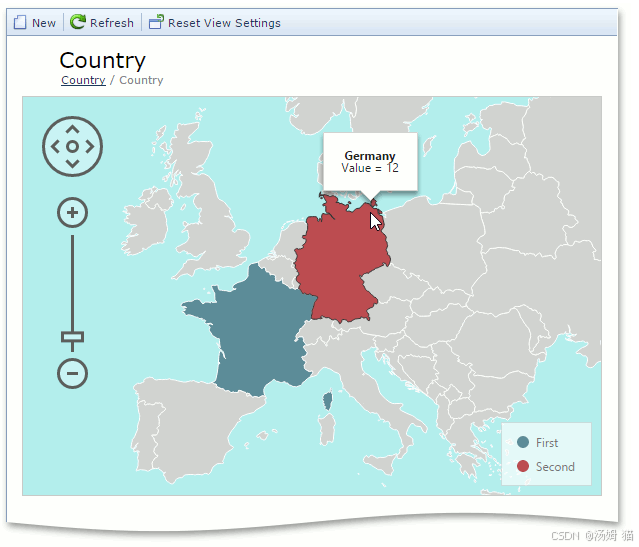
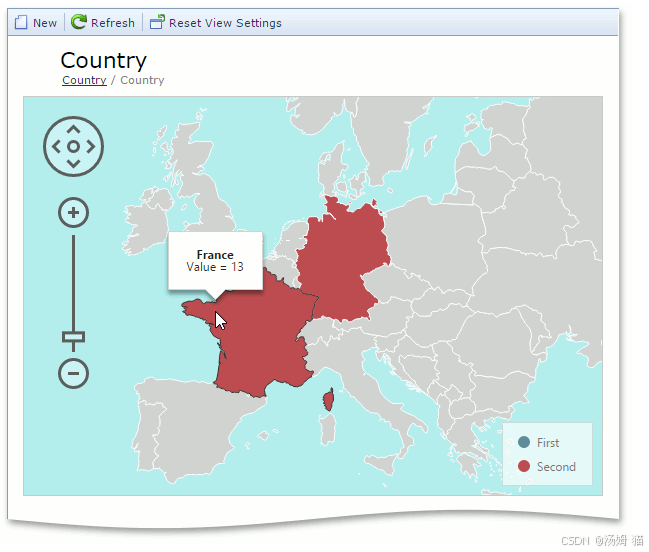
The Detail View is shown when you click a country. For instance, click France and change the Value to 13. As a result, France and Germany will be highlighted with the same color because their associated values are in the same interval.
当你点击一个国家时,会显示详细视图。例如,点击法国并将值更改为13。结果,法国和德国将以相同颜色突出显示,因为它们相关联的值处于相同区间。
Tip
You can change the color palette using the IModelVectorMapSettings.Palette property of the VectorMapSettings node in the Model Editor.
您可以使用模型编辑器中矢量地图设置节点的IModelVectorMapSettings.Palette属性来更改调色板。

有“AI”的1024 = 2048,欢迎大家加入2048 AI社区
更多推荐


 17
17 0
0- 0


 已为社区贡献11条内容

所有评论(0)