Qt图形与图片操作
实现思路二.2D绘图1.画布/画板是所有可用 QPainter 绘制对象的抽象基类。其默认坐标系:原点(0,0)在左上角;X 向右增加;Y 向下增加;单位为像素。已实现 QPaintDevice 绘图功能的子类:QWidget所有 UI 元素的基类,可在窗口/控件上直接绘制。QPixmap针对不同平台做显示优化,常用于屏幕输出。QImage支持直接访问与修改像素数据,常用于离屏绘制或 I/O。QP
文章目录
一.绘制事件
[virtual protected] void paintEvent(QPaintEvent *pe);
当应用程序收到绘制事件的时候,就会调用该函数,例如:窗体开始显示或者窗体发生了改变(大小)等.
俩种方法手动产生绘制事件:
void update(void) -把绘制事件添加到事件队列中void repaint(void) 立即产生绘制事件
实现思路
#ifndef MAINWINDOW_H
#define MAINWINDOW_H

#include <QMainWindow>

QT_BEGIN_NAMESPACE
namespace Ui {
class MainWindow;
}
QT_END_NAMESPACE

class MainWindow : public QMainWindow
{
    Q_OBJECT

public:
    MainWindow(QWidget *parent = nullptr);
    ~MainWindow();

    // 重写父类的 paintEvent 方法
    void paintEvent(QPaintEvent *event);

private:
    Ui::MainWindow *ui;
};

#endif // MAINWINDOW_H
#include "mainwindow.h"
#include "ui_mainwindow.h"
#include <QPainter>

MainWindow::MainWindow(QWidget *parent)
    : QMainWindow(parent)
    , ui(new Ui::MainWindow)
{
    ui->setupUi(this);
}

MainWindow::~MainWindow()
{
    delete ui;
}

void MainWindow::paintEvent(QPaintEvent *event)
{
    QPainter painter(this);
    // 绘制...
}
二.2D绘图
1.画布/画板
QPaintDevice 是所有可用 QPainter 绘制对象的抽象基类。
其默认坐标系:原点(0,0)在左上角;X 向右增加;Y 向下增加;单位为像素。
已实现 QPaintDevice 绘图功能的子类:
-
QWidget
所有 UI 元素的基类,可在窗口/控件上直接绘制。 -
QPixmap
针对不同平台做显示优化,常用于屏幕输出。 -
QImage
支持直接访问与修改像素数据,常用于离屏绘制或 I/O。 -
QPicture
记录并重放任意 QPainter 绘图指令。 -
QGLPixelBuffer
封装 OpenGL pbuffer,通常提供硬件加速绘制,速度快于 QPixmap。 -
QPrinter
用于在打印机上进行绘制。
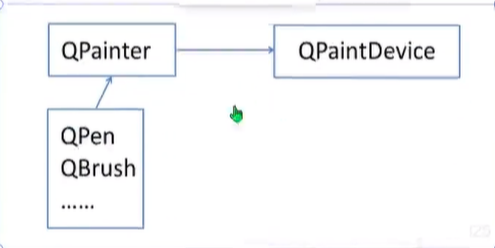
2.画家
QPainter
在小部件及其他绘制设备上执行低级绘制操作。
- 提供高度优化的绘图功能,支持从简单线条到复杂形状、对齐文本、像素图等。
- 默认使用“自然”坐标系,也支持视图与世界坐标变换。
- 可操作任何继承自 QPaintDevice 的对象。
QPainter(QPaintDevice *device)
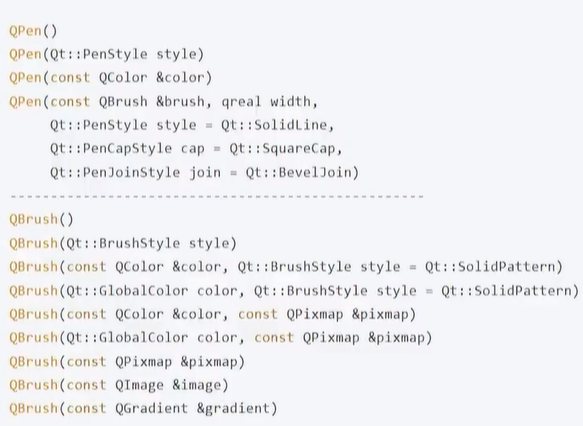
3.画笔和画刷
画笔用来勾勒图形的线条,画刷用来涂颜色
三.图形图像组合
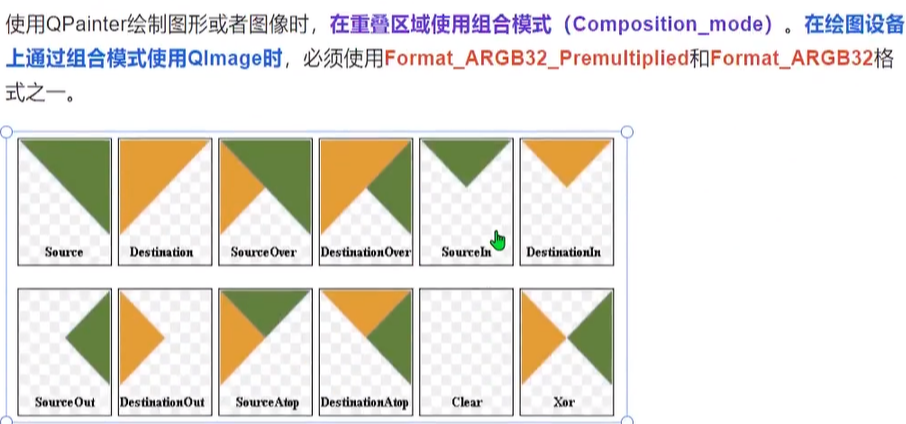
Destination是画板,Source是要在画板上面绘制的图片
// 将输入图像转换为 ARGB32_Premultiplied 格式,并合成圆形遮罩
QImage MainWindow::changeImageToARGB32(const QImage &image)
{
    // 1. 加载作为遮罩用的圆形底图(假设文件已加入资源系统)
    QImage circleImage(":/picture/default.png");

    // 2. 将输入图像缩放到与圆形底图相同尺寸,保持宽高比
    QImage albumImage = image.scaled(circleImage.size(), Qt::KeepAspectRatio);

    // 3. 创建一张同样大小的空图像,像素格式为 ARGB32_Premultiplied
    QImage fixedImage(circleImage.size(), QImage::Format_ARGB32_Premultiplied);

    // 4. 用 fixedImage 作为绘图设备,准备在上面作画
    QPainter painter(&fixedImage);

    // 5. 设置合成模式:直接覆盖目标像素(Source)
    painter.setCompositionMode(QPainter::CompositionMode_Source);

    // 6. 先将整个画布填充为透明,清除原有内容
    painter.fillRect(fixedImage.rect(), Qt::transparent);

    // 7. 切换合成模式:源图像覆盖在目标图像之上(SourceOver)
    painter.setCompositionMode(QPainter::CompositionMode_SourceOver);

   painter.drawImage(fixedImage.rect(),albumImage);
  // 结束绘制并返回处理后的带圆形遮罩的图像
   painter.end();
    return fixedImage;

// 生成圆形图像:将输入图像通过遮罩裁切成圆形
QImage MainWindow::makeCircleImage(const QImage &image)
{
    // 1. 以输入图像作为目标画布
    QImage destImage = image;

    // 2. 加载圆形遮罩图(alpha 通道决定可见区域)
    QImage srcImage(":/picture/default.png");

    // 3. 以 destImage 为绘图设备进行绘制
    QPainter painter(&destImage);

    // 4. 设置合成模式:仅保留 dest 中与 src alpha 相交的部分(DestIn)
    painter.setCompositionMode(QPainter::CompositionMode_DestinationIn);

    // 5. 在 destImage 上绘制遮罩图,实现圆形裁剪效果
    painter.drawImage(destImage.rect(), srcImage);

    // 6. 结束绘制
    painter.end();

    // 7. 返回裁切好的圆形图像
    return destImage;
}
}
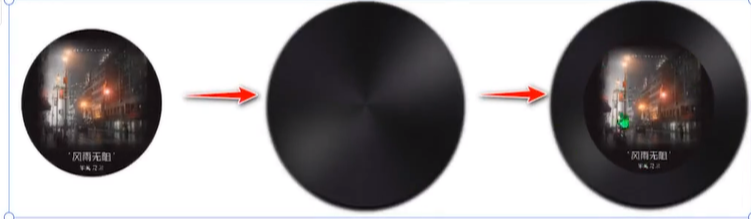
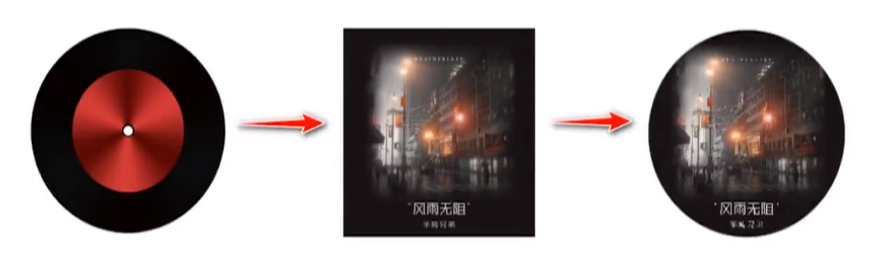
// 生成光盘封面:将圆形专辑图居中绘制到光盘背景上
QImage MainWindow::makeDiskImage(const QString &albumName)
{
    // 1. 先把专辑原图裁成圆形
    QImage albumImage = makeCircleImage(albumName);

    // 2. 加载光盘背景图
    QImage diskImage(":/picture/disk-background.png");

    // 3. 以光盘背景为画布
    QPainter painter(&diskImage);

    // 4. 设置合成模式:源图像覆盖在目标图像之上
    painter.setCompositionMode(QPainter::CompositionMode_SourceOver);

    // 5. 计算光盘背景的中心点
    QPoint centerPoint = diskImage.rect().center();

    // 6. 取得专辑图的大小,并把矩形中心移动到光盘中心
    QRect rect = albumImage.rect();
    rect.moveCenter(centerPoint);

    // 7. 在计算好的矩形区域内绘制圆形专辑图
    painter.drawImage(rect, albumImage);

    // 8. 结束绘制
    painter.end();

    // 9. 返回合成后的光盘封面
    return diskImage;
}
四.Graphics View框架
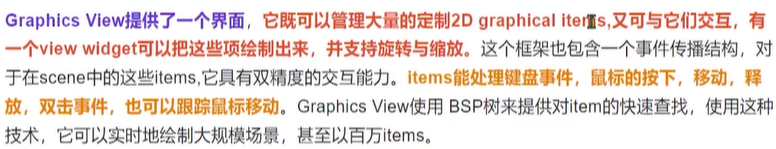
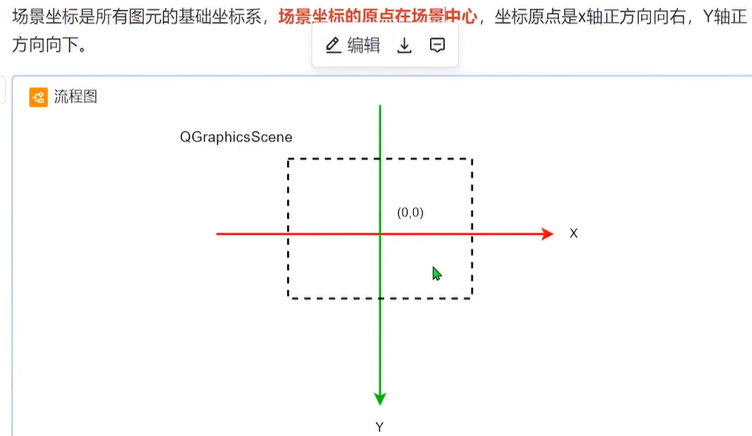
1.场景类QGraphicsScene
用于放置图元的容器,本身不可见,必须通过与之相连的视图类来显示及与外界进行相互操作
// 向场景中添加一个图元
void addItem(QGraphicsItem *item);

// 用 QRectF 设置场景矩形
void setSceneRect(const QRectF &rect);

// 用坐标和宽高设置场景矩形
void setSceneRect(qreal x, qreal y, qreal w, qreal h);
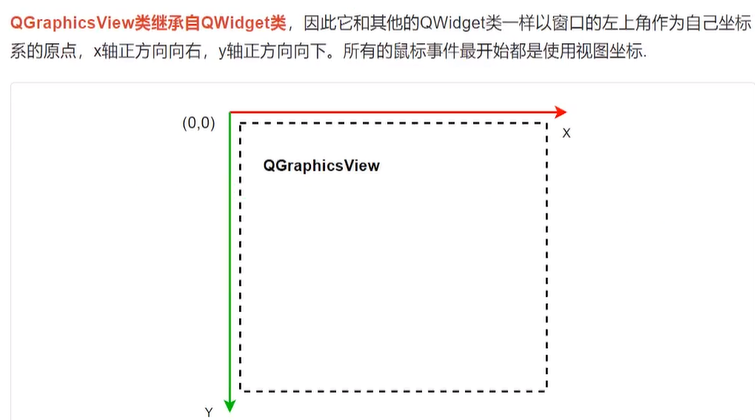
2.视图类:QGraphicsView类

void setScene(QGrapicsScene *scene)
3.图元类:
它是场景中各个图元的基类,在它的基础上可以继承出各种图元类。Qt 已经预置的有直线(QGraphicsLineItem),椭圆(QGraphicsEllipseItem),文本图元(QGraphicsTextItem),矩形(QGraphicsRectItem)等。但是很多时候我们还是在 QGraphicsItem 类的继承上实现自定义的图元类。
主要功能如下:
- 处理鼠标按下、移动、释放、双击、悬停、滚轮和右键菜单事件
- 处理键盘输入事件
- 处理拖放事件
- 碰撞检测
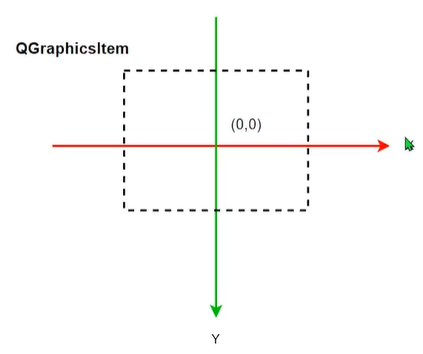
图元使用自己的本地坐标,这个坐标系通常以图元为原点,这也是所有变换的原点。图元坐标方向是 x 轴正方向向右,y 轴正方向向下。
// 设置图元在场景中的位置,这里的 x 和 y 是场景中的坐标
void QGraphicsItem::setPos(qreal x, qreal y);

QGraphicsScene* QGraphicsItem::scene();

void QGraphicsItem::setFlags(QGraphicsItem::GraphicsItemFlags flags);
QGraphicsScene *scene = new QGraphicsScene(this);
int width = ui->graphicsView->width();
int height = ui->graphicsView->height();
QRect sceneRect(-width/2,-height/2,width,height);
scene->setSceneRect(sceneRect);

ui->graphicsView->setScene(scene);

QGraphicsEllipseItem *item = new QGraohicsEllipseItem;
QPen pen = item->pen();
pen.setWidth(5);
pen.setColor(Qt::red);
item->setPen(pen);
item->setRect(QRect(-100,-50,200,100));
item->setFlags(QGraphicsItem::ItemIsMovable);//可移动
scene->addItem(item);
item->setPos(0,0);
4.自定义图元类
(1)继承QGraphicsItem类
class MusicItem : public QGraphicsItem
{
public:
    explicit MusicItem(const QString &filename, QObject *parent = nullptr);
    void updateImage(const QImage &image);

    // 绘制图元的函数
    virtual void paint(
        QPainter *painter,
        const QStyleOptionGraphicsItem *option,
        QWidget *widget = Q_NULLPTR
    );

    // 返回图元自己坐标系中,图元所在的矩形
    QRectF boundingRect() const;

    int width();
    int height();

signals:

private:
    QImage image;
};
(2)实现俩个纯虚函数
// 构造函数:传入图片文件名和可选父对象
MusicItem::MusicItem(const QString &filename, QObject *parent)
    : QObject(parent)          // 初始化 QObject 部分
{
    image.load(filename);      // 从文件加载图片到成员变量 image
}

// 更新当前图元显示的图片,并触发重绘
void MusicItem::updateImage(const QImage &image)
{
    this->image = image;                    // 替换内部图片数据
    this->update(boundingRect());           // 请求重绘整个图元区域
}

// 重写的 paint 函数:负责把图片绘制到场景中
void MusicItem::paint(QPainter *painter,
                      const QStyleOptionGraphicsItem *option,
                      QWidget *widget)
{
    Q_UNUSED(option);                       // 显式标记未使用的参数
    Q_UNUSED(widget);

    painter->setRenderHint(QPainter::SmoothPixmapTransform); // 启用平滑缩放
    painter->drawImage(boundingRect(), image);               // 在图元矩形内绘制图片
    return;
}
```cpp
// 返回图元在其本地坐标系中的边界矩形(以图元中心为原点)
QRectF MusicItem::boundingRect() const
{
    int width  = image.width();   // 获取图片宽度
    int height = image.height();  // 获取图片高度
    // 以图片中心为原点,左上角位于 (-width/2, -height/2)
    return QRectF(-width / 2, -height / 2, width, height);
}

// 返回图片的宽度
int MusicItem::width()
{
    return image.width();
}

// 返回图片的高度
int MusicItem::height()
{
    return image.height();
}
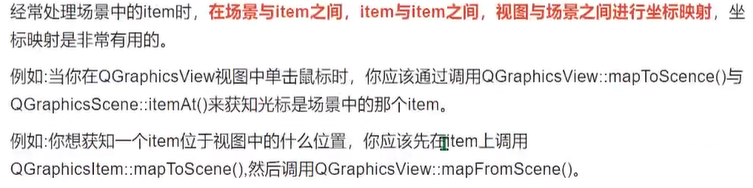
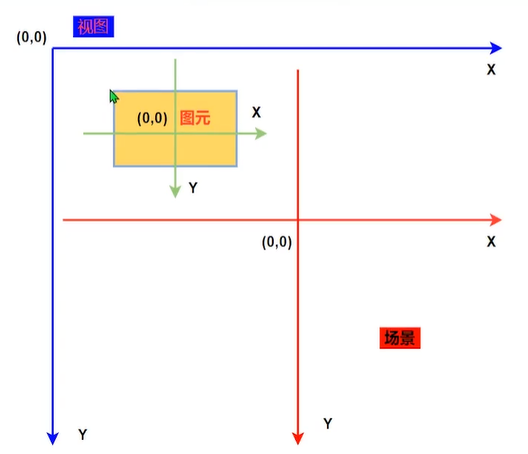
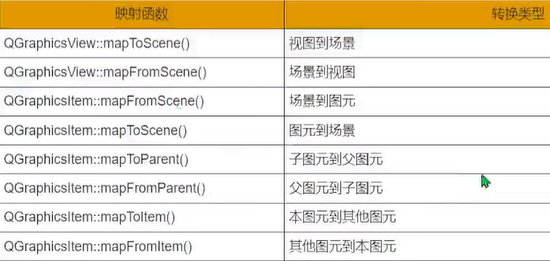
5.坐标映射
五.属性动画
1.Q_PROPERTY () 用来在一个类中声明一个属性 property
#include <QPropertyAnimation>

class MusicItem:public QObject,public QGraphicsItem
{
    Q_OBJECT
    Q_PROPERTY(qreal angle READ rotation WRITE setRotation)

private:
    QPropertyAnimation *animation;
};
2.创建一个属性动画对象
animation = new QPropertyAnimation(this,"angle");
3.设置属性动画参数
animation->setDuration(msecs);    // 设置动画时间周期
animation->setStartValue(startAngle);    // 设置动画开始值
animation->setEndValue(endAngle);    // 设置动画结束值
animation->setLoopCount(loopCount);    // 设置动画重复的次数
4.开始/暂停/停止属性动画
animation->start();    // 启动动画
animation->pause();    // 暂停动画
animation->stop();    // 停止动画
六.QCustomPlot绘图
QCustomPlot is a Qt C++ widget for plotting and data visualization. It has no further dependencies and is well documented. This plotting library focuses on making good looking, publication quality 2D plots, graphs and charts, as well as offering high performance for realtime visualization applications.
QCustomPlot 是一个用于绘图和数据可视化的 QtC++ 小部件。它没有进一步的依赖项,并且有很好
的文档记录。这个绘图库专注于制作好看的、发布质量的 2D 绘图、图形和图表,以及为实时可视化
应用程序提供高性能。
QCustomPlot 官网链接: https://www.qcustomplot.com/index.php/introduction下载链接: https://www.qcustomplot.com/index.php/download
几个重要类:
QCustomPlot图表类:用于图表的显示和交互QCPLayer图层:管理图层元素 (QCPLayerable),所有可显示的对象都是继承自图层元素QCPAbstractPlottable绘图元素:包含折线图 (QCPGraph)、曲线圈 (QCPCurve)、柱状图 (QCPBars)、QCPStatiBox (盒子图)、QCPColorMap (色谱图)、QCPFinancial (金融图)QCPAxisRect坐标轴矩形:一个坐标轴矩形默认包含上下左右四个坐标轴,但是可以添加多个坐标轴
1.QCustomPlot类
QCustomPlot类管理着所有的图层,它默认自带了六个图层,分别是:
- 背景层(background),用来绘制背景图
- 网格层(grid),用来绘制网格线,每一个坐标轴对应一个网格对象
- 绘图层(main),用来绘制图表
- 坐标轴层(axis),用来绘制坐标轴
- 图例层(legend),用来绘制图例
- overlay层,用来绘制最上层的东西,鼠标选择矩形框在此层绘制依据层的顺序的不同,绘制的顺序也不同,越在底下的层越早绘制,当前层默认为绘图层main,而我们的绘图区域则在QCPAxisRect中,QCustomPlot类默认包含一个QCPAxisRect,我们可以在下图中可以看到一个QCPAxisRect一般来说会有
上轴Axis2、下轴XAxis、左轴YAxis和右轴YAxis2四个轴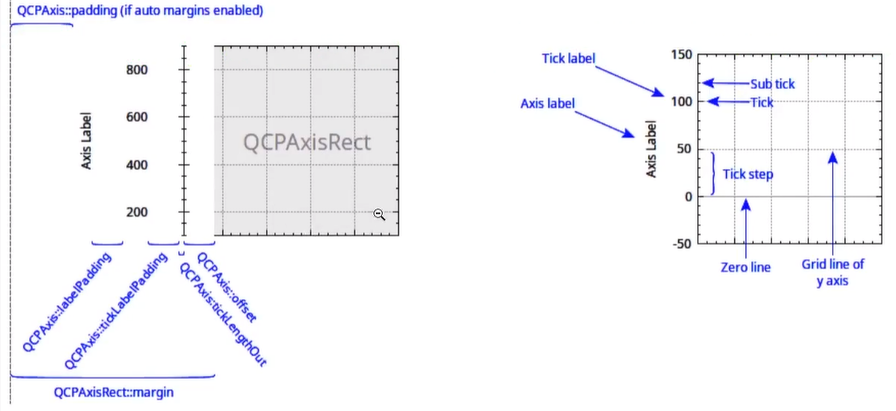
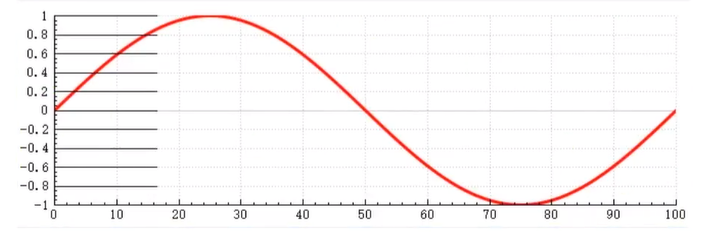
2.绘制静态曲线
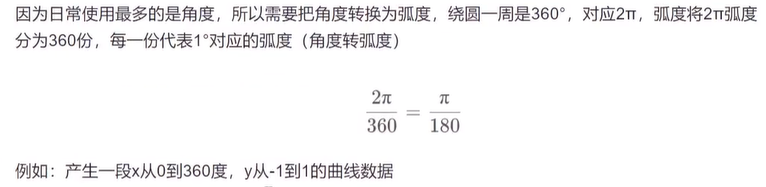
//x - 这是浮点值,表示以弧度表示的角度。
double sin(double x)
// 定义两个包含101个double类型元素的QVector容器x和y
QVector<double> x(101), y(101);
// 循环101次(i从0到100)
for (int i=0; i <= 100; i ++)
{
    // 将i的值赋给x的第i个元素
    x[i] = i;
    // 将i转换为double类型后除以100再乘以360,得到角度值,存储在degree变量中
    double degree = (double)i / 100 * 360;
    // 将degree角度值转换为弧度值,然后计算其正弦值,存储在y的第i个元素中
    y[i] = qSin(qDegreesToRadians(degree));
}
MainWindow::MainWindow(QWidget *parent)
    : QMainWindow(parent)
    , ui(new Ui::MainWindow)
{
    // 调用UI的设置函数,初始化界面
    ui->setupUi(this);

    // 允许用户通过鼠标拖曳来改变customPlot的范围
    ui->customPlot->setInteraction(QCP::iRangeDrag,true);

    // 再次调用UI的设置函数,可能是重复代码或者有其他初始化操作
    ui->setupUi(this);
    // 允许用户通过鼠标拖曳来改变customPlot的范围
    ui->customPlot->setInteraction(QCP::iRangeDrag,true);
    // 允许用户通过鼠标缩放来改变customPlot的范围
    ui->customPlot->setInteraction(QCP::iRangeZoom,true);
    // 设置y轴的刻度长度为100
    ui->customPlot->yAxis->setTickLength(100);
    // 设置y轴的刻度数量为10
    ui->customPlot->yAxis->ticker()->setTickCount(10);
    // 设置y轴的范围为-1到1
    ui->customPlot->yAxis->setRange(-1,1);
    // 设置x轴的范围为0到100
    ui->customPlot->xAxis->setRange(0,100);
    // 设置x轴的刻度数量为10
    ui->customPlot->xAxis->ticker()->setTickCount(10);

    // 定义两个包含101个double类型元素的QVector容器x和y
    QVector<double> x(101), y(101);
    // 循环101次(i从0到100)
    for (int i=0; i <= 100; i ++)
    {
        // 将i的值赋给x的第i个元素
        x[i] = i;
        // 将i转换为double类型后除以100再乘以360,得到角度值,存储在degree变量中
        double degree = (double)i / 100 * 360;
        // 将degree角度值转换为弧度值,然后计算其正弦值,存储在y的第i个元素中
        y[i] = qSin(qDegreesToRadians(degree));
    }

    // 在customPlot中添加一个新的图形对象
    QCPGraph *graph = ui->customPlot->addGraph();
    // 获取图形对象的画笔
    QPen pen = graph->pen();
    graph->setData(x,y);    // 将数据x和y设置到图形对象graph中
    ui->customPlot->replot();    // 重新绘制customPlot,使新设置的数据显示出来
3.绘制动态曲线
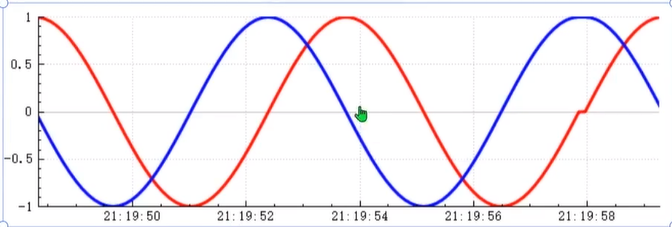
MainWindow::MainWindow(QWidget *parent)
    : QMainWindow(parent)
    , ui(new Ui::MainWindow)
{
    // 调用UI的设置函数,初始化界面
    ui->setupUi(this);

    // 允许用户通过鼠标拖曳来改变customPlot的x轴范围
    ui->customPlot->setInteraction(QCP::iRangeDrag,true);
    // 允许用户通过鼠标缩放来改变customPlot的x轴范围
    ui->customPlot->setInteraction(QCP::iRangeZoom,true);

    // 设置x轴为时间坐标轴
    // 创建一个QSharedPointer指向QCPAxisTickerTime对象,用于处理时间刻度
    QSharedPointer<QCPAxisTickerTime> timeTicker(new QCPAxisTickerTime);
    // 设置时间显示格式为"时:分:秒"
    timeTicker->setTimeFormat("%h:%m:%s");
    // 将自定义的时间刻度器应用到customPlot的x轴
    ui->customPlot->xAxis->setTicker(timeTicker);

    // 获取提前10秒的数据,100毫秒刷新一次
    // 获取当前时间距离当天开始的毫秒数
    qint64 now = QTime::currentTime().msecsSinceStartOfDay();
    // 计算10秒前的时间(10秒 = 10 * 1000毫秒)
    now = now - 10 * 1000;
    // 输出10秒前的时间字符串(调试用)
    qDebug() << QTime::fromMSecsSinceStartOfDay(now).toString();

    // 生成示例数据,模拟10秒内每100毫秒一个数据点
    for(int i = 0;i <= 100;i ++){
        // 将时间转换为秒,并添加到m_key容器中(假设m_key是存储x轴时间数据的容器)
        m_key.append((now + i * 100)/1000.0);

        // 生成角度值(0到720度,每步增加3.6度)
        double degrees = (double)i / 50 * 360;
        // 计算正弦值,并添加到m_data1容器中(假设m_data1是存储第一条曲线数据的容器)
        m_data1.append(qSin(qDegreesToRadians(degrees)));
        // 计算余弦值,并添加到m_data2容器中(假设m_data2是存储第二条曲线数据的容器)
        m_data2.append(qCos(qDegreesToRadians(degrees)));
    }
  // 设置x轴范围为m_key的第一个元素到最后一个元素(时间范围)
ui->customPlot->xAxis->setRange(m_key.front(),m_key.last());
// 设置y轴范围为-1到1
ui->customPlot->yAxis->setRange(-1,1);
// 在customPlot中添加第一条曲线
QCPGraph *graph1 = ui->customPlot->addGraph();
// 在customPlot中添加第二条曲线
QCPGraph *graph2 = ui->customPlot->addGraph();
// 将m_key和m_data1的数据设置到第一条曲线
graph1->setData(m_key,m_data1);
// 将m_key和m_data2的数据设置到第二条曲线
graph2->setData(m_key,m_data2);

// 设置第一条曲线的画笔样式
// 获取第一条曲线的画笔
QPen pen1 = graph1->pen();
// 设置画笔宽度为3
pen1.setWidth(3);
// 设置画笔颜色为红色
pen1.setColor(Qt::red);
// 将新的画笔应用到第一条曲线
graph1->setPen(pen1);

// 设置第二条曲线的画笔样式
// 获取第二条曲线的画笔
QPen pen2 = graph2->pen();
// 设置画笔宽度为3
pen2.setWidth(3);
// 设置画笔颜色为蓝色
pen2.setColor(Qt::blue);
// 将新的画笔应用到第二条曲线
graph2->setPen(pen2);

// 重新绘制customPlot,使新设置的曲线显示出来
ui->customPlot->replot();

// 创建一个定时器,用于定时更新图表
// 创建一个定时器对象,父对象为当前MainWindow
QTimer *timer = new QTimer(this);
// 连接定时器的timeout信号到MainWindow的updatePlot槽函数
connect(timer,&QTimer::timeout,this,&MainWindow::updatePlot);
// 启动定时器,每隔100毫秒触发一次timeout信号
timer->start(100);
void MainWindow::updatePlot()
{
    // 用于计数,控制角度生成的周期
    static quint32 count = 0;
    // 获取当前时间距离当天开始的毫秒数
    qint64 now = QTime::currentTime().msecsSinceStartOfDay();
    // 移除m_key的第一个元素(最旧的时间点)
    m_key.removeFirst();
    // 添加当前时间点(转换为秒)到m_key的末尾
    m_key.append(now/1000.0);

    // 生成新的角度值(0到720度循环)
    double degrees = (double)count / 50 * 360;

    // 更新第一条曲线的数据
    // 移除m_data1的第一个元素(最旧的数据点)
    m_data1.removeFirst();
    // 添加新的正弦值到m_data1的末尾
    m_data1.append(qSin(qDegreesToRadians(degrees)));

    // 更新第二条曲线的数据
    // 移除m_data2的第一个元素(最旧的数据点)
    m_data2.removeFirst();
    // 添加新的余弦值到m_data2的末尾
    m_data2.append(qCos(qDegreesToRadians(degrees)));

    // 更新图表上的曲线数据
    // 获取第一条曲线对象
    QCPGraph *graph1 = ui->customPlot->graph(0);
    // 获取第二条曲线对象
    QCPGraph *graph2 = ui->customPlot->graph(1);
    // 将新的m_key和m_data1数据设置到第一条曲线
    graph1->setData(m_key,m_data1);
    // 将新的m_key和m_data2数据设置到第二条曲线
    graph2->setData(m_key,m_data2);

    // 重新设置x轴范围为最新的时间范围
    ui->customPlot->xAxis->setRange(m_key.front(),m_key.last());
    // 重新绘制customPlot,使更新后的数据显示出来
    ui->customPlot->replot();

    // 计数加1,并通过取模运算保持在0到100之间
    count = (count + 1) % 101;
}

有“AI”的1024 = 2048,欢迎大家加入2048 AI社区
更多推荐

 31
31 0
0- 0


 已为社区贡献1条内容

所有评论(0)