Python: scipy+matplotlib 绘制beta分布图
·
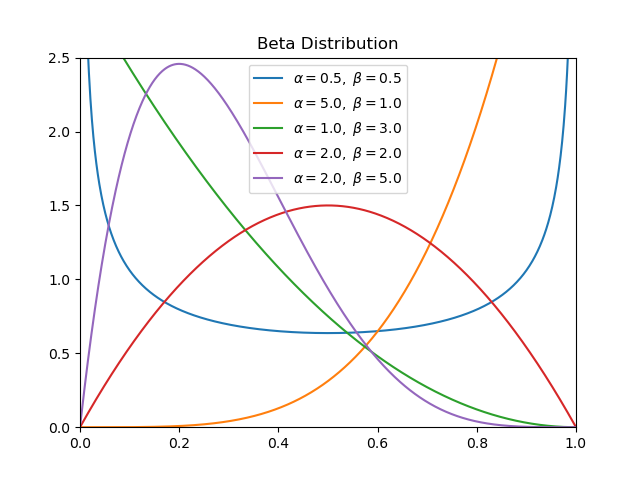
抄自 [link] ,但是自认为代码比他清晰
import numpy as np
from scipy.stats import beta
import matplotlib.pyplot as plt

ab_pairs = [(0.5, 0.5), (5, 1), (1, 3), (2, 2), (2, 5)]

x = np.linspace(0, 1, 1002)[1:-1]

for a, b in ab_pairs:
    print(a, b)
    dist = beta(a, b)
    y = dist.pdf(x)
    plt.plot(x, y, label=r'$\alpha=%.1f,\ \beta=%.1f$' % (a, b))

# 设置标题
plt.title(u'Beta Distribution')
# 设置 x,y 轴取值范围
plt.xlim(0, 1)
plt.ylim(0, 2.5)
plt.legend()
plt.savefig("./beta.svg", format="svg")

有“AI”的1024 = 2048,欢迎大家加入2048 AI社区
更多推荐



 8
8 0
0- 0


 已为社区贡献2条内容

所有评论(0)