提取和显示图像中的网格线和交叉点
代码使用了一些图像处理函数来提取和显示图像中的网格线和交叉点。
以下代码是Halcon一个图像处理的脚本,使用了一些图像处理函数来提取和显示图像中的网格线和交叉点。
dev_update_off ()
*
- step: acquire image
read_image (Image, ‘keypad’)
get_image_pointer1 (Image, Pointer, Type, Width, Height)
dev_close_window ()
dev_open_window (0, 0, Width, Height, ‘white’, WindowHandle)
set_display_font (WindowHandle, 16, ‘mono’, ‘true’, ‘false’)
dev_display (Image)
*
- step: initialize visualization
dev_set_colored (3)
dev_set_draw (‘fill’)
*
- step:extract the region of the grid
mean_image (Image, ImageMean, 7, 7)
dyn_threshold (Image, ImageMean, RegionDynThresh, 4, ‘dark’)
connection (RegionDynThresh, ConnectedRegions)
select_shape (ConnectedRegions, SelectedRegions, [‘max_diameter’,‘contlength’], ‘and’, [200,800], [99999,99999])
closing_circle (SelectedRegions, RegionClosing, 1.5)
dev_display (Image)
dev_display (RegionClosing)
disp_continue_message (WindowHandle, ‘black’, ‘true’)
stop ()
*
- step:extract the contours of the grid
skeleton (RegionClosing, Skeleton)
gen_contours_skeleton_xld (Skeleton, ContoursSkeleton, 1, ‘filter’)
segment_contours_xld (ContoursSkeleton, ContoursSplitSkeleton, ‘lines’, 5, 2, 1)
select_contours_xld (ContoursSplitSkeleton, SelectedContours, ‘contour_length’, 30, 1000, -0.5, 0.5)
union_collinear_contours_xld (SelectedContours, UnionCollinearContours, 100, 10, 20, rad(10), ‘attr_keep’)
dev_display (Image)
dev_display (UnionCollinearContours)
disp_continue_message (WindowHandle, ‘black’, ‘true’)
stop ()
*
- step:fit lines to the contours
count_obj (UnionCollinearContours, NumberContours)
gen_empty_obj (LinesHorizontal)
gen_empty_obj (LinesVertical)
for i := 1 to NumberContours by 1
select_obj (UnionCollinearContours, ObjectSelected, i)
fit_line_contour_xld (ObjectSelected, ‘tukey’, -1, 0, 5, 2, RowBegin, ColBegin, RowEnd, ColEnd, Nr, Nc, Dist)
gen_contour_polygon_xld (Contour, [RowBegin,RowEnd], [ColBegin,ColEnd])
Phi := atan2(-Nr,Nc)
if (abs(Phi) < rad(5))
concat_obj (LinesVertical, Contour, LinesVertical)
endif
if (rad(85) < abs(Phi) and abs(Phi) < rad(95))
concat_obj (LinesHorizontal, Contour, LinesHorizontal)
endif
endfor
dev_display (Image)
dev_set_color (‘red’)
dev_display (LinesVertical)
dev_set_color (‘yellow’)
dev_display (LinesHorizontal)
disp_continue_message (WindowHandle, ‘black’, ‘true’)
stop ()
*
- step:extract junction points of the grid
RowJunction := []
ColJunction := []
RowRealJunction := []
ColRealJunction := []
count_obj (LinesHorizontal, NumberLH)
count_obj (LinesVertical, NumberLV)
for i := 1 to NumberLH by 1
select_obj (LinesHorizontal, HorizontalLine, i)
get_contour_xld (HorizontalLine, RowHorizontal, ColHorizontal)
for j := 1 to NumberLV by 1
select_obj (LinesVertical, VerticalLine, j)
get_contour_xld (VerticalLine, RowVertical, ColVertical)
intersection_lines (RowHorizontal[0], ColHorizontal[0], RowHorizontal[1], ColHorizontal[1], RowVertical[0], ColVertical[0], RowVertical[1], ColVertical[1], Row, Column, IsOverlapping)
distance_ps (Row, Column, RowHorizontal[0], ColHorizontal[0], RowHorizontal[1], ColHorizontal[1], DistanceH, DistanceHMax)
distance_ps (Row, Column, RowVertical[0], ColVertical[0], RowVertical[1], ColVertical[1], DistanceV, DistanceVMax)
RowJunction := [RowJunction,Row]
ColJunction := [ColJunction,Column]
if ((DistanceH <= 30) and (DistanceV <= 30))
RowRealJunction := [RowRealJunction,Row]
ColRealJunction := [ColRealJunction,Column]
endif
endfor
endfor
dev_set_color (‘white’)
gen_cross_contour_xld (Cross, RowJunction, ColJunction, 12, 0.785398)
dev_display (Cross)
disp_continue_message (WindowHandle, ‘black’, ‘true’)
stop ()
dev_display (Image)
dev_set_color (‘gray’)
dev_display (LinesHorizontal)
dev_display (LinesVertical)
dev_set_color (‘white’)
gen_cross_contour_xld (Cross, RowRealJunction, ColRealJunction, 12, 0.785398)
dev_display (Cross)
disp_continue_message (WindowHandle, ‘black’, ‘true’)
stop ()
*
- or via region processing, starting with the
- skeleton obtained above
set_display_font (WindowHandle, 14, ‘mono’, ‘true’, ‘false’)
dev_display (Image)
junctions_skeleton (Skeleton, EndPoints, JuncPoints)
get_region_points (JuncPoints, RowJunctionRegionProcessing, ColumnJunctionRegionProcessing)
gen_cross_contour_xld (CrossCenter, RowJunctionRegionProcessing, ColumnJunctionRegionProcessing, 12, 0.785398)
dev_set_color (‘gray’)
dev_display (Skeleton)
dev_set_color (‘white’)
dev_display (CrossCenter)
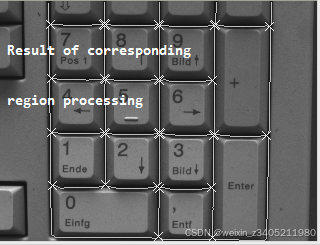
disp_message (WindowHandle, ‘Result of corresponding’, ‘window’, 40, 10, ‘white’, ‘false’)
disp_message (WindowHandle, ‘region processing’, ‘window’, 90, 10, ‘white’, ‘false’)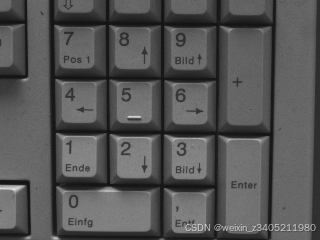
以下是程序运行结果
下面是对这段代码的简要解释:
图像获取:首先,脚本读取一个名为 ‘keypad’ 的图像,并获取其指针和尺寸信息。
窗口操作:然后,关闭当前窗口并打开一个新的窗口来显示图像。
字体设置:设置显示字体的样式和大小。
图像显示:将原始图像显示在新窗口中。
初始化可视化:设置绘图颜色和填充样式。
提取网格区域:
使用 mean_image 函数计算图像的均值。
使用 dyn_threshold 函数根据均值图像进行动态阈值处理。
使用 connection 函数连接相邻的像素点。
使用 select_shape 函数选择特定形状的区域。
使用 closing_circle 函数进行闭运算,以提取网格区域。
提取网格轮廓:
使用 skeleton 函数提取骨架线。
使用 gen_contours_skeleton_xld 函数生成轮廓。
使用 segment_contours_xld 函数分割轮廓。
使用 select_contours_xld 函数选择特定长度的轮廓。
使用 union_collinear_contours_xld 函数合并共线的轮廓。
拟合线到轮廓:
计算水平和垂直轮廓的数量。
对每个轮廓使用 fit_line_contour_xld 函数拟合直线。
根据拟合的直线角度,将它们分类为水平线或垂直线。
提取网格交叉点:
遍历所有水平和垂直线,找到它们的交点。
使用 intersection_lines 函数计算交点。
使用 distance_ps 函数计算交点到线段端点的距离。
根据距离条件筛选出真实的交叉点。
显示结果:
使用 dev_display 函数显示网格线、交叉点和真实交叉点。
区域处理方法:
使用 junctions_skeleton 函数从骨架中提取端点和交叉点。
使用 get_region_points 函数获取交叉点的坐标。
显示骨架和处理后的交叉点。
最终显示:
显示最终的图像,包括网格线、交叉点和处理结果。
请注意,这段代码是伪代码或脚本的一部分,并不是可以直接执行的程序代码。它需要在支持相应图像处理函数的环境中运行,例如使用 HALCON 软件或其他图像处理库。

有“AI”的1024 = 2048,欢迎大家加入2048 AI社区
更多推荐

 28
28 0
0- 0


 已为社区贡献2条内容

所有评论(0)