【微信小程序】wx-charts 图表插件
wx-charts微信小程序主流的图表工具基于 Canvas,体积小wx-charts插件无法在组件内使用。
·
wx-charts
微信小程序主流的图表工具
基于 Canvas,体积小
注意:wx-charts 插件无法在组件内使用。
支持图表类型
- 饼图 pie
- 圆环图 ring
- 线图 line
- 柱状图 column
- 区域图 area
- 雷达图 radar
如何使用
- 直接拷贝编译好的文件 dist/wxcharts-min.js 到项目中(js下载地址)
import wxCharts from '../../utils/wxcharts-min.js'
- wxml 中定义
<canvas canvas-id="pieCanvas" disable-scroll="true" class="pieCanvas" style="width:300px; height:300px;"></canvas>
canvas-id 与 new wxCharts({canvasId: ‘’}) 中的 canvasId 值一致。
Demo
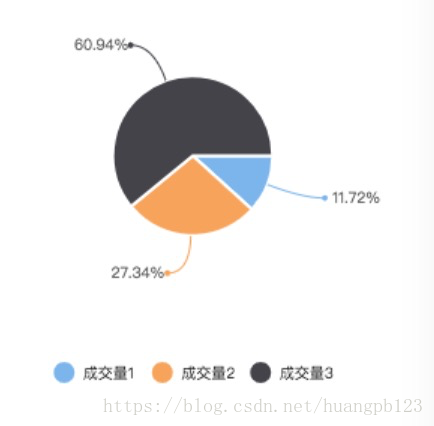
- 饼图 pie
let chart = new wxCharts({
    animation: true,
    canvasId: 'pieCanvas',
    type: 'pie',
    series: [{
        name: '成交量1',
        data: 15,
    }, {
        name: '成交量2',
        data: 35,
    }, {
        name: '成交量3',
        data: 78,
    }],
    width: 300,
    height: 300,
})
2. 圆环图 ring
  let chart = new wxCharts({
      animation: true,
      canvasId: 'ringCanvas',
      type: 'ring',
      extra: {
        ringWidth: 25,
        pie: {
          offsetAngle: -45
        }
      },
      title: {
        name: '70%',
        color: '#7cb5ec',
        fontSize: 25
      },
      subtitle: {
        name: '收益率',
        color: '#666666',
        fontSize: 15
      },
      series: [{
        name: '成交量1',
        data: 15,
        stroke: false
      }, {
        name: '成交量2',
        data: 35,
        stroke: false
      }, {
        name: '成交量3',
        data: 78,
        stroke: false
      }, {
        name: '成交量4',
        data: 63,
        stroke: false
      }],
      disablePieStroke: true,
      width: 300,
      height: 300,
      dataLabel: false,
      legend: false,
      padding: 0
    })

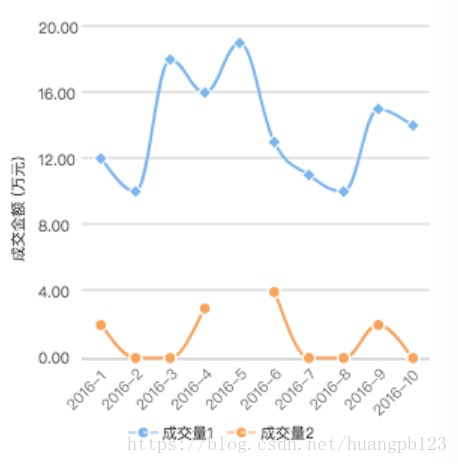
- 线图 line
 let chart = new wxCharts({
      canvasId: 'lineCanvas',
      type: 'line',
      categories: ['2016-1', '2016-2', '2016-3', '2016-4', '2016-5', '2016-6', '2016-7', '2016-8', '2016-9', '2016-10'],
      animation: true,
      series: [{
        name: '成交量1',
        data: [12,10,18,16,19,13,11,10,15,14],
        format: function (val, name) {
          return val.toFixed(2) + '万';
        }
      }, {
        name: '成交量2',
        data: [2, 0, 0, 3, null, 4, 0, 0, 2, 0],
        format: function (val, name) {
          return val.toFixed(2) + '万';
        }
      }],
      xAxis: {
        disableGrid: true
      },
      yAxis: {
        title: '成交金额 (万元)',
        format: function (val) {
          return val.toFixed(2);
        },
        min: 0
      },
      width: 300,
      height: 300,
      dataLabel: false,
      dataPointShape: true,
      extra: {
        lineStyle: 'curve'
      }
    })
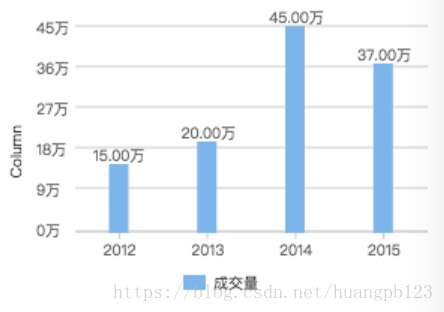
- 柱状图 column
let chart = new wxCharts({
      canvasId: 'columnCanvas',
      type: 'column',
      animation: true,
      categories: ['2012', '2013', '2014', '2015'],
      series: [{
        name: '成交量',
        data: [15, 20, 45, 37],
        format: function (val, name) {
          return val.toFixed(2) + '万';
        }
      }],
      yAxis: {
        format: function (val) {
          return val + '万';
        },
        title: 'Column',
        min: 0
      },
      xAxis: {
        disableGrid: false,
        type: 'calibration'
      },
      extra: {
        column: {
          width: 15
        }
      },
      width: 300,
      height: 200,
    });
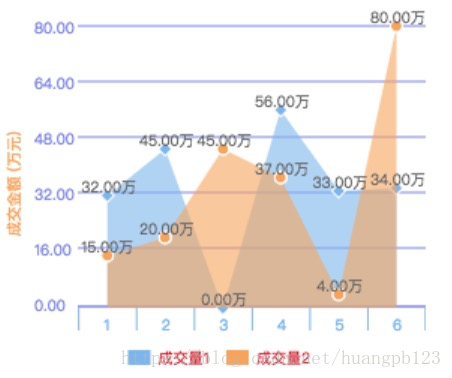
- 区域图 area
let chart = new wxCharts({
      canvasId: 'areaCanvas',
      type: 'area',
      categories: ['1', '2', '3', '4', '5', '6'],
      animation: true,
      series: [{
        name: '成交量1',
        data: [32, 45, 0, 56, 33, 34],
        format: function (val) {
          return val.toFixed(2) + '万';
        }
      }, {
        name: '成交量2',
        data: [15, 20, 45, 37, 4, 80],
        format: function (val) {
          return val.toFixed(2) + '万';
        },
      }],
      yAxis: {
        title: '成交金额 (万元)',
        format: function (val) {
          return val.toFixed(2);
        },
        min: 0,
        fontColor: '#8085e9',
        gridColor: '#8085e9',
        titleFontColor: '#f7a35c'
      },
      xAxis: {
        fontColor: '#7cb5ec',
        gridColor: '#7cb5ec'
      },
      extra: {
        legendTextColor: '#cb2431'
      },
      width: 300,
      height: 250
    });
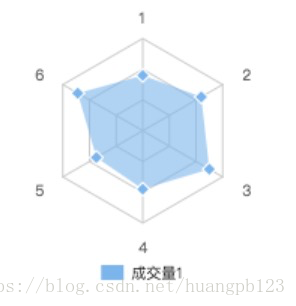
- 雷达图 radar
    let chart = new wxCharts({
      canvasId: 'radarCanvas',
      type: 'radar',
      categories: ['1', '2', '3', '4', '5', '6'],
      series: [{
        name: '成交量1',
        data: [90, 110, 125, 95, 87, 122]
      }],
      width: 300,
      height: 200,
      extra: {
        radar: {
          max: 150
        }
      }
    });
参数说明
| 参数 | 类型 | 说明 |
|---|---|---|
| opts | Object | |
| opts.canvasId | String Required | 对应wxml中的canvasId |
| opts.type | String Required | 图表类型,可选值为:pie、line、column、area、 |
| opts.width | Number Required | canvas宽度,单位px |
| opts.height | Number Required | canvas高度,单位px |
| opts.legend | Boolean | 是否显示图表下方各类别的标识,默认true |
| opts.background | String | canvas背景颜色 ,默认#fff |
| opts.animation | Boolean | 是否动画展示,默认true |
| opts.enableScroll | Boolean | 是否开启图表可拖拽滚动,默认false,支持 line、area 图表类型(需配合绑定scrollStart, scroll, scrollEnd 方法) |
| opts.categories | Array Required | 数据类别分类 (pie、ring 图表不需要) |
| opts.dataLabel | Boolean | 是否在图表中显示数据内容值,默认true |
| opts.dataPointShare | Boolean | 是否在图表中显示数据点图形标识,默认true |
| opts.xAxis | Object | X轴配置 |
| opts.xAxis.gridColor | String | X轴网格颜色 |
| opts.xAxis.fontColor | String | X轴数据点颜色 |
| opts.xAxis.disableGrid | Boolean | 不绘制X轴网格,默认false |
| opts.xAxis.type | String | 可选值:calibration(刻度),默认包含样式 |
| opts.yAxis | Object | Y轴配置 |
| opts.yAxis.format | Function | 自定义Y轴文案显示 |
| opts.yAxis.min | Number | Y轴起始值 |
| opts.yAxis.man | Number | Y轴终止值 |
| opts.yAxis.title | String | Y轴title |
| opts.yAxis.gridColor | String | Y轴网格颜色 |
| opts.yAxis.fontColor | String | Y轴数据点颜色 |
| opts.yAxis.titleFontColor | String | Y轴title颜色 |
| opts.yAxis.disabled | Boolean | 不绘制Y轴,默认false |
| opts.extra | Object | 其它非通用配置项 |
| opts.extra.ringWidth | Number | ring圆环宽度,单位px |
| opts.extra.lineStyle | String | 仅对line、area图表有效,可选值:curve曲线、straight直线,默认straight |
| opts.extra.column | Object | column图表相关配置 |
| opts.extra.column.width | Number | 柱状图每项的图形宽度,单位px |
| opts.extra.legendTextColor | String | legend文案颜色 |
| opts.series | Array Required | 数据列表 |
数据列表series每项参数说明
| 参数 | 类型 | 说明 |
|---|---|---|
| dataItem | Object | |
| dataItem.data | Array Required | 饼图、圆环图为Number数据,如果传入null,图表、该处出现断点 |
| dataItem.color | String | 不传入则使用系统默认的配色方案 |
| dataItem.name | String | 数据名称 |
| dataItem.format | Function | 自定义显示数据内容 |
ring 图表相关配置
| 参数 | 类型 | 说明 |
|---|---|---|
| opts.title | Object | 仅支持 ring 图表类型 |
| opts.title.name | String | 标题内容 |
| opts.title.fontSize | Number | 标题字体大小,单位px |
| opts.title.color | String | 标题颜色 |
| opts.title.offsetX | Number | 标题横向位置偏移量,单位px,默认0 |
| opts.subtitle | Object | 仅支持 ring 图表类型 |
| opts.subtitle.name | String | 副标题内容 |
| opts.subtitle.fontSize | Number | 副标题字体大小,单位px |
| opts.subtitle.color | String | 副标题颜色 |
| opts.subtitle.offsetX | Number | 副标题横向位置偏移量,单位px,默认0 |
radar 图表相关配置
| 参数 | 类型 | 说明 |
|---|---|---|
| opts.extra.radar | Object | radar图表相关配置 |
| opts.extra.radar.max | Number | 数据区间最大值,用于调整数据显示的比例,默认series data的最大值 |
| opts.extra.radar.labelColor | String | 各项标识文案的颜色,默认#666 |
| opts.extra.radar.gridColor | String | 雷达图网格颜色,默认#ccc |
pie、ring 图表相关配置
| 参数 | 类型 | 说明 |
|---|---|---|
| opts.disablePieStroke | Boolean | 不绘制pie、ring图表各区块的白色分割线,默认false |
| opts.extra.pie | Object | pie、ring图表相关配置 |
| opts.extra.pie.offsetAngle | Number | 起始角度偏移度数,顺时针方向,起点为3点钟位置(比如要设置起点为12点钟位置,即逆时针偏移90度,传入-90即可),默认0 |
wx-charts 方法
- updateData(data) 更新图表数据。data: object,data.categories(可选),data.series(可选),data.title(可选),data.subtitle(可选)
- stopAnimation(),停止当前正在展示的动画效果,直接展示渲染的最终结果。
- addEventListener(type, listener) 添加事件监听,type: string 事件类型,listener: function 处理函数。
- getCurrentDataIndex(e) 获取图表中点击时的数据序列编号(-1表示未找到对应的数据区域),e: object 微信小程序标准事件,需要在 wxml 上绑定 touch 事件。
<canvas bindtouchstart="touchHandler" canvas-id="pieCanvas" disable-scroll="true" class="pieCanvas" style="width:300px; height:300px;"></canvas>

touchHandler (e) {
    let index = this.data.chart.getCurrentDataIndex(e);
    console.log('index', index)
}
- howToolTip(e, options?) 图表中展示数据详细内容(目前仅支持 line 和 area 图表类型),详见github
- scrollStart(e), scroll(e), scrollEnd(e) 设置支持图表拖拽系列事件(支持 line,area,column),详见github
事件
renderComplete 图表渲染完成(如果有动画,则动画完成时触发)
chart.addEventListener('renderComplete', () => {
    // your code here
});

有“AI”的1024 = 2048,欢迎大家加入2048 AI社区
更多推荐


 30
30 0
0- 0


 已为社区贡献5条内容

所有评论(0)