数据分析 agent :ES和kibana 可视化工具链接
·
用户名,密码:elastic:KgcrC5GAkHqAxlcYk18p
1,拉去本地ES 镜像
docker load -i E:/xxxx/xxxxx/xxxx镜像/es.tar

或 进入 tar包所在目录,cmd:

docker load -i es.tar
C:\Users\13032> docker load -i E:/xxx/xxx/xxxx/es.tar
Loaded image: dockercompose-elasticsearch:latest
启动:
docker images

docker run -d --name elasticsearch -p 9200:9200 -p 9300:9300 -e "discovery.type=single-node"
-e "ES_JAVA_OPTS=-Xms1g -Xmx1g" dockercompose-elasticsearch:latest
参数说明:
-d:后台运行容器。
--name elasticsearch:指定容器名称为 elasticsearch。
-p 9200:9200 -p 9300:9300:映射 HTTP 端口(9200)和集群通信端口(9300)。
-e "discovery.type=single-node":设置为单节点模式,避免集群发现错误。
-e "ES_JAVA_OPTS=-Xms1g -Xmx1g":限制 JVM 内存为 1GB,防止内存溢出(可根据机器配置调整)。
elasticsearch:8.19.10:替换为你实际的镜像名和版本。
C:\Users\13032>docker images
                                                                                                   i Info →   U  In Use
IMAGE                                                      ID             DISK USAGE   CONTENT SIZE   EXTRA
dockercompose-elasticsearch:latest                         8bb4c71b1fe1       2.82GB          1.4GB
ghcr.io/huggingface/text-embeddings-inference:cpu-latest   cb570aabbfa0        938MB          239MB
kibana:8.19.10                                             b22584760608       3.05GB         1.39GB
mysql:8.0.41                                               bf577825b52a       1.06GB          246MB
qdrant/qdrant:v1.16                                        c3350fdb72f3        392MB          192MB

C:\Users\13032>docker ps
CONTAINER ID   IMAGE     COMMAND   CREATED   STATUS    PORTS     NAMES

C:\Users\13032>docker run -d --name elasticsearch -p 9200:9200 -p 9300:9300 -e "discovery.type=single-node" -e "ES_JAVA_OPTS=-Xms1g -Xmx1g" elasticsearch:latest
Unable to find image 'elasticsearch:latest' locally

C:\Users\13032>docker run -d --name elasticsearch -p 9200:9200 -p 9300:9300 -e "discovery.type=single-node" -e "ES_JAVA_OPTS=-Xms1g -Xmx1g" dockercompose-elasticsearch:latest
9aefb53e049390bd5e43bda28194be97bdb4f024ea46f2103ae2ca20887b7a99

C:\Users\13032>docker ps
CONTAINER ID   IMAGE                                COMMAND                   CREATED         STATUS         PORTS                                                                                      NAMES
9aefb53e0493   dockercompose-elasticsearch:latest   "/bin/tini -- /usr/l…"   5 seconds ago   Up 4 seconds   0.0.0.0:9200->9200/tcp, [::]:9200->9200/tcp, 0.0.0.0:9300->9300/tcp, [::]:9300->9300/tcp   elasticsearch

C:\Users\13032>
2,网上远端拉取
docker pull elasticsearch:8.17.4
启动:
docker run -d --name elasticsearch -p 9200:9200 -p 9300:9300 -e "discovery.type=single-node" -e "ES_JAVA_OPTS=-Xms1024m -Xmx1024m" elasticsearch:8.17.4
3,重置密码
第一步:查找正确的容器名称
执行以下命令,查看所有容器(包括已停止的):

docker ps -a

在输出结果中,找到你启动的 Elasticsearch 容器,并记下 NAMES 列下的确切名称。
第二步:使用正确的名称执行命令
假设你在上一步中找到的容器名称是 elasticsearch,那么你需要将命令中的 es 替换为 elasticsearch:

docker exec -it elasticsearch bin/elasticsearch-reset-password -u elastic
C:\Users\13032>docker ps -a
CONTAINER ID   IMAGE                                COMMAND                   CREATED         STATUS         PORTS                                                                                      NAMES
9aefb53e0493   dockercompose-elasticsearch:latest   "/bin/tini -- /usr/l…"   8 minutes ago   Up 8 minutes   0.0.0.0:9200->9200/tcp, [::]:9200->9200/tcp, 0.0.0.0:9300->9300/tcp, [::]:9300->9300/tcp   elasticsearch

C:\Users\13032>docker exec -it elasticsearch bin/elasticsearch-reset-password -u elastic
WARNING: Owner of file [/usr/share/elasticsearch/config/users] used to be [root], but now is [elasticsearch]
WARNING: Owner of file [/usr/share/elasticsearch/config/users_roles] used to be [root], but now is [elasticsearch]
This tool will reset the password of the [elastic] user to an autogenerated value.
The password will be printed in the console.
Please confirm that you would like to continue [y/N]y


Password for the [elastic] user successfully reset.
New value: KgcrC5GAkHqAxlcYk18p

What's next:
    Try Docker Debug for seamless, persistent debugging tools in any container or image → docker debug elasticsearch
    Learn more at https://docs.docker.com/go/debug-cli/
4:验证服务是否启动成功
docker ps
若容器状态为 Up,说明启动成功。接着访问浏览器或命令行测试:
curl http://localhost:9200

    或者
curl -k -u elastic:KgcrC5GAkHqAxlcYk18p https://localhost:9200
应返回类似如下 JSON 响应,包含 version.number 字段,确认 ES 正常运行:
{
  "name": "elasticsearch",
  "cluster_name": "docker-cluster",
  "version": {
    "number": "8.19.10"
  }
}
C:\Users\13032>curl -k -u elastic:KgcrC5GAkHqAxlcYk18p https://localhost:9200
{
  "name" : "9aefb53e0493",
  "cluster_name" : "docker-cluster",
  "cluster_uuid" : "MMzYnX0bSK6-sDynBuE4Tg",
  "version" : {
    "number" : "8.19.10",
    "build_flavor" : "default",
    "build_type" : "docker",
    "build_hash" : "493241b351be6d9f40d52a1406c91a23b4148821",
    "build_date" : "2026-01-08T22:07:49.939644068Z",
    "build_snapshot" : false,
    "lucene_version" : "9.12.2",
    "minimum_wire_compatibility_version" : "7.17.0",
    "minimum_index_compatibility_version" : "7.0.0"
  },
  "tagline" : "You Know, for Search"
}

C:\Users\13032>
5,ES 关联 中文分词 IK 插件
第一步:确认 ES 容器名称与版本
docker ps
CONTAINER ID   IMAGE          COMMAND                  CREATED        STATUS       PORTS                               NAMES
a1b2c3d4e5f6   elasticsearch:8.19.10   "/bin/tini -- /usr/l…"   2 hours ago    Up 2 hours   0.0.0.0:9200->9200/tcp, :::9200->9200/tcp   elasticsearch
记下 NAMES 列的容器名(如 elasticsearch)和 IMAGE 列的版本号(如 8.19.10)。你的插件版本 8.19.10 必须与此完全一致,否则启动会失败
第二步:将插件文件复制到容器内
docker cp "E:\xxxx\xxxx\xxxxx\plugins\elasticsearch-analysis-ik-8.19.10.zip" elasticsearch:/tmp/elasticsearch-analysis-ik-8.19.10.zip
第三步:进入容器并安装插件
执行以下命令进入容器内部:
docker exec -it elasticsearch /bin/bash
在容器内执行以下命令安装插件:
/usr/share/elasticsearch/bin/elasticsearch-plugin install file:///tmp/elasticsearch-analysis-ik-8.19.10.zip

安装过程中会提示是否信任该插件,输入 y 并回车确认。
第四步:清理临时文件并退出容器
rm /tmp/elasticsearch-analysis-ik-8.19.10.zip

exit
第五步:重启容器使插件生效
docker restart elasticsearch
第六步:验证插件是否安装成功
docker exec -it elasticsearch /usr/share/elasticsearch/bin/elasticsearch-plugin list

如果输出中包含 analysis-ik,则说明安装成功。
第七步:测试 IK 分词器功能
ubutun:
curl -X POST "localhost:9200/_analyze" -H 'Content-Type: application/json' -d' {"analyzer": "ik_max_word","text": "中华人民共和国万岁"}'
windows:
curl -k -u elastic:你的密码 -X POST "https://localhost:9200/_analyze" -H "Content-Type: application/json" -d "{\"analyzer\": \"ik_max_word\", \"text\": \"中华人民共和国万岁\"}"

curl -k -u elastic:KgcrC5GAkHqAxlcYk18p -X POST "https://localhost:9200/_analyze" -H "Content-Type: application/json" -d "{\"analyzer\": \"ik_max_word\", \"text\": \"中华人民共和国万岁\"}"

预期输出应包含“中华人民共和国”、“万岁”等词语的分词结果,而非单字切分。
C:\Users\13032>docker cp "E:\xxxxx\xxxx\xxxx\xxxxx\plugins\elasticsearch-analysis-ik-8.19.10.zip" elasticsearch:/tmp/elasticsearch-analysis-ik-8.19.10.zip
Successfully copied 4.62MB (transferred 4.62MB) to elasticsearch:/tmp/elasticsearch-analysis-ik-8.19.10.zip

C:\Users\13032>docker exec -it elasticsearch /bin/bash
elasticsearch@9aefb53e0493:~$ /usr/share/elasticsearch/bin/elasticsearch-plugin install file:///tmp/elasticsearch-analysis-ik-8.19.10.zip
-> Installing file:///tmp/elasticsearch-analysis-ik-8.19.10.zip
-> Downloading file:///tmp/elasticsearch-analysis-ik-8.19.10.zip
[=================================================] 100%??
-> Failed installing file:///tmp/elasticsearch-analysis-ik-8.19.10.zip
-> Rolling back file:///tmp/elasticsearch-analysis-ik-8.19.10.zip
-> Rolled back file:///tmp/elasticsearch-analysis-ik-8.19.10.zip

ERROR: plugin directory [/usr/share/elasticsearch/plugins/analysis-ik] already exists; if you need to update the plugin, uninstall it first using command 'remove analysis-ik', with exit code 1

elasticsearch@9aefb53e0493:~$ /usr/share/elasticsearch/bin/elasticsearch-plugin remove analysis-ik
-> removing [analysis-ik]...
-> preserving plugin config files [/usr/share/elasticsearch/config/analysis-ik] in case of upgrade; use --purge if not needed

elasticsearch@9aefb53e0493:~$ /usr/share/elasticsearch/bin/elasticsearch-plugin install file:///tmp/elasticsearch-analysis-ik-8.19.10.zip
-> Installing file:///tmp/elasticsearch-analysis-ik-8.19.10.zip
-> Downloading file:///tmp/elasticsearch-analysis-ik-8.19.10.zip
[=================================================] 100%??
WARNING: this plugin contains a legacy Security Policy file. Starting with version 8.18, Entitlements replace SecurityManager as the security mechanism. Plugins must migrate their policy files to the new format. For more information, please refer to https://www.elastic.co/guide/en/elasticsearch/plugins/current/creating-classic-plugins.html
@@@@@@@@@@@@@@@@@@@@@@@@@@@@@@@@@@@@@@@@@@@@@@@@@@@@@@@@@@@
@     WARNING: plugin requires additional entitlements    @
@@@@@@@@@@@@@@@@@@@@@@@@@@@@@@@@@@@@@@@@@@@@@@@@@@@@@@@@@@@
* outbound_network
See https://www.elastic.co/guide/en/elasticsearch/plugins/current/creating-classic-plugins.html
for descriptions of what these entitlements allow and the associated risks.

Continue with installation? [y/N]y
-> Installed analysis-ik
-> Please restart Elasticsearch to activate any plugins installed

elasticsearch@9aefb53e0493:~$ rm /tmp/elasticsearch-analysis-ik-8.19.10.zip
rm: remove write-protected regular file '/tmp/elasticsearch-analysis-ik-8.19.10.zip'?

elasticsearch@9aefb53e0493:~$ exit
exit

What's next:
    Try Docker Debug for seamless, persistent debugging tools in any container or image → docker debug elasticsearch
    Learn more at https://docs.docker.com/go/debug-cli/

C:\Users\13032>docker restart elasticsearch
elasticsearch

C:\Users\13032>docker exec -it elasticsearch /usr/share/elasticsearch/bin/elasticsearch-plugin list
analysis-ik

What's next:
    Try Docker Debug for seamless, persistent debugging tools in any container or image → docker debug elasticsearch
    Learn more at https://docs.docker.com/go/debug-cli/


C:\Users\13032>curl -X POST "-k -u elastic:KgcrC5GAkHqAxlcYk18p https://localhost:9200/_analyze" -H 'Content-Type: application/json' -d' {"analyzer": "ik_max_word","text": "中华人民共和国万岁"}'
curl: option -k -u elastic:KgcrC5GAkHqAxlcYk18p https://localhost:9200/_analyze: is unknown
curl: try 'curl --help' for more information

C:\Users\13032>curl -k -u elastic:KgcrC5GAkHqAxlcYk18p -X POST "https://localhost:9200/_analyze" -H "Content-Type: application/json" -d "{\"analyzer\": \"ik_max_word\", \"text\": \"中华人民共和国万岁\"}"
{"tokens":[{"token":"中华人民共和国","start_offset":0,"end_offset":7,"type":"CN_WORD","position":0},{"token":"中华人民","start_offset":0,"end_offset":4,"type":"CN_WORD","position":1},{"token":"中华","start_offset":0,"end_offset":2,"type":"CN_WORD","position":2},{"token":"华人","start_offset":1,"end_offset":3,"type":"CN_WORD","position":3},{"token":"人民共和国","start_offset":2,"end_offset":7,"type":"CN_WORD","position":4},{"token":"人民","start_offset":2,"end_offset":4,"type":"CN_WORD","position":5},{"token":"共和国","start_offset":4,"end_offset":7,"type":"CN_WORD","position":6},{"token":"共和","start_offset":4,"end_offset":6,"type":"CN_WORD","position":7},{"token":"国","start_offset":6,"end_offset":7,"type":"CN_CHAR","position":8},{"token":"万岁","start_offset":7,"end_offset":9,"type":"CN_WORD","position":9},{"token":"万","start_offset":7,"end_offset":8,"type":"TYPE_CNUM","position":10},{"token":"岁","start_offset":8,"end_offset":9,"type":"COUNT","position":11}]}
C:\Users\13032>
8,和ES交互的 图形化界面 Kibana
Kibana 是 Elasticsearch 生态中的核心可视化工具,主要作用是为用户提供一个图形化界面,用来搜索、分析、可视化和管理存储在 Elasticsearch 中的数据。
它常用于日志分析、系统监控、业务智能等场景,支持创建仪表盘、图表、地图等多种可视化组件,并内置 Dev Tools 可直接与 Elasticsearch 交互
docker load -i kibana.tar
xxxx\xxxxx\1.docker镜像>docker load -i kibana.tar
Loaded image: kibana:8.19.10
方法一 启动
docker run -d --name kibana -p 5601:5601 -e "ELASTICSEARCH_HOSTS=http://127.0.0.1:9200" kibana:latest

docker run -d --name kibana -p 5601:5601 -e "ELASTICSEARCH_HOSTS=http://127.0.0.1:9200" kibana:8.19.10
访问 http://localhost:5601
可进入 Kibana 控制台。首次登录时,需使用 elastic 用户及密码

可通过 docker exec -it elasticsearch bin/elasticsearch-reset-password -u elastic 获取)进行认证。

如果你正在搭建 ELK(Elasticsearch + Logstash + Kibana)技术栈,
Kibana 是你最终面向用户的“数据驾驶舱”,所有数据分析、告警配置、仪表板设计都在这里完成。
建议搭配 Elasticsearch 一起部署,确保两者版本兼容(如 ES 8.19.10 对应 Kibana 8.19.10),避免连接失败或功能异常。
方法二
docker-compose.yml 文件,专为 Elasticsearch 8.19.10 和 Kibana 8.19.10 设计
📂 docker-compose.yml 配置文件
version: '3.8'

services:
  elasticsearch:
    image: elasticsearch:8.19.10
    container_name: elasticsearch
    restart: always
    ports:
      - "9200:9200"
      - "9300:9300"
    environment:
      - discovery.type=single-node # 单节点模式
      - xpack.security.enabled=false # 【关键】关闭安全认证,允许 Kibana 直接通过 http 连接
      - xpack.security.enrollment.enabled=false
      - bootstrap.memory_lock=true # 锁定内存,防止 Swap 交换导致性能下降
      - "ES_JAVA_OPTS=-Xms512m -Xmx512m" # 限制 JVM 内存,防止占满电脑内存
    volumes:
      - es_data:/usr/share/elasticsearch/data
      # 如果你之前已经把 IK 插件安装到了容器里,建议把插件目录挂载出来,防止重建容器后插件丢失
      # - ./plugins/ik:/usr/share/elasticsearch/plugins/analysis-ik
    ulimits:
      memlock:
        soft: -1
        hard: -1

  kibana:
    image: kibana:8.19.10 # 确保版本与 ES 一致
    container_name: kibana
    restart: always
    ports:
      - "5601:5601"
    depends_on:
      - elasticsearch
    environment:
      - ELASTICSEARCH_HOSTS=http://elasticsearch:9200 # 使用容器名作为主机名连接
      - I18N_LOCALE=zh-CN # 【可选】设置 Kibana 界面为中文
    volumes:
      - kibana_data:/usr/share/kibana/data

volumes:
  es_data:
    driver: local
  kibana_data:
    driver: local
启动
关闭容器:

docker rm -f elasticsearch kibana
docker-compose up -d
访问:
http://localhost:5601
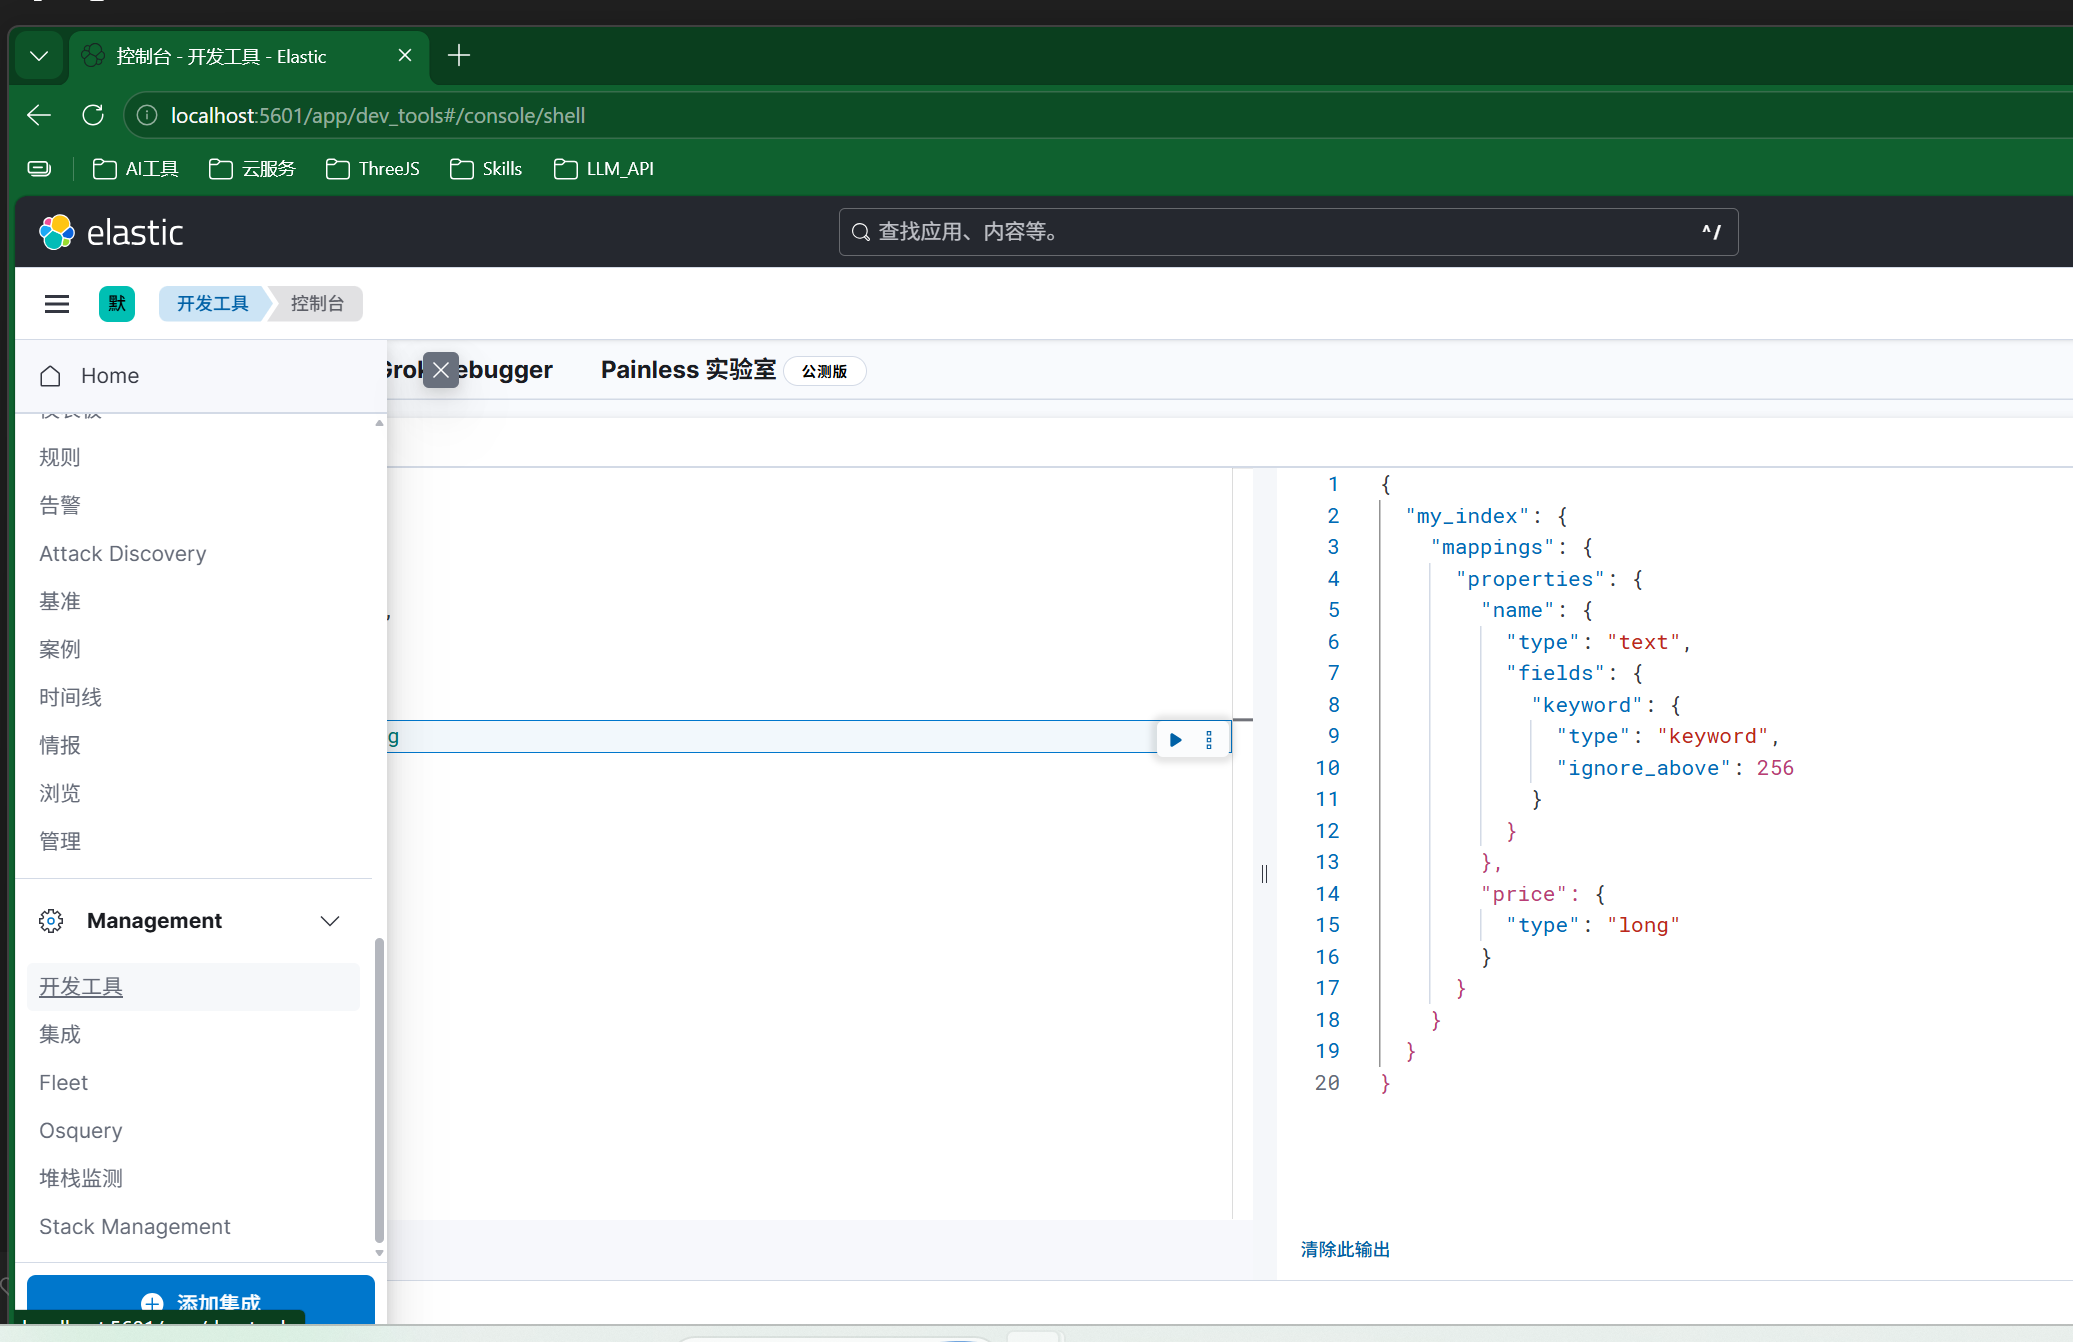
验证状态: 等待约 1-2 分钟(ES 启动较慢),执行以下命令查看日志是否正常:
docker logs -f elasticsearch

当你看到类似 started 且没有报错时,按 Ctrl + C 退出日志查看。
9,python 代码验证 ES 和 kibana链接
🐍 Python 验证脚本 (check_elk.py)
 import requests
import time

# ================= 配置区域 =================
# ES 地址 (根据你的 docker-compose 配置,通常是 9200)
ES_URL = "http://localhost:9200"

# Kibana 地址 (根据你的 docker-compose 配置,通常是 5601)
KIBANA_URL = "http://localhost:5601"
# ===========================================

def check_service(name, url, is_kibana=False):
    print(f"\n🔍 正在检查 {name} ({url}) ...")
    try:
        # 如果是 Kibana,我们只检查页面是否返回 200 OK
        # 如果是 ES,我们尝试获取集群信息
        response = requests.get(url, timeout=5)

        if response.status_code == 200:
            print(f"✅ {name} 连接成功!(状态码: 200)")

            # 针对 ES 打印详细信息
            if not is_kibana:
                data = response.json()
                print(f"   - 集群名称: {data.get('cluster_name', 'N/A')}")
                print(f"   - 版本号:   {data.get('version', {}).get('number', 'N/A')}")
                print(f"   - 集群状态: {data.get('status', 'N/A')} (绿色为健康)")
            return True
        else:
            print(f"⚠️ {name} 响应异常 (状态码: {response.status_code})")
            return False

    except requests.exceptions.ConnectionError:
        print(f"❌ {name} 连接失败:无法连接到服务器。")
        print("   可能原因:容器未启动、端口未映射、或防火墙拦截。")
        return False
    except Exception as e:
        print(f"❌ {name} 发生错误: {e}")
        return False

if __name__ == "__main__":
    print("="*40)
    print("   ELK 环境连通性测试工具")
    print("="*40)

    # 1. 检查 Elasticsearch
    es_ok = check_service("Elasticsearch", ES_URL)

    # 2. 检查 Kibana
    kibana_ok = check_service("Kibana", KIBANA_URL, is_kibana=True)

    print("\n" + "="*40)
    if es_ok and kibana_ok:
        print("🎉 恭喜!ELK 环境部署成功,可以开始使用了!")
    else:
        print("⚠️ 部分服务存在问题,请检查上方的错误提示。")
        if not es_ok:
            print("💡 建议:如果 ES 连不上,请检查 Docker 容器日志 (docker logs elasticsearch)")
    print("="*40)

'''
========================================
   ELK 环境连通性测试工具
========================================

🔍 正在检查 Elasticsearch (http://localhost:9200) ...
✅ Elasticsearch 连接成功!(状态码: 200)
   - 集群名称: docker-cluster
   - 版本号:   8.19.10
   - 集群状态: N/A (绿色为健康)

🔍 正在检查 Kibana (http://localhost:5601) ...
✅ Kibana 连接成功!(状态码: 200)

========================================
🎉 恭喜!ELK 环境部署成功,可以开始使用了!
========================================
'''
有“AI”的1024 = 2048,欢迎大家加入2048 AI社区
更多推荐

 0
0 0
0- 0


 已为社区贡献1条内容

所有评论(0)