SRE AI Agent 开发复盘及小白向教程 (二) GitOps及附属功能搭建
先导:
接上一篇文章
下一篇文章:
目录
本期目标:
完成GitOps及ArgoCD相关环境的搭建和配置。
提前准备:
下载并安装VMworkstation,下载rocky 9.6 linux镜像,下载MobaXterm软件(可选),注册GitHub账户,配置过程中需全程联网,且有包下载,请注意流量消耗。
高亮提示:
绿色:检查点,你应该保证自己的状态与截图一致。
橙色:修正配置问题,如果你确认没有该问题,可以跳过
红色:重要的配置,在后续操作中需要用到,请在配置时记录。
五、配置GitOps仓库
1. 核心工具安装
安装git, tar和helm
# 安装git, tar
dnf install -y git tar

# 安装Helm
curl -fsSL -o get_helm.sh https://raw.githubusercontent.com/helm/helm/main/scripts/get-helm-3
chmod 700 get_helm.sh
./get_helm.sh
验证
which git
which tar
which helm
如图:

2. GitOps仓库配置
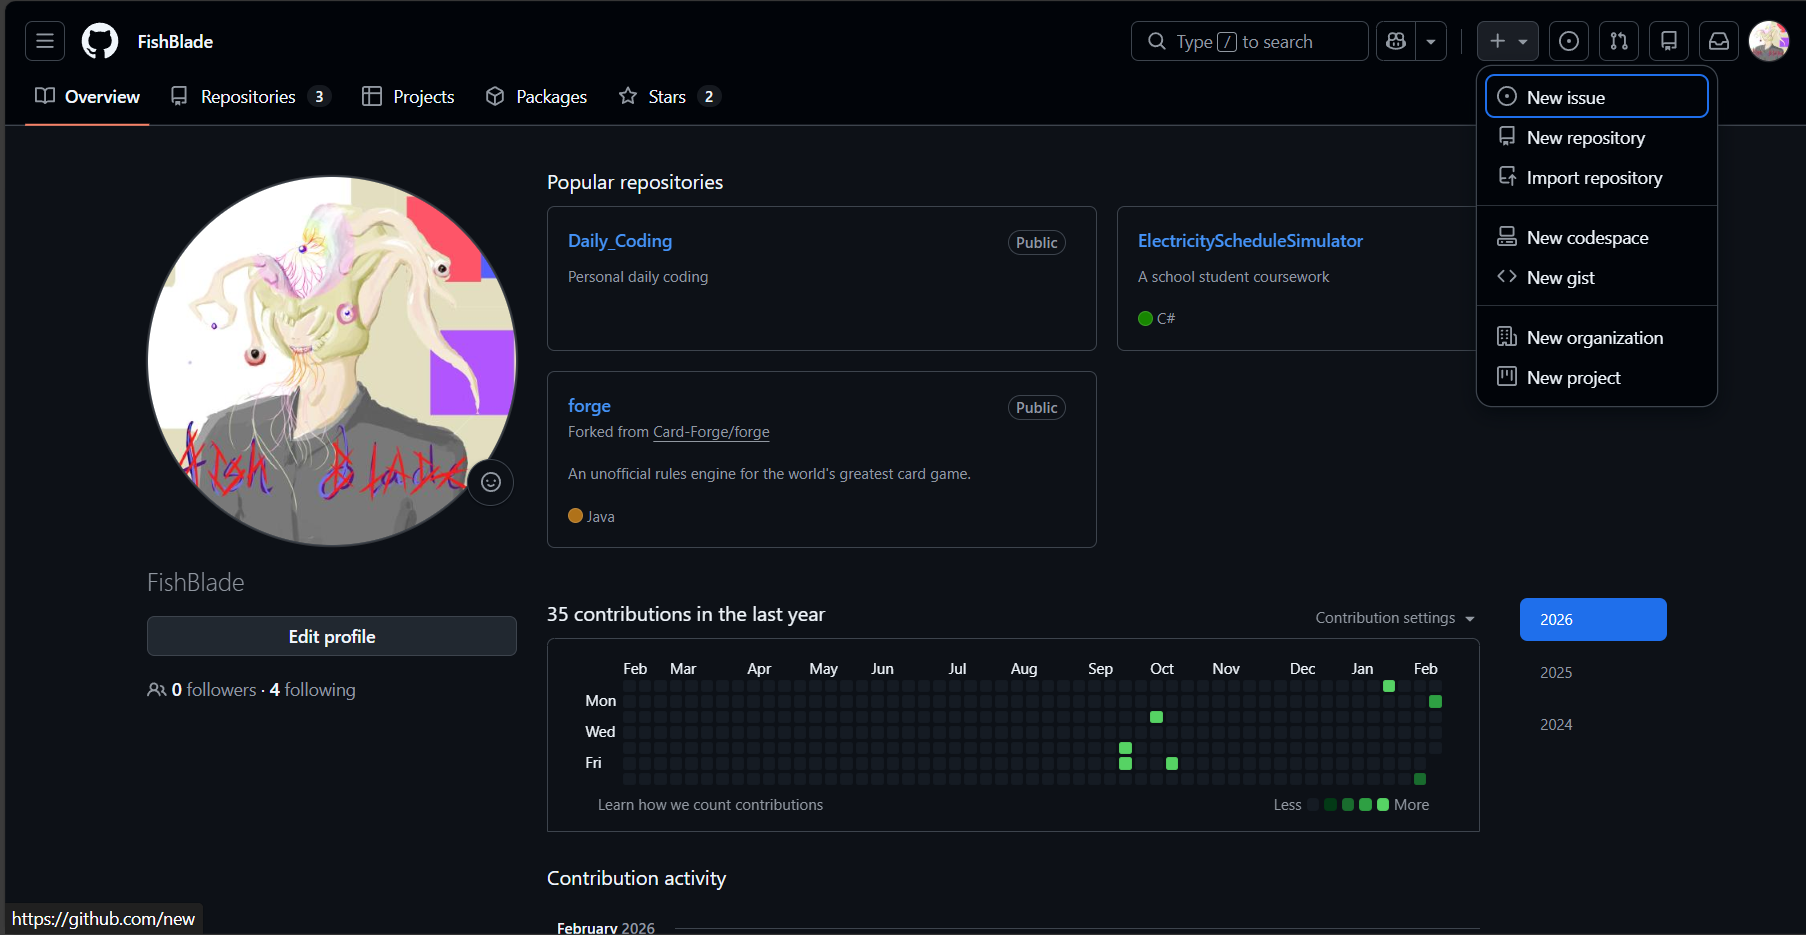
1.在github上创建一个空仓库,在GitHub主页点击右上角的加号,选择第二项 New repository
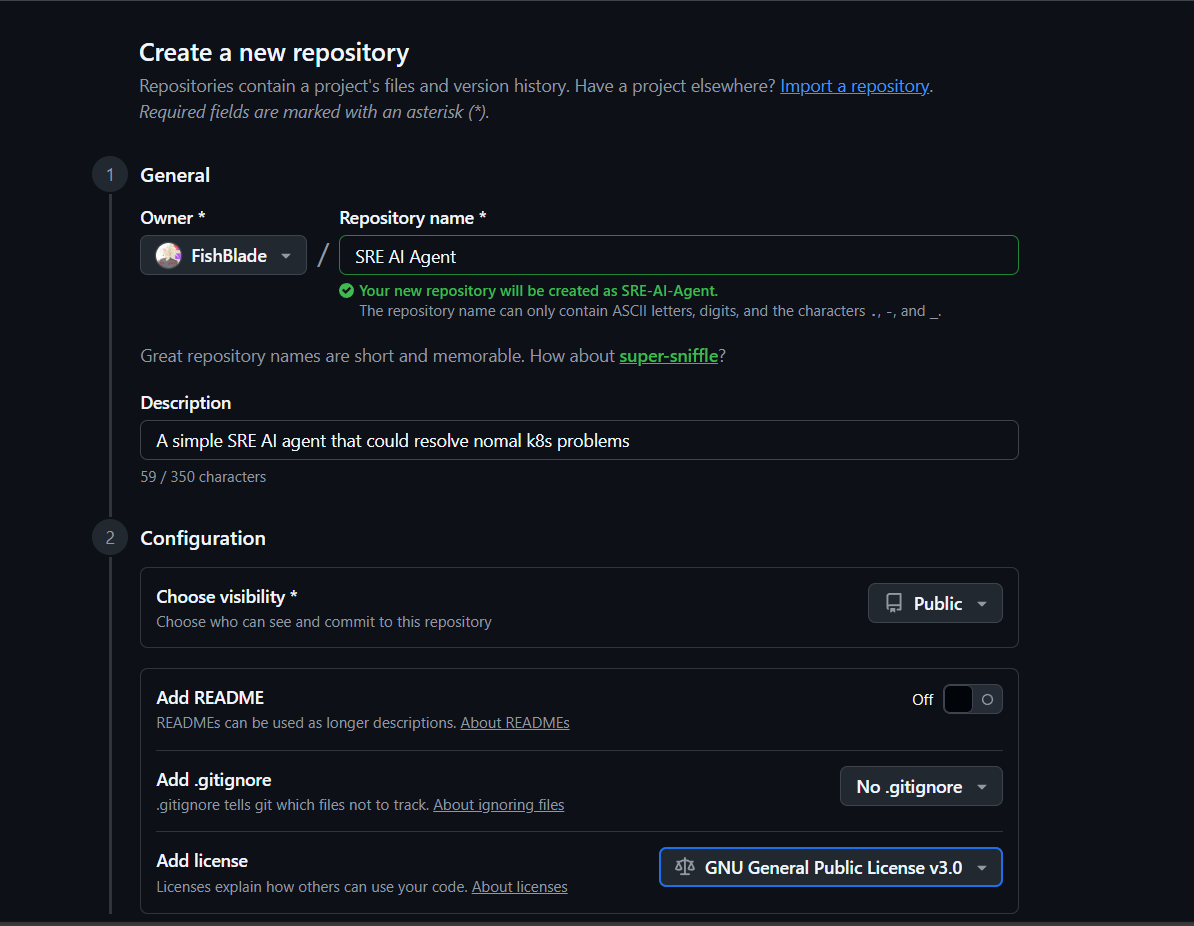
填写资产名字并确认
创建访问密钥
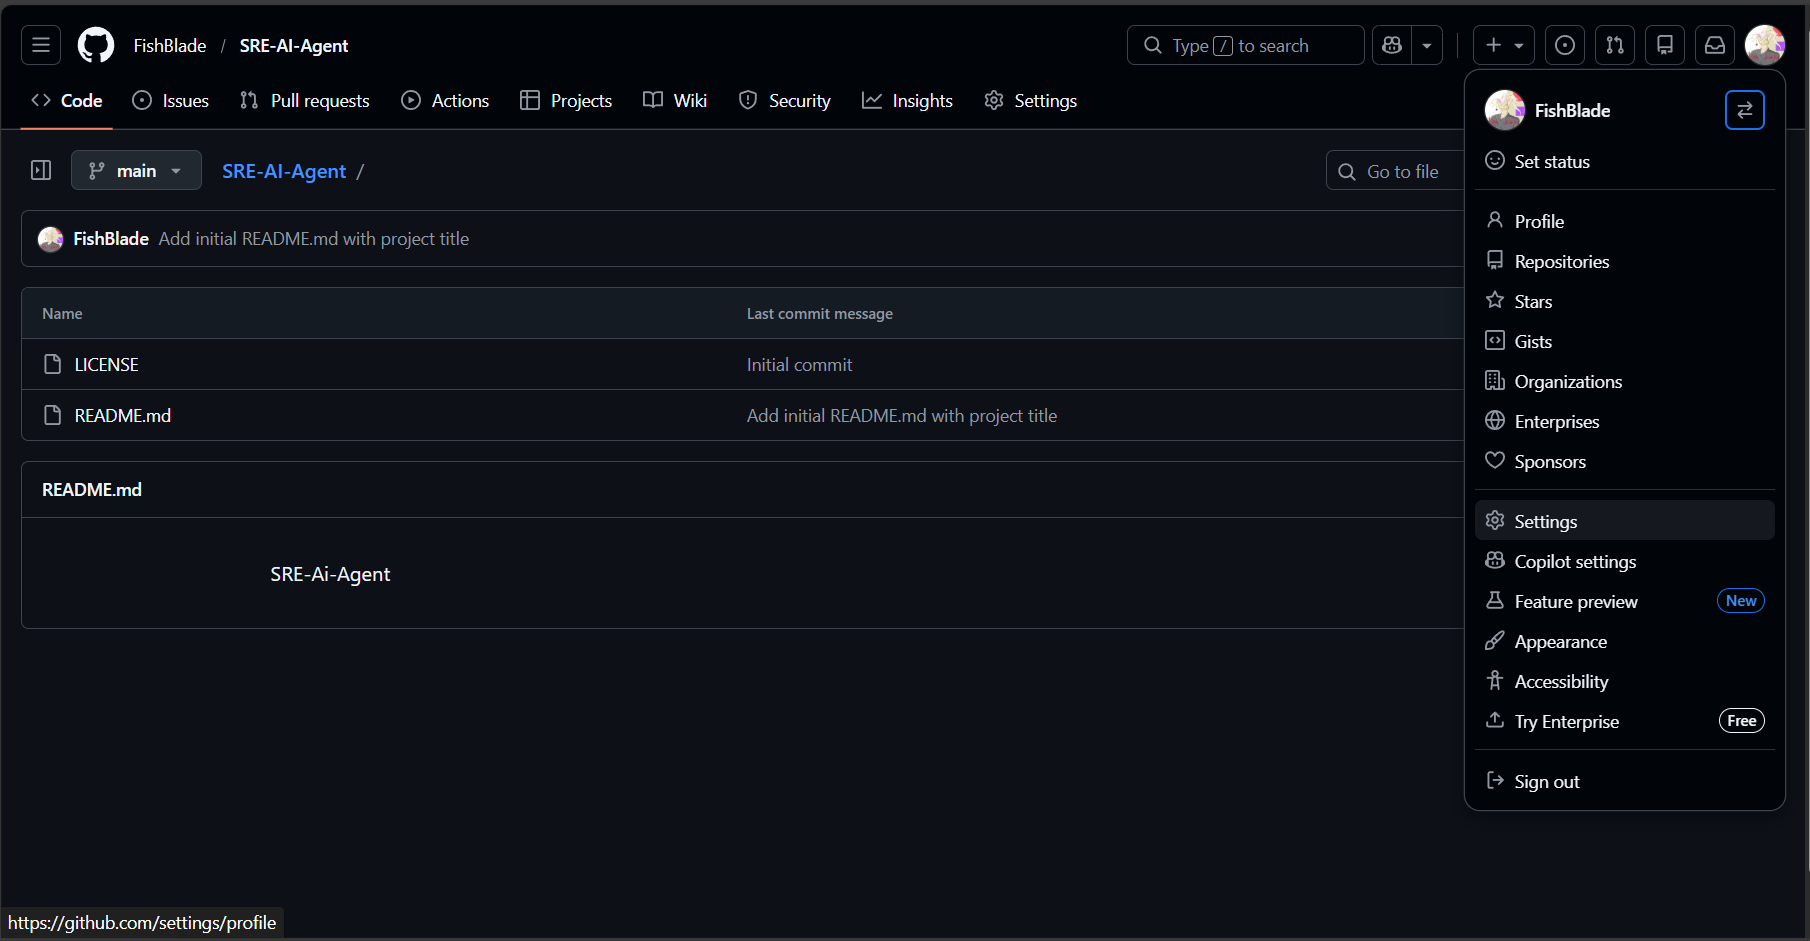
如果你的GitHub是新账户,则还需要设置一个访问密钥,点击你的头像,选Setting
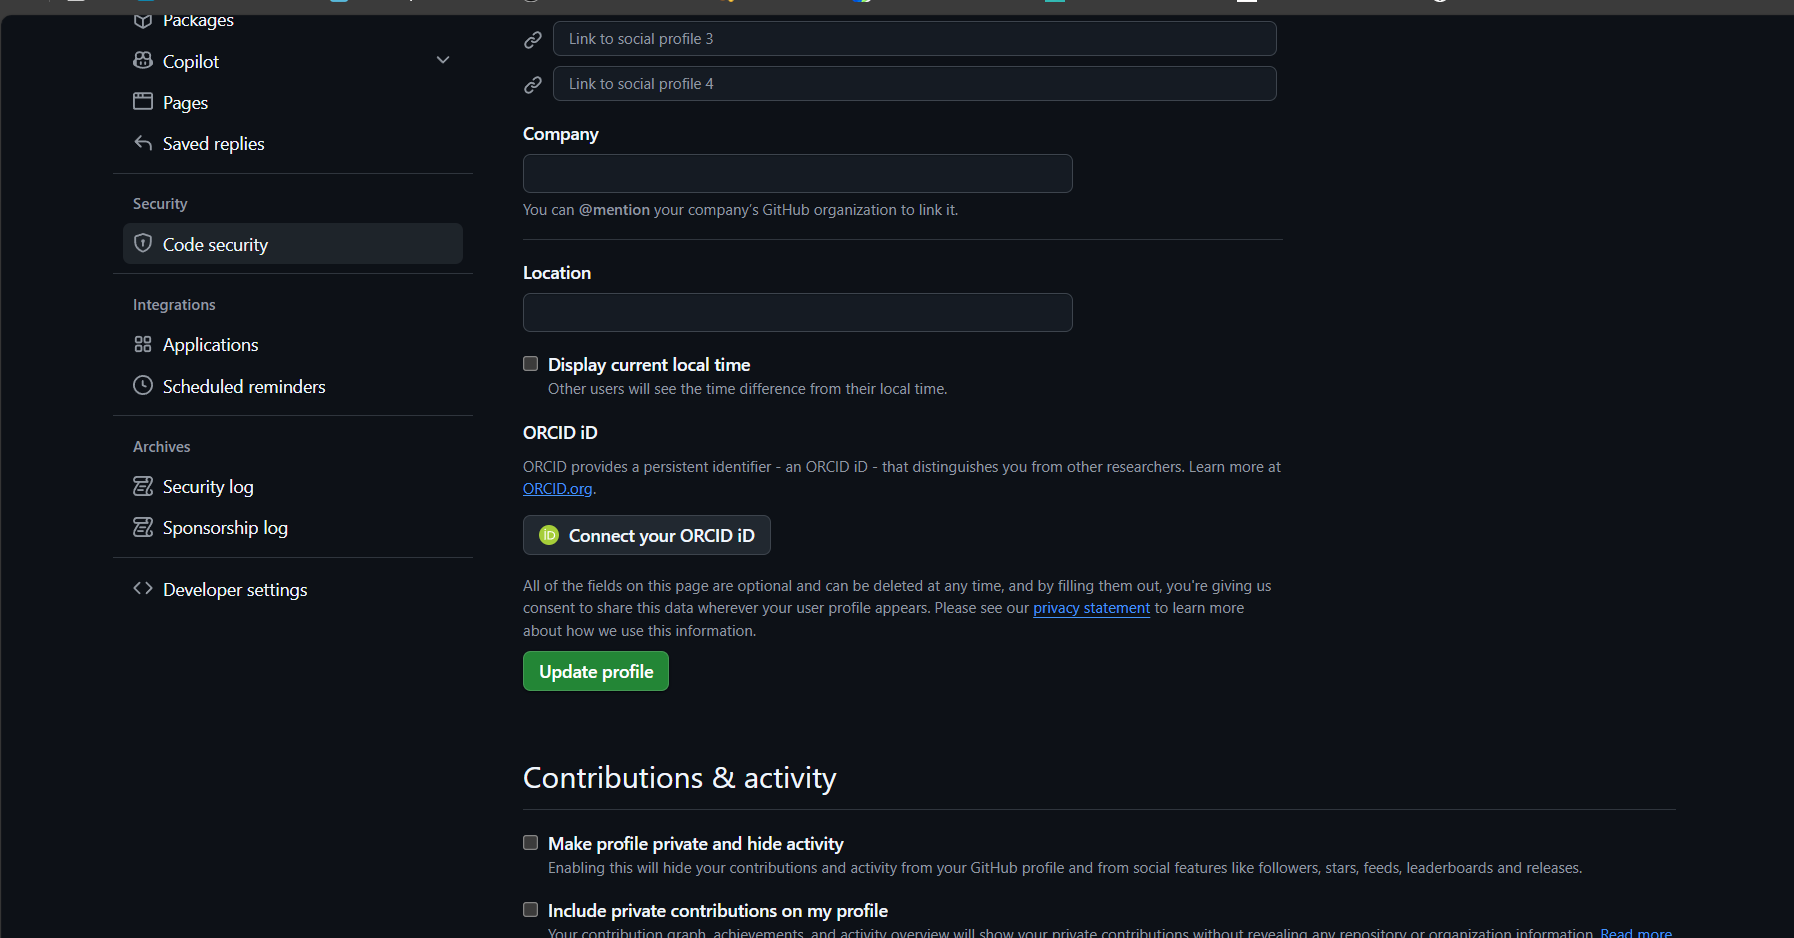
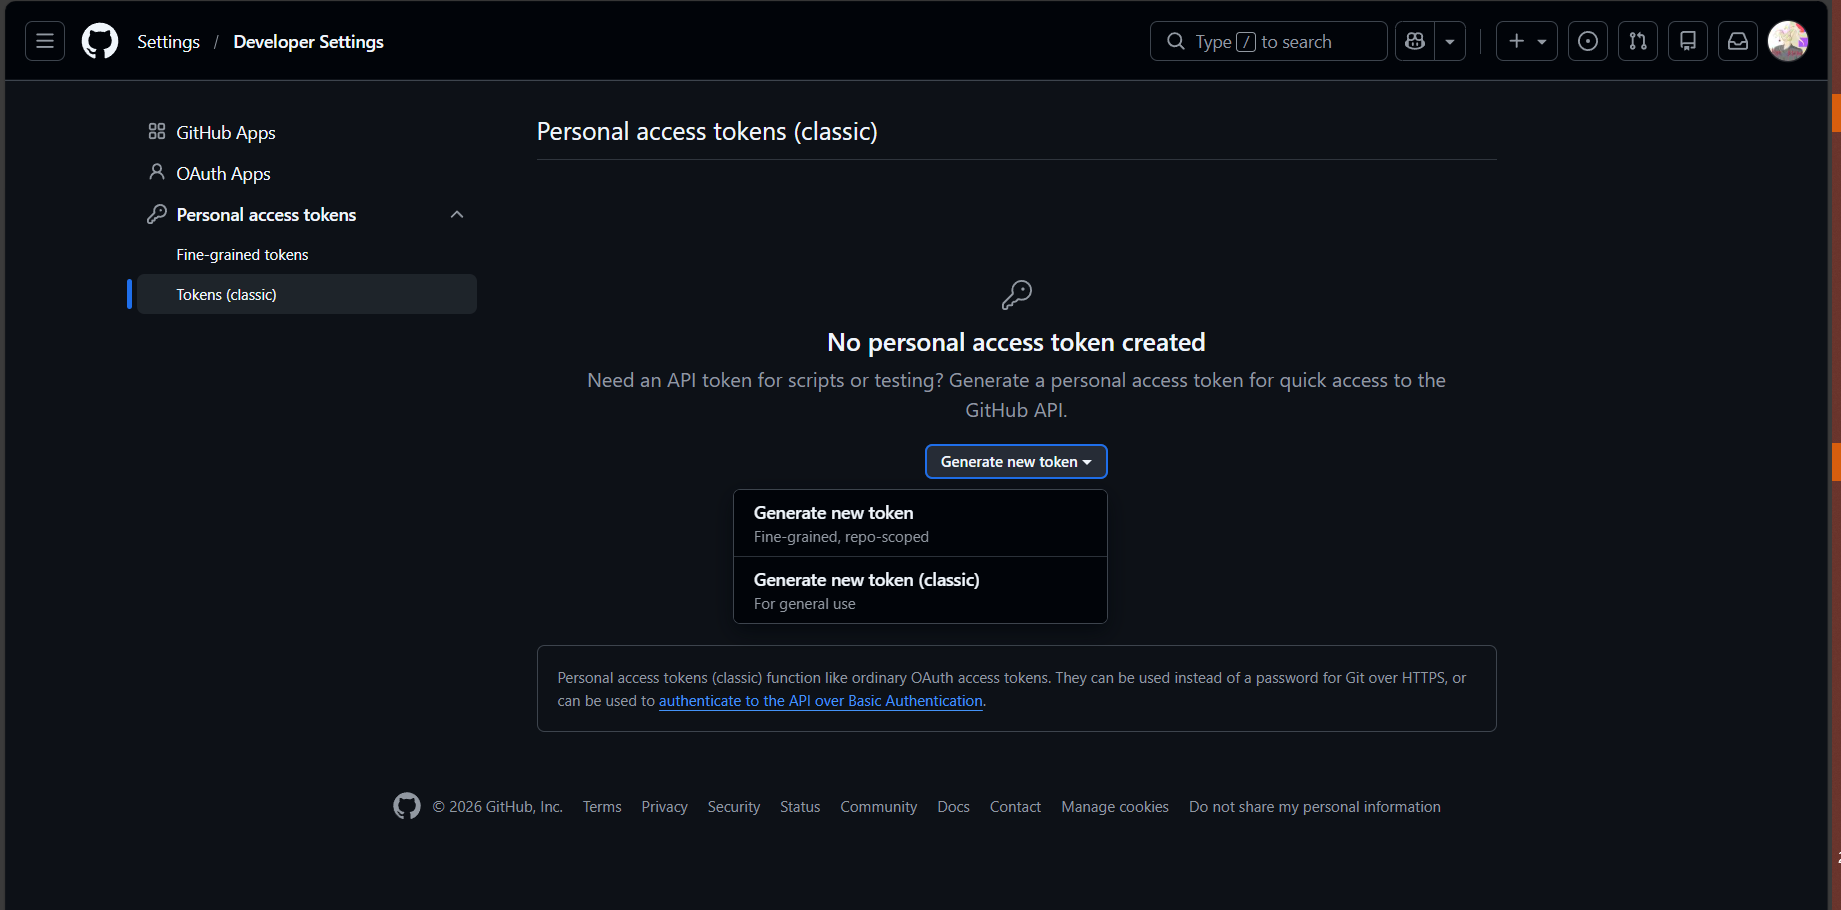
进入后一直下滑,点击左侧栏最下侧的Developer settings
选择第三项的classic,点击页面中心的按钮,再选Generate new token(classic)
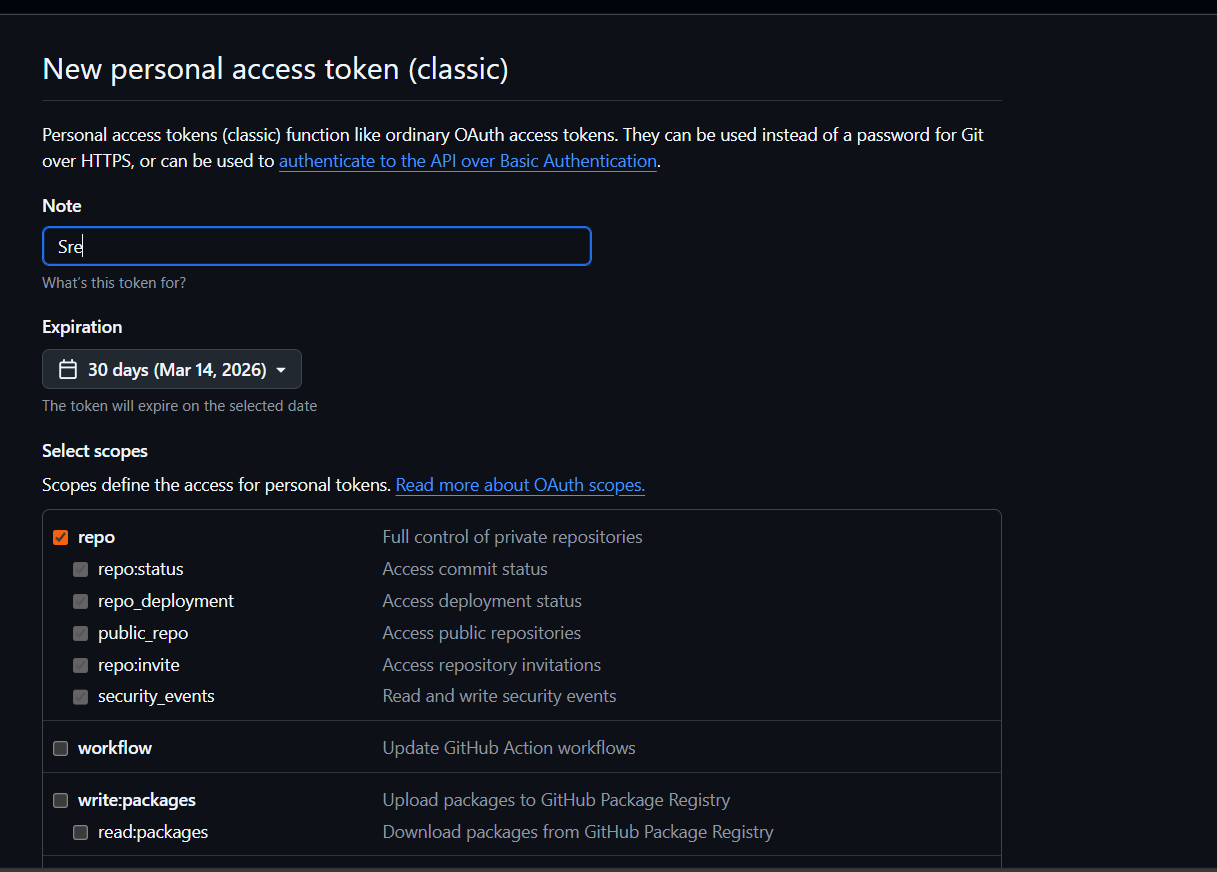
填写密钥的备注,有效期,权限(这里勾选第一个repo就可以了),滑倒最下面点创建
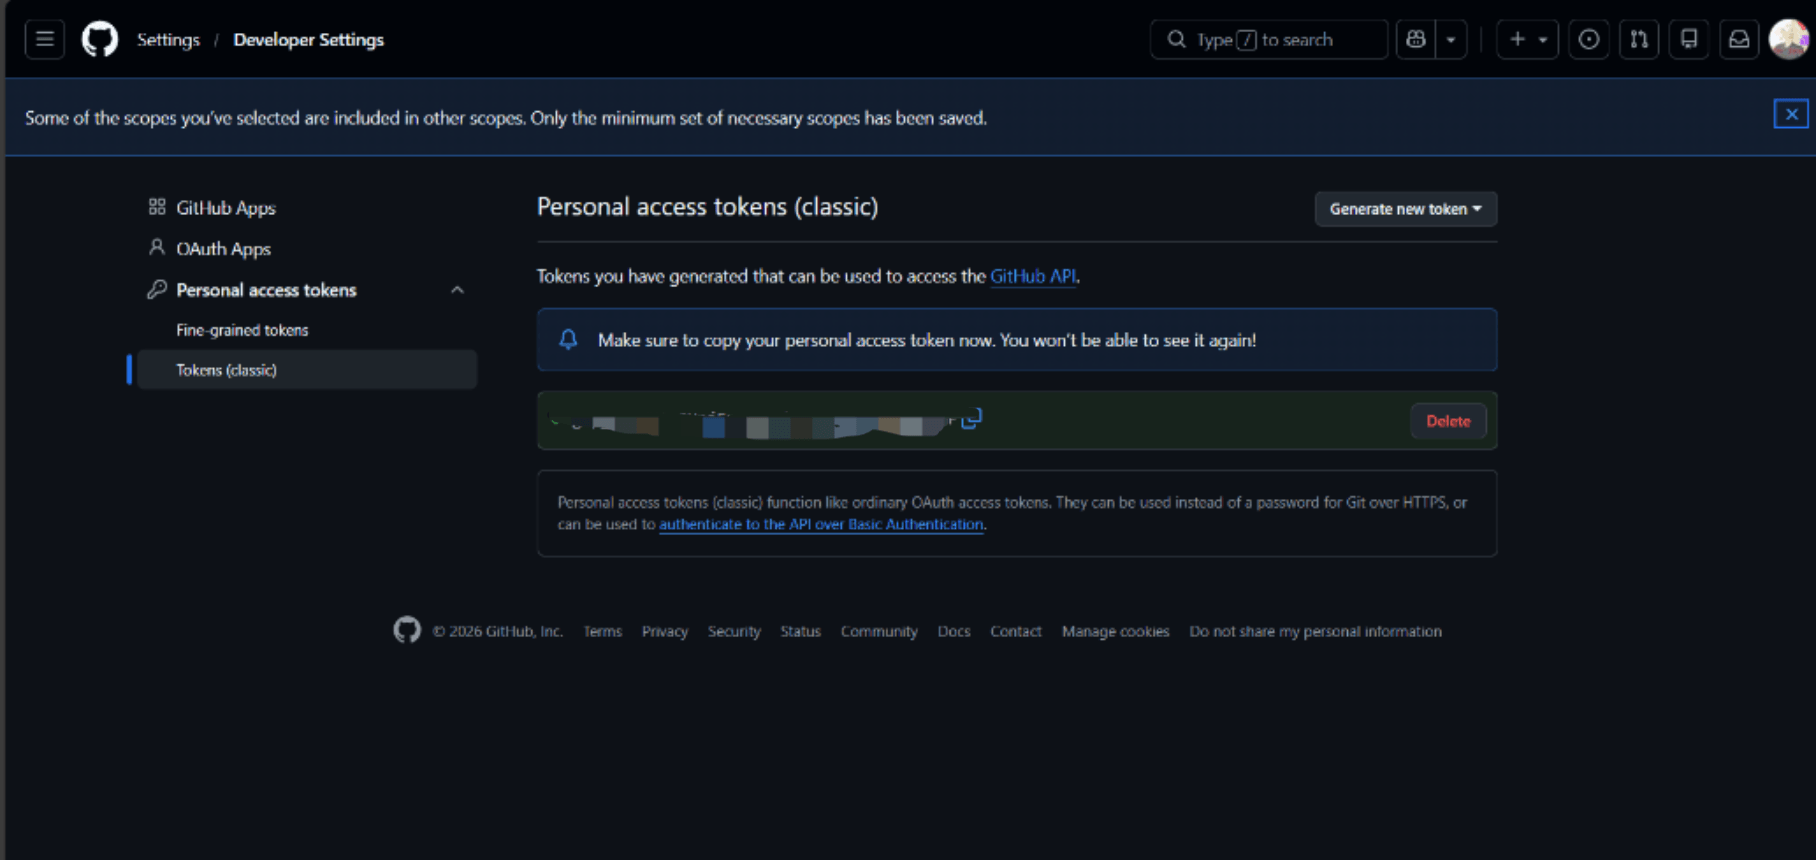
创建后是这样子的,此处的密钥建议复制并保存
然后在虚拟机配置
回到虚拟机
git clone 你仓库的链接像我的就是https://github.com/FishBlade/SRE-AI-Agent,所以我输入的命令是
git clone https://github.com/FishBlade/SRE-AI-Agent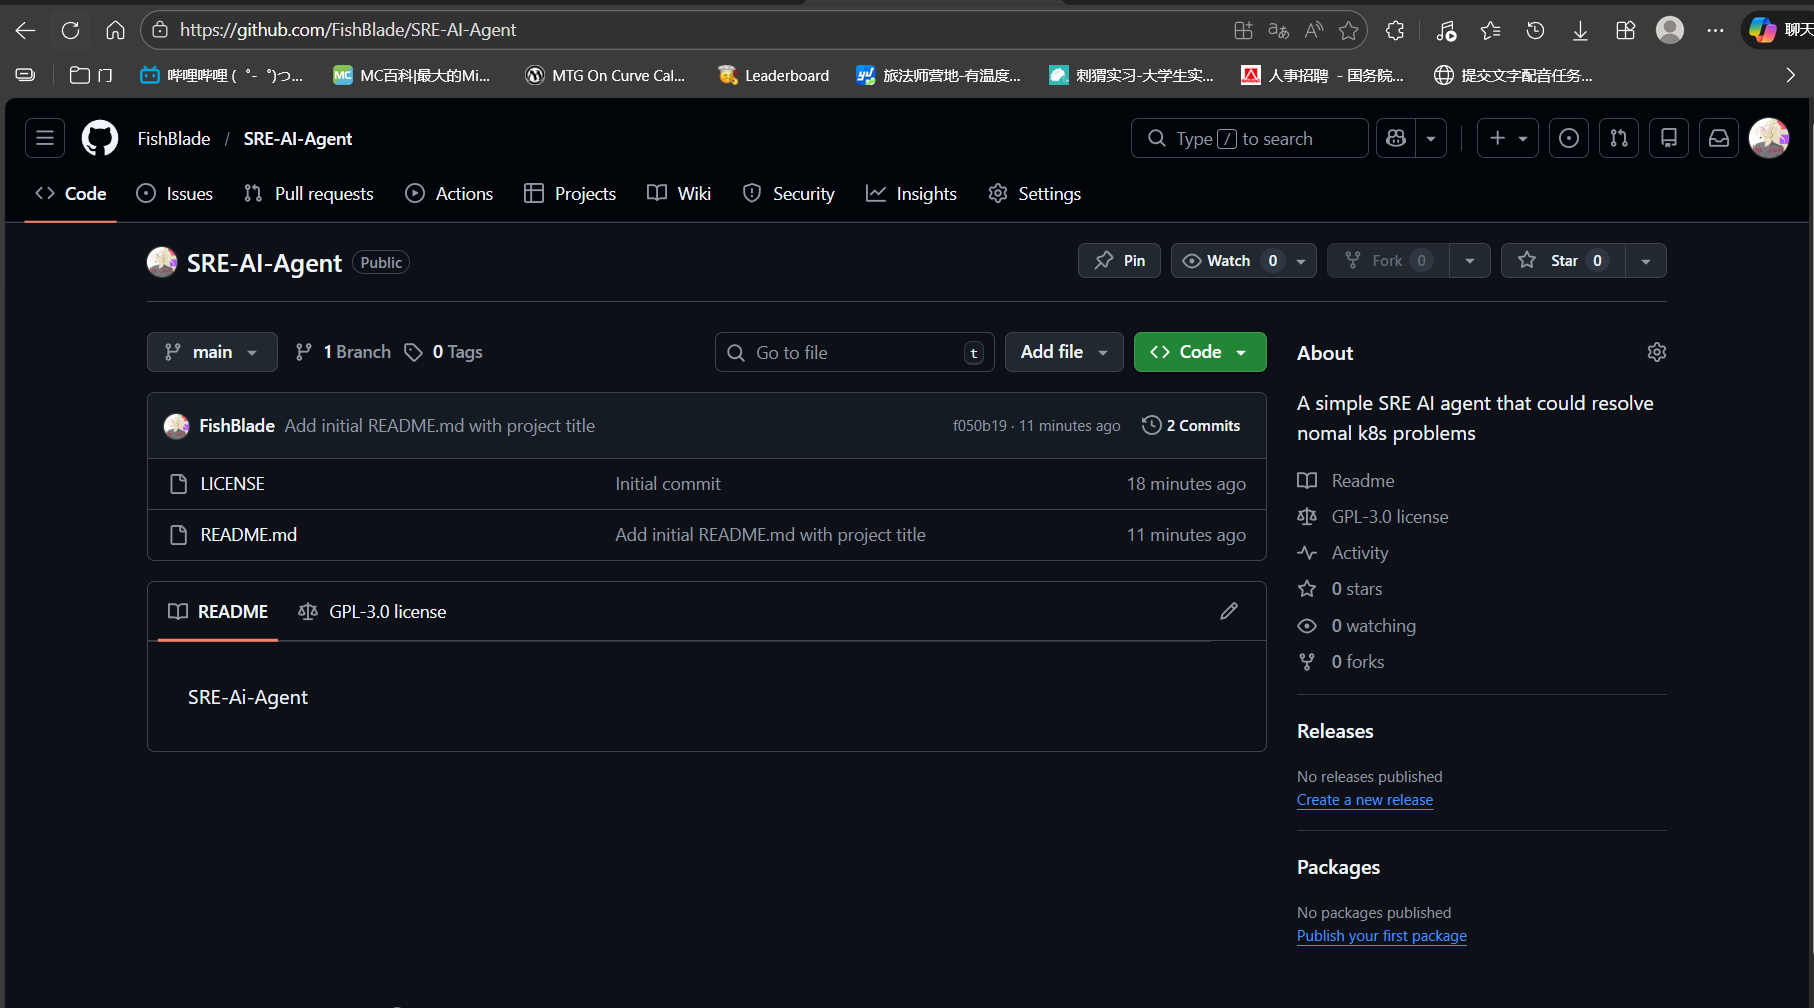
再cd到你的git目录下,我的是 https://github.com/FishBlade/SRE-AI-Agent
所以我输入
cd SRE-AI-Agent/
然后创建ollama目录
mkdir -p apps/ollama修改ollama配置
cat > apps/ollama/ollama.yaml <<'EOF'
apiVersion: v1
kind: Namespace
metadata:
  name: ai-services
---
apiVersion: apps/v1
kind: Deployment
metadata:
  name: ollama
  namespace: ai-services
spec:
  replicas: 1
  selector:
    matchLabels: { app: ollama }
  template:
    metadata:
      labels: { app: ollama }
    spec:
      containers:
      - name: ollama
        image: ollama/ollama:latest
        ports:
        - containerPort: 11434
---
apiVersion: v1
kind: Service
metadata:
  name: ollama-service
  namespace: ai-services
spec:
  type: NodePort
  selector: { app: ollama }
  ports:
  - port: 11434
    targetPort: 11434
EOF
通过git目录提交:
git add .

git commit -m "feat: Initial setup with Ollama configuration"

git push origin main
最后一个命令会提示输入用户名和密码,用户名是你的github用户名,密码是前文的密钥而不是你的GitHub密码
六、安装Argo CD
kubectl create namespace argocd

kubectl apply -n argocd -f https://raw.githubusercontent.com/argoproj/argo-cd/stable/manifests/install.yaml
验证:
watch kubectl get pods -n argocd所有筛选后的pods状态都应该是running
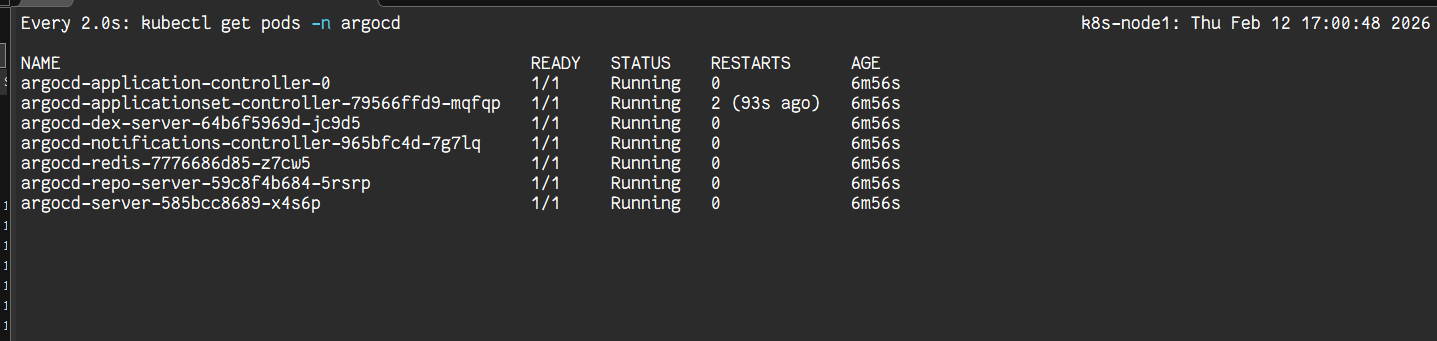
ctrl+c退出pods详细信息
3. 安装Prometheus
# 添加并更新Helm仓库
helm repo add prometheus-community https://prometheus-community.github.io/helm-charts
helm repo update

# 使用helm install完成初始安装
helm install prometheus-stack prometheus-community/kube-prometheus-stack \
--namespace monitoring \
--create-namespace \
--version 57.2.0 \
--set grafana.service.type=NodePort \
--set prometheus.service.type=NodePort \
--set alertmanager.service.type=NodePort
检查:
watch kubectl get pods -n monitoring所有的pods都应该是running
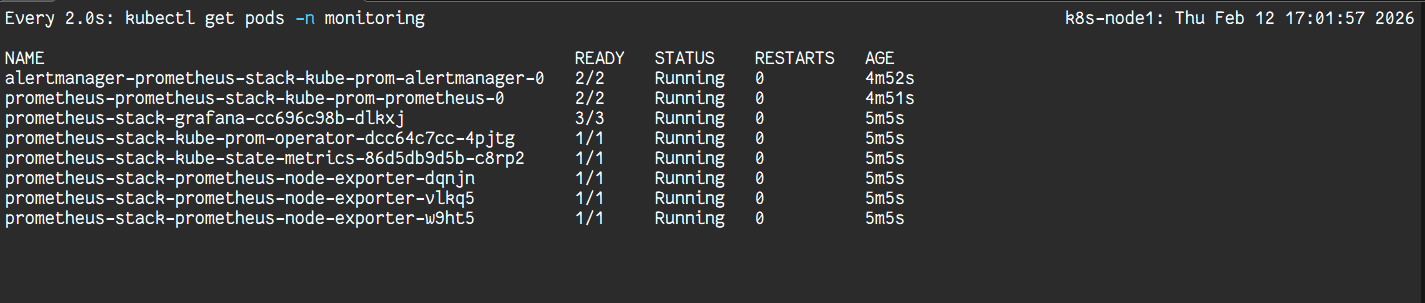
ctrl+c退出pods详细信息
4. 配置Argo CD
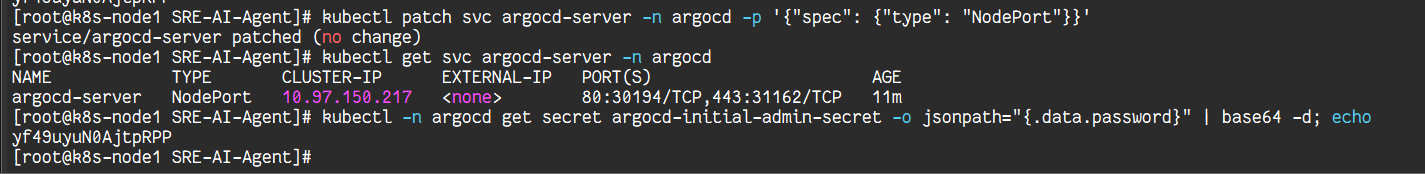
暴露Argo CD的服务端口及账号密码
kubectl patch svc argocd-server -n argocd -p '{"spec": {"type": "NodePort"}}'

kubectl get svc argocd-server -n argocd # 查看端口

kubectl -n argocd get secret argocd-initial-admin-secret -o jsonpath="{.data.password}" | base64 -d; echo
如图:
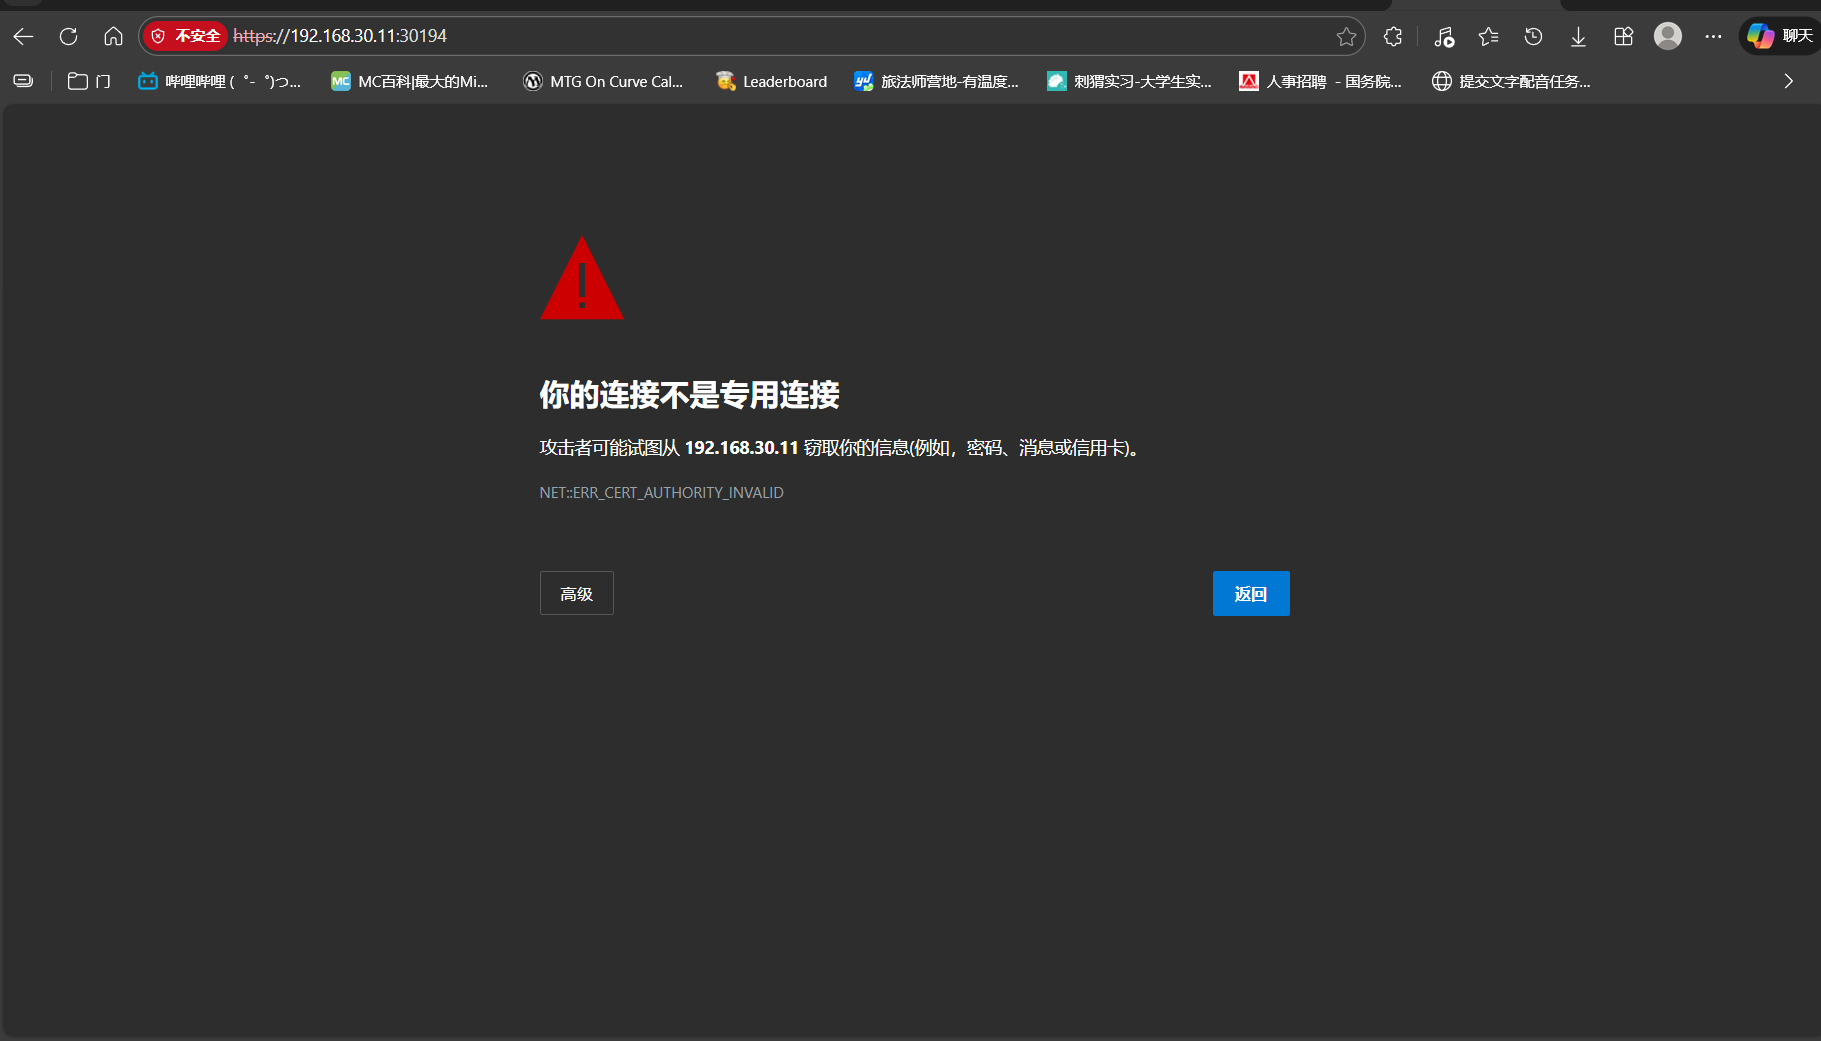
你应该能通过本地浏览器输入node1ip:暴露的端口号来访问argocd
如:我的node1ip是192.168.30.11 暴露的端口如图是 30194,选择继续访问就行
如图 输入账户和密码 账户是admin 密码是前文暴露的密钥
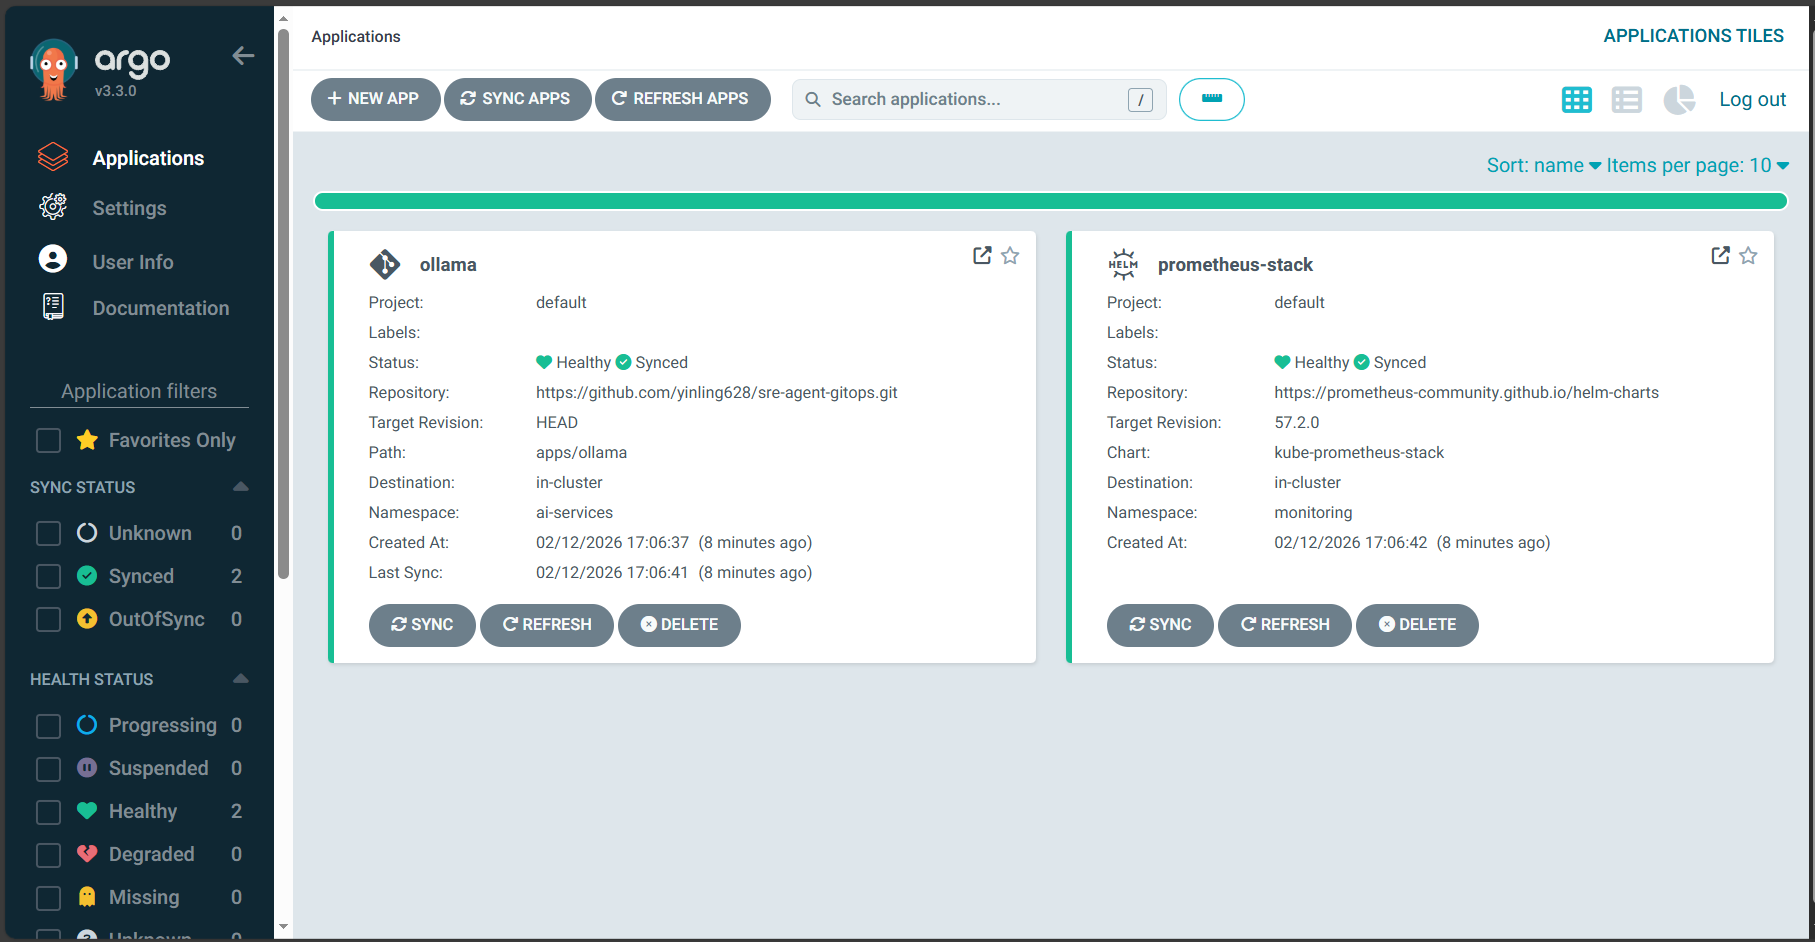
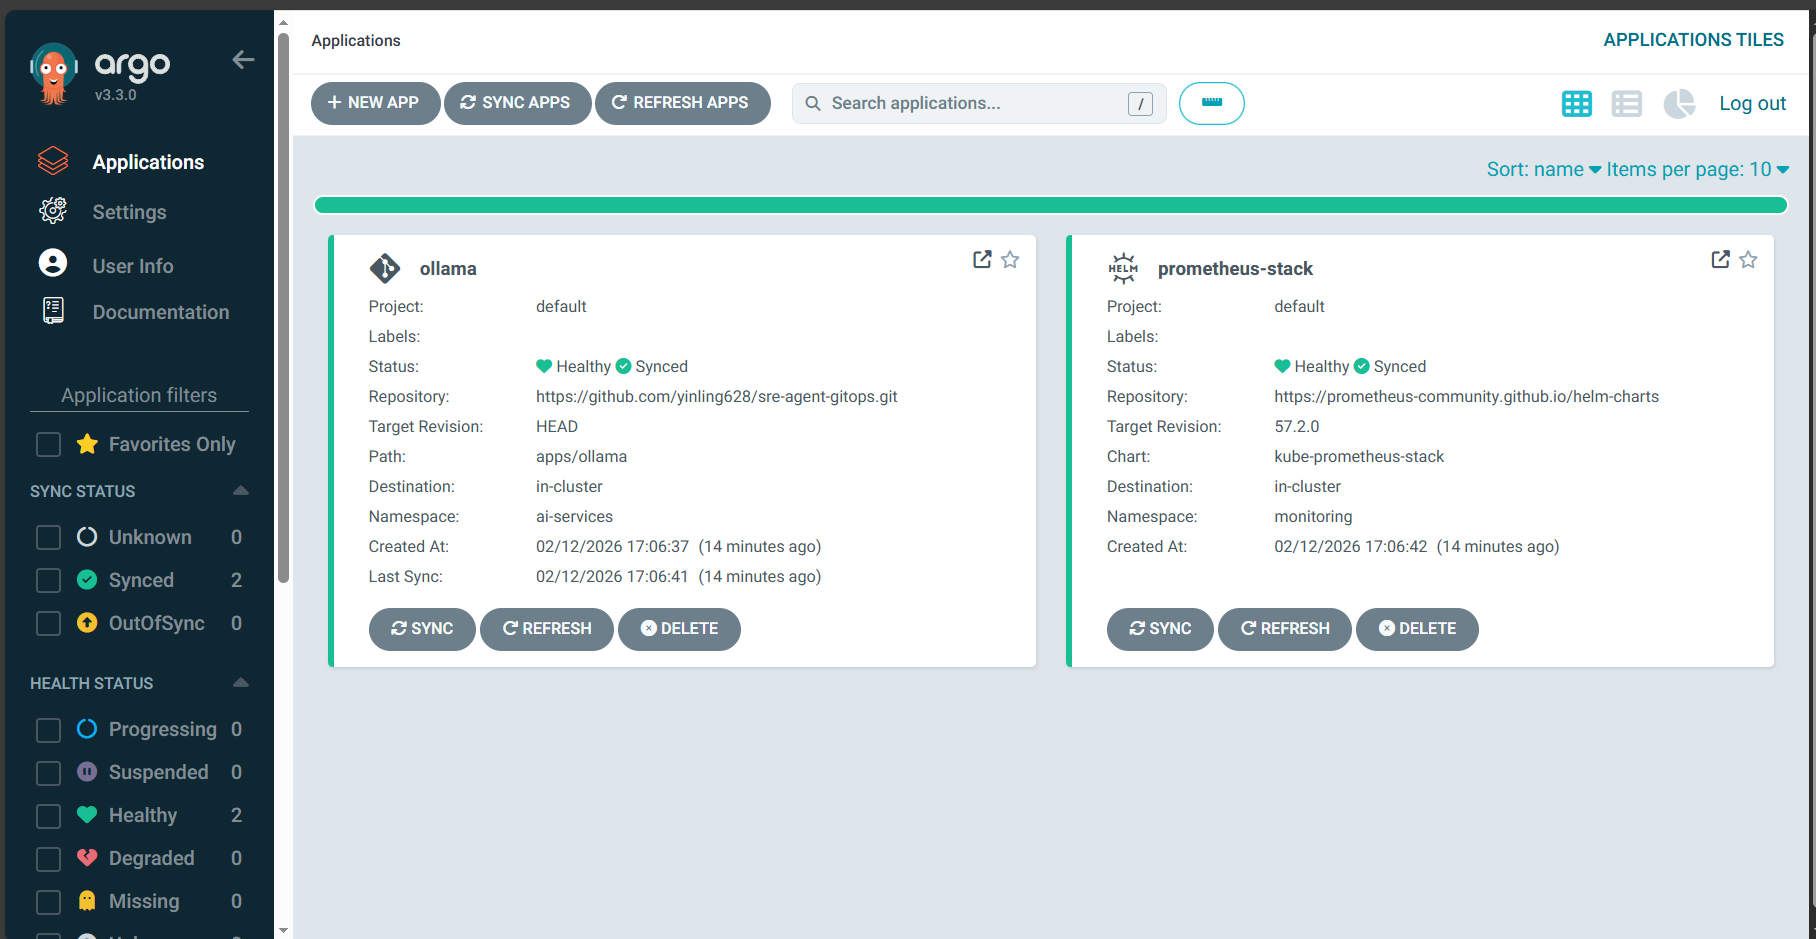
登录成功应该如图(此处是补截截图,正常应该没有下面的两个pod)
回到虚拟机,先cd到家目录
cd ~创建两个配置文件
(1)ollama-app.yaml
cat > ollama-app.yaml <<'EOF'
apiVersion: argoproj.io/v1alpha1
kind: Application
metadata:
  name: ollama
  namespace: argocd
spec:
  project: default
  source:
    repoURL: '你的链接'
    targetRevision: HEAD
    path: apps/ollama
  destination: { server: 'https://kubernetes.default.svc', namespace: ai-services }
  syncPolicy: { automated: { prune: true, selfHeal: true }, syncOptions: ["CreateNamespace=true"] }
EOF
(2)prometheus-app.yaml
cat > prometheus-app.yaml <<'EOF'
apiVersion: argoproj.io/v1alpha1
kind: Application
metadata:
  name: prometheus-stack
  namespace: argocd
  finalizers:
  - resources-finalizer.argocd.argocd.argoproj.io
spec:
  project: default
  destination:
    server: 'https://kubernetes.default.svc'
    namespace: monitoring
  syncPolicy:
    automated: { selfHeal: true } # 只开启自愈,不开启自动修剪
  source:
    repoURL: 'https://prometheus-community.github.io/helm-charts'
    chart: kube-prometheus-stack
    targetRevision: 57.2.0
    helm:
      # Argo CD会用这些values来比对,确保安装的状态一致
      values: |
        grafana:
          service:
            type: NodePort
        prometheus:
          service:
            type: NodePort
        alertmanager:
          service:
            type: NodePort
EOF
应用它们
kubectl apply -f ollama-app.yaml
kubectl apply -f prometheus-app.yaml
你应该能在刚刚打开的argocd页面看到两个pod
5. 配置Grafana和prometheus
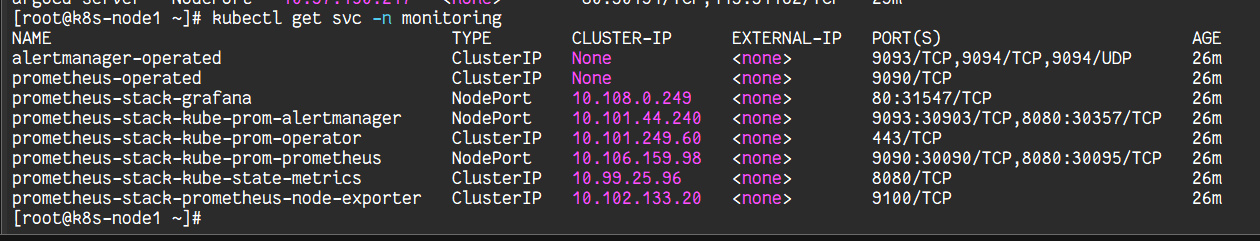
kubectl get svc -n monitoring 暴露Grafana 端口,如图,我的是31547
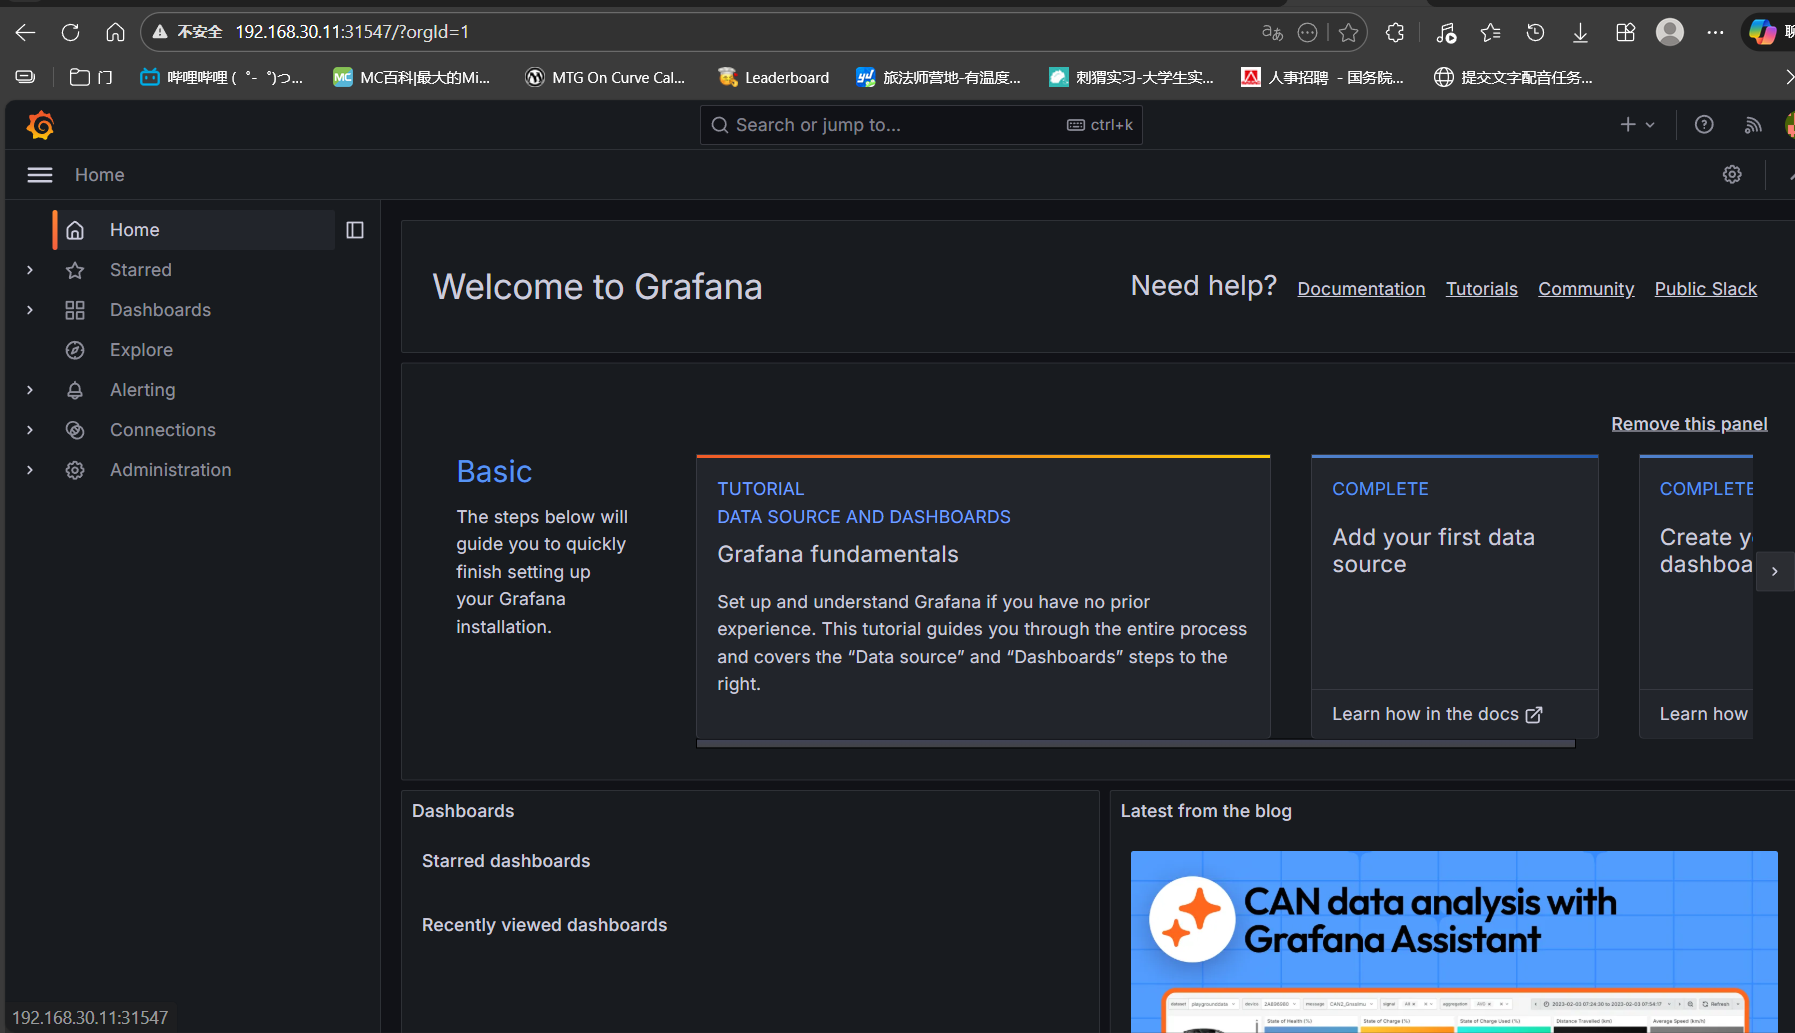
登录Grafana Grafana的默认用户名是admin 密码是prom-operator
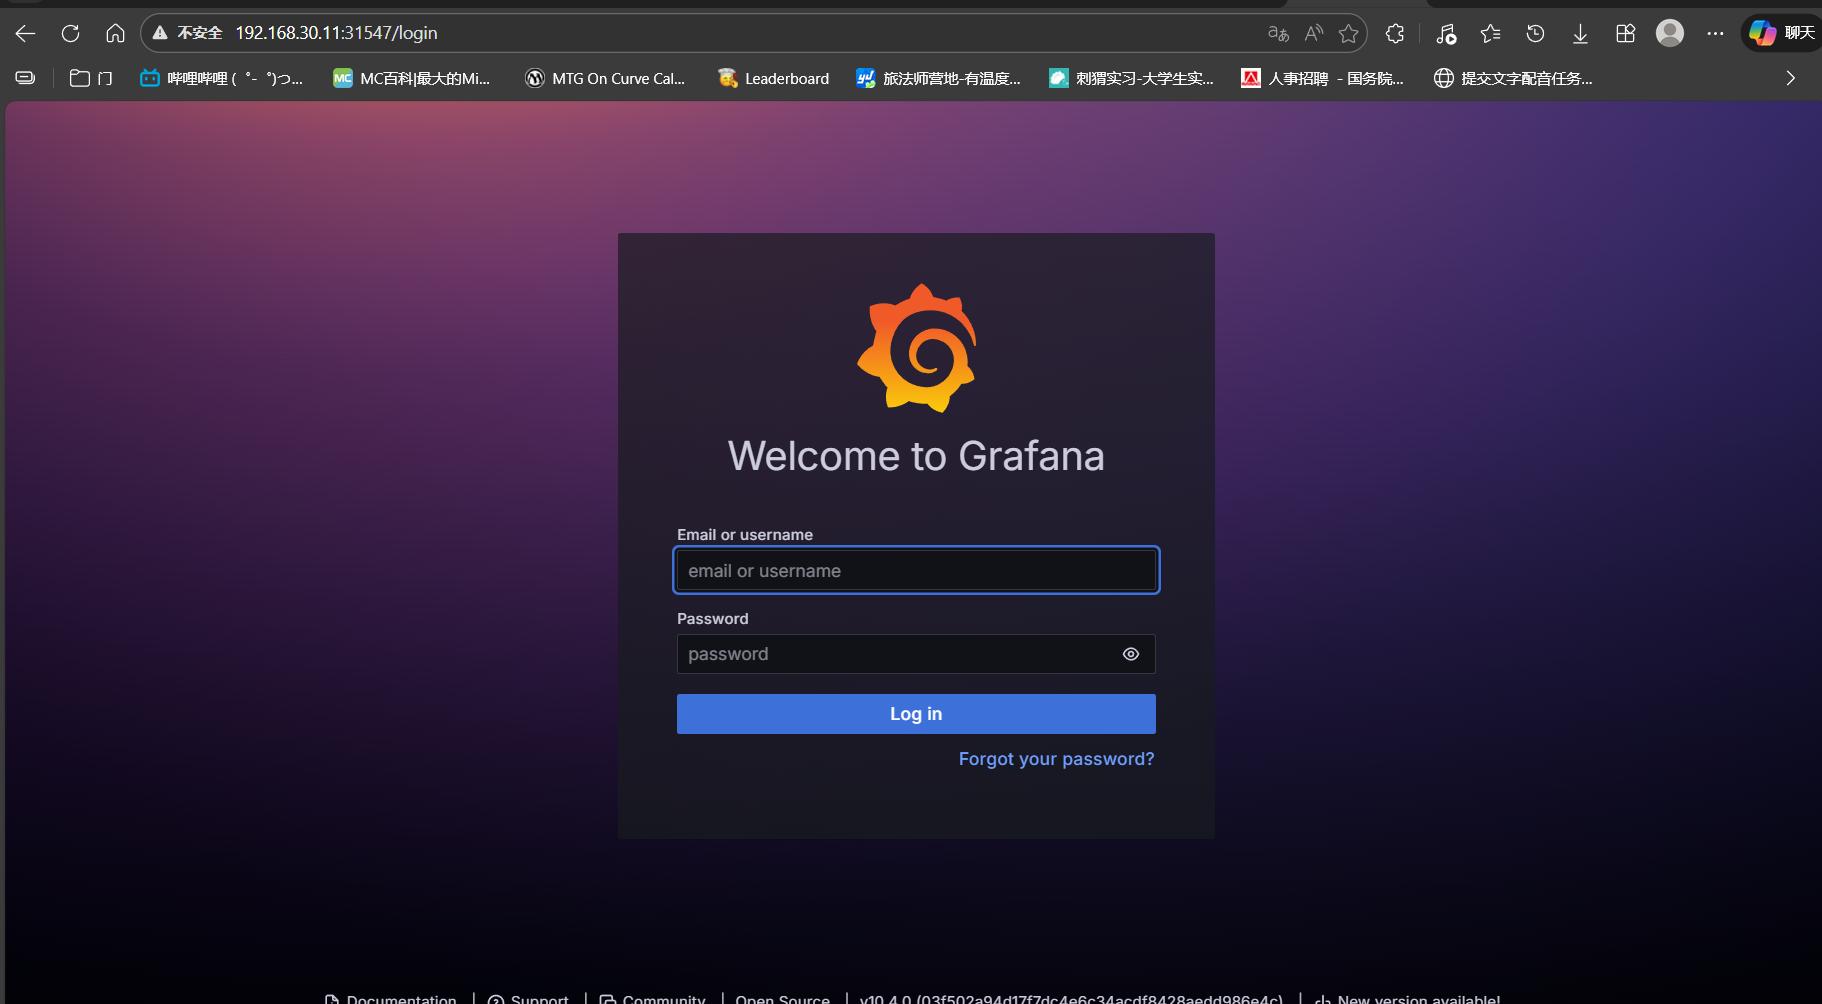
登录成功如图:
prometheus则有预配置的固定端口30090,如图
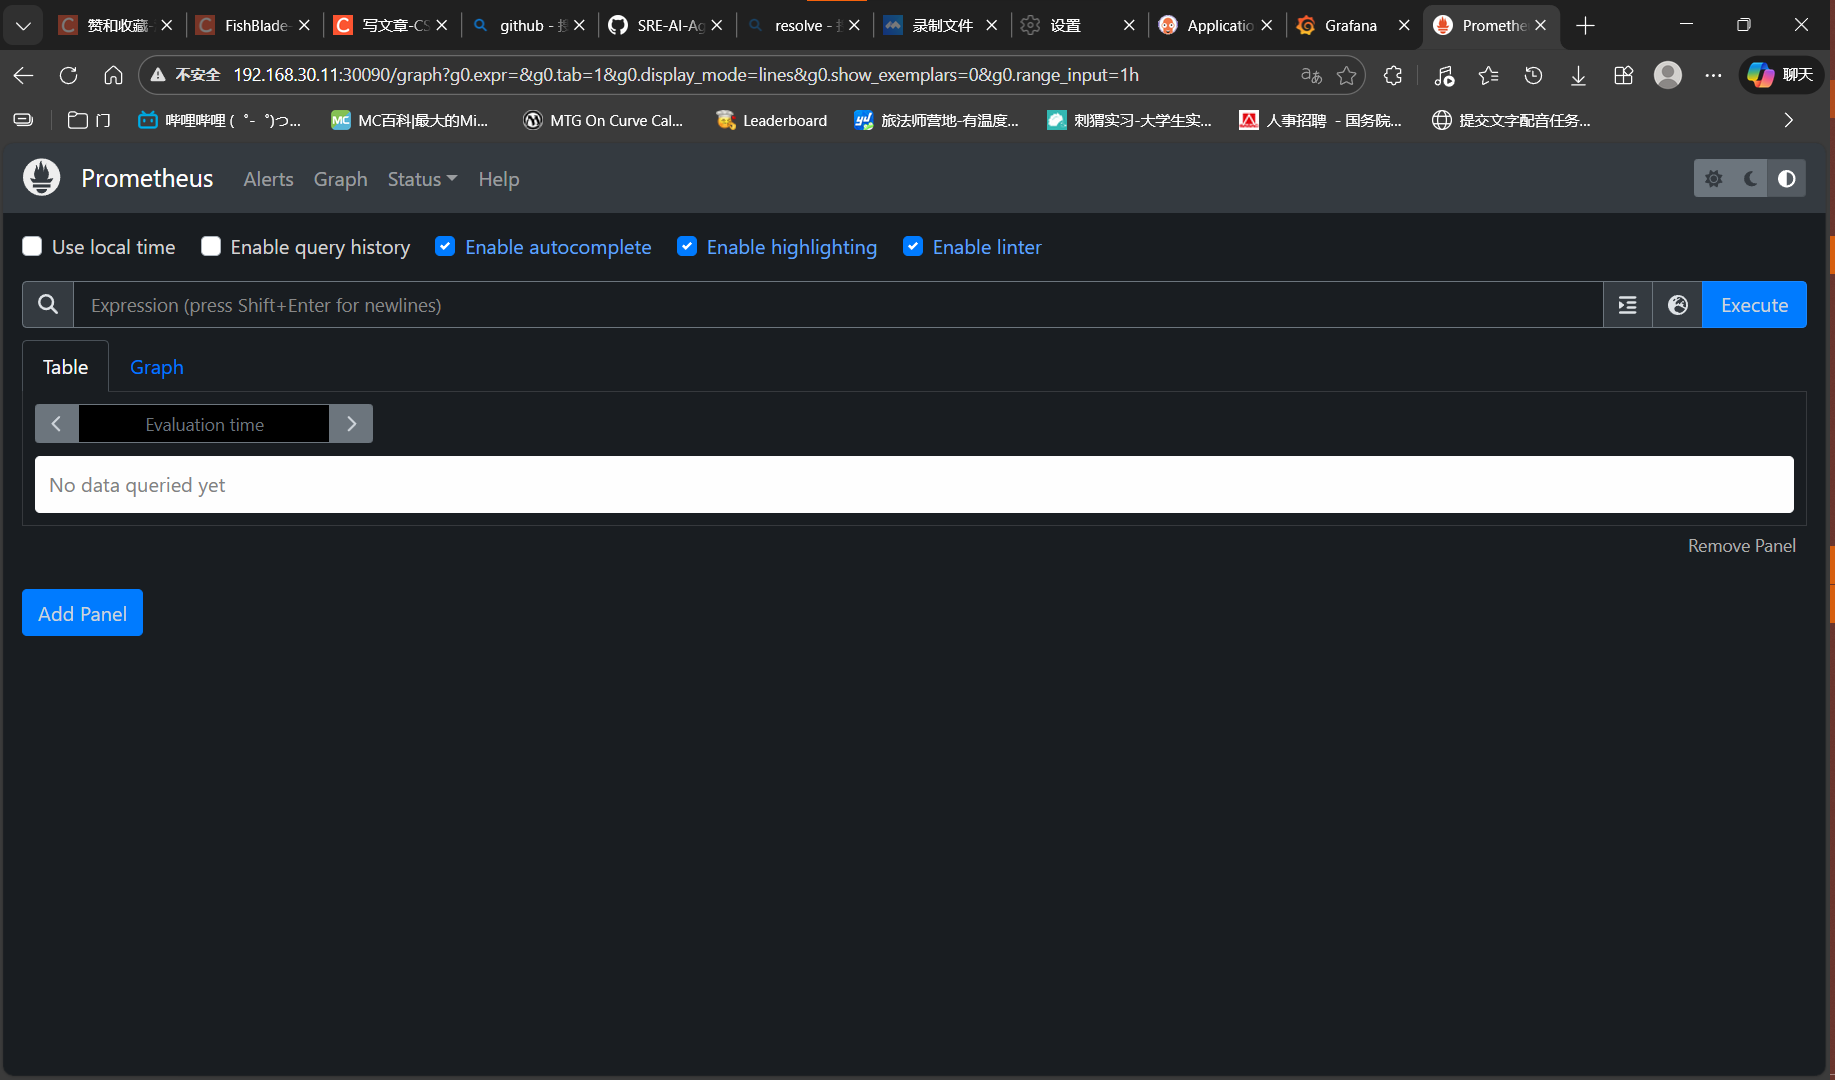
但是我们发现现在的Grafana和prometheus没有任何输入,这是因为我们没有导入适用的仪表盘
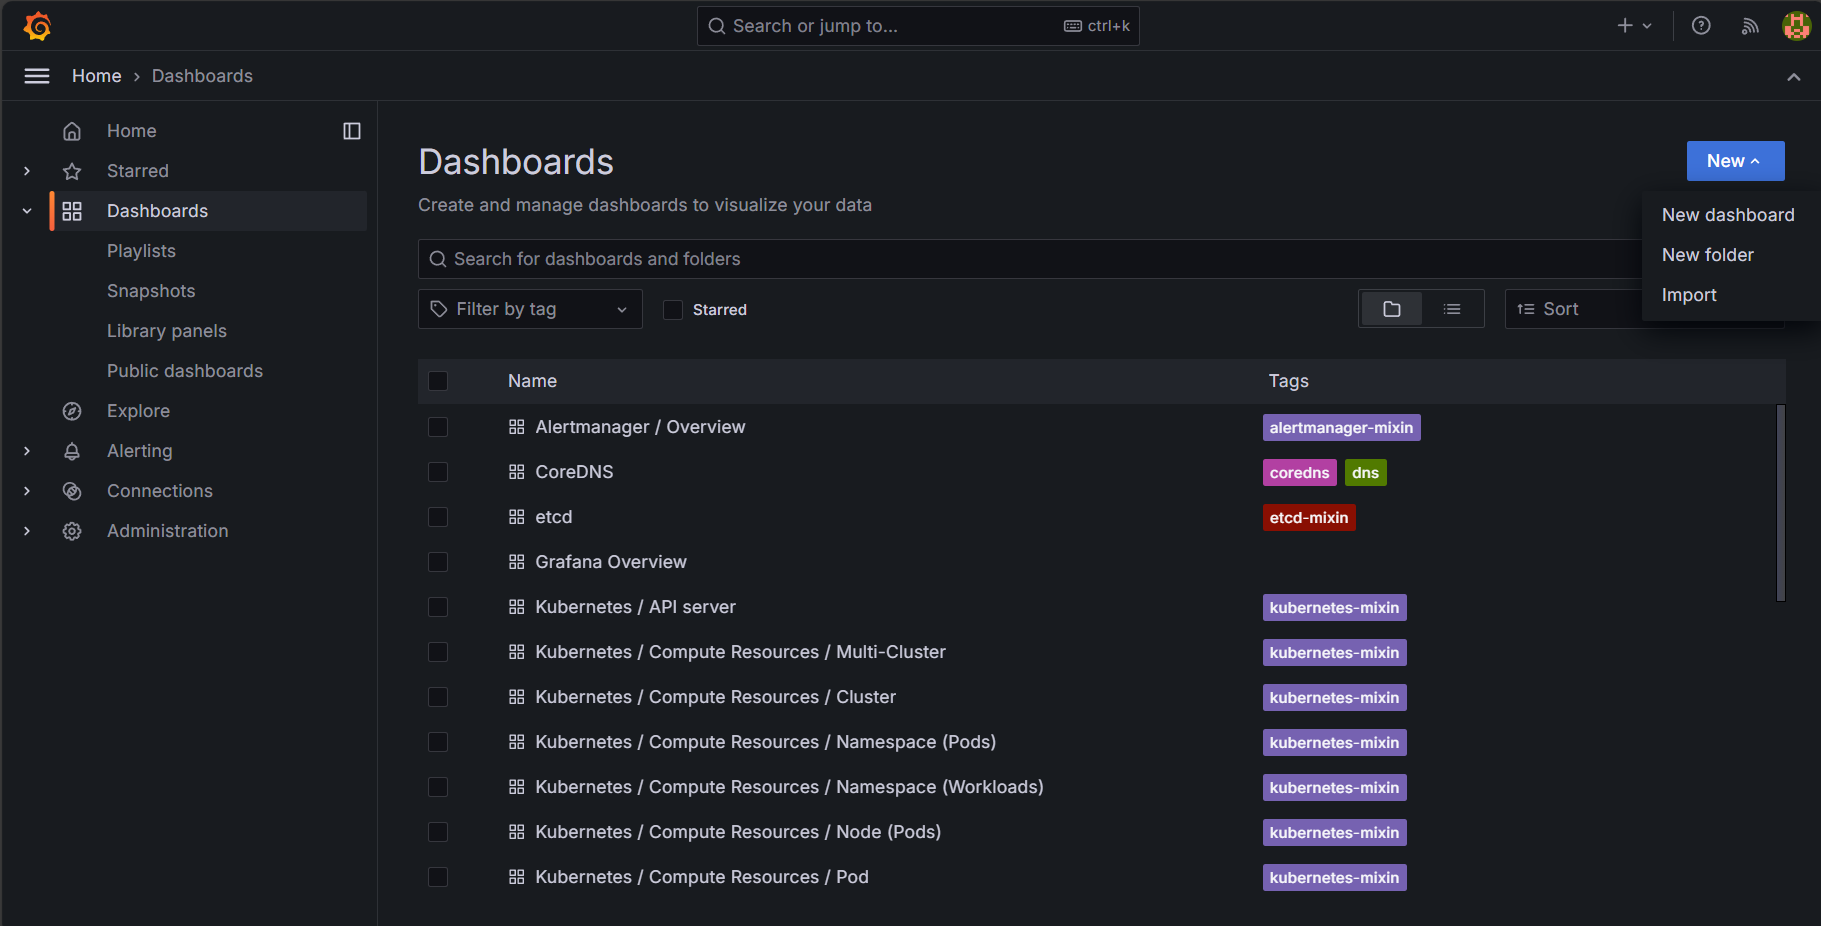
我们切换到Grafana页面,点击DashBoard,再点击右上角的new,选择import
点击中间蓝色的链接,打开Grafana官方的库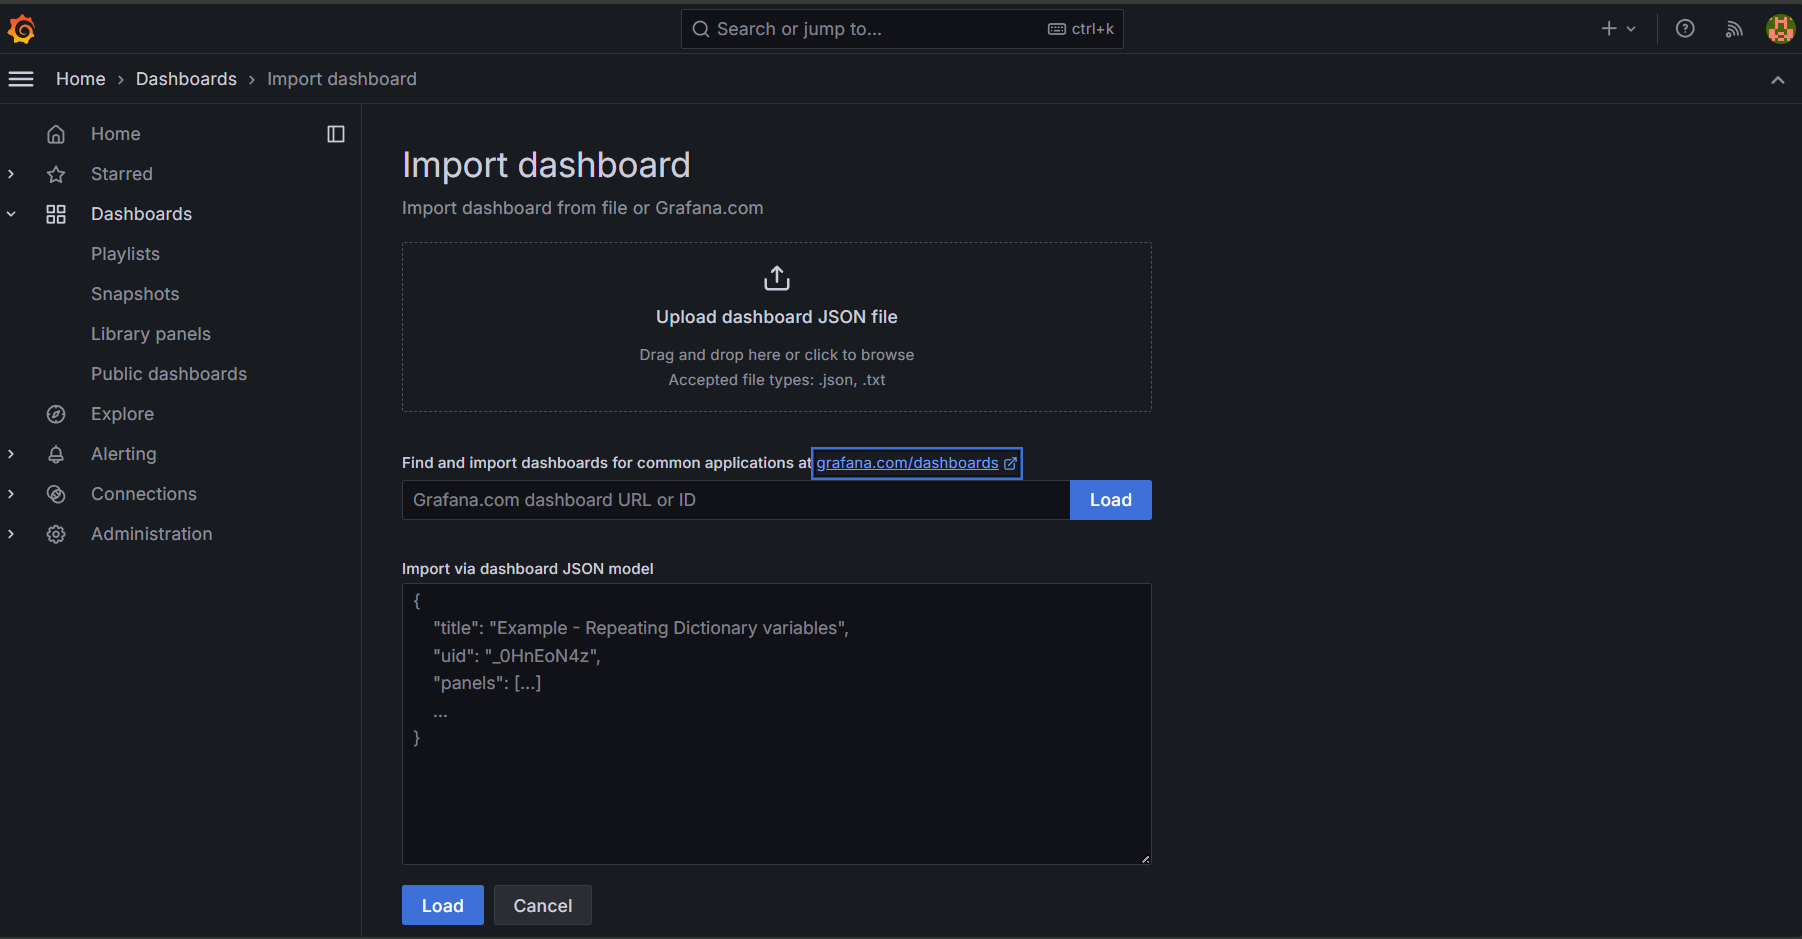
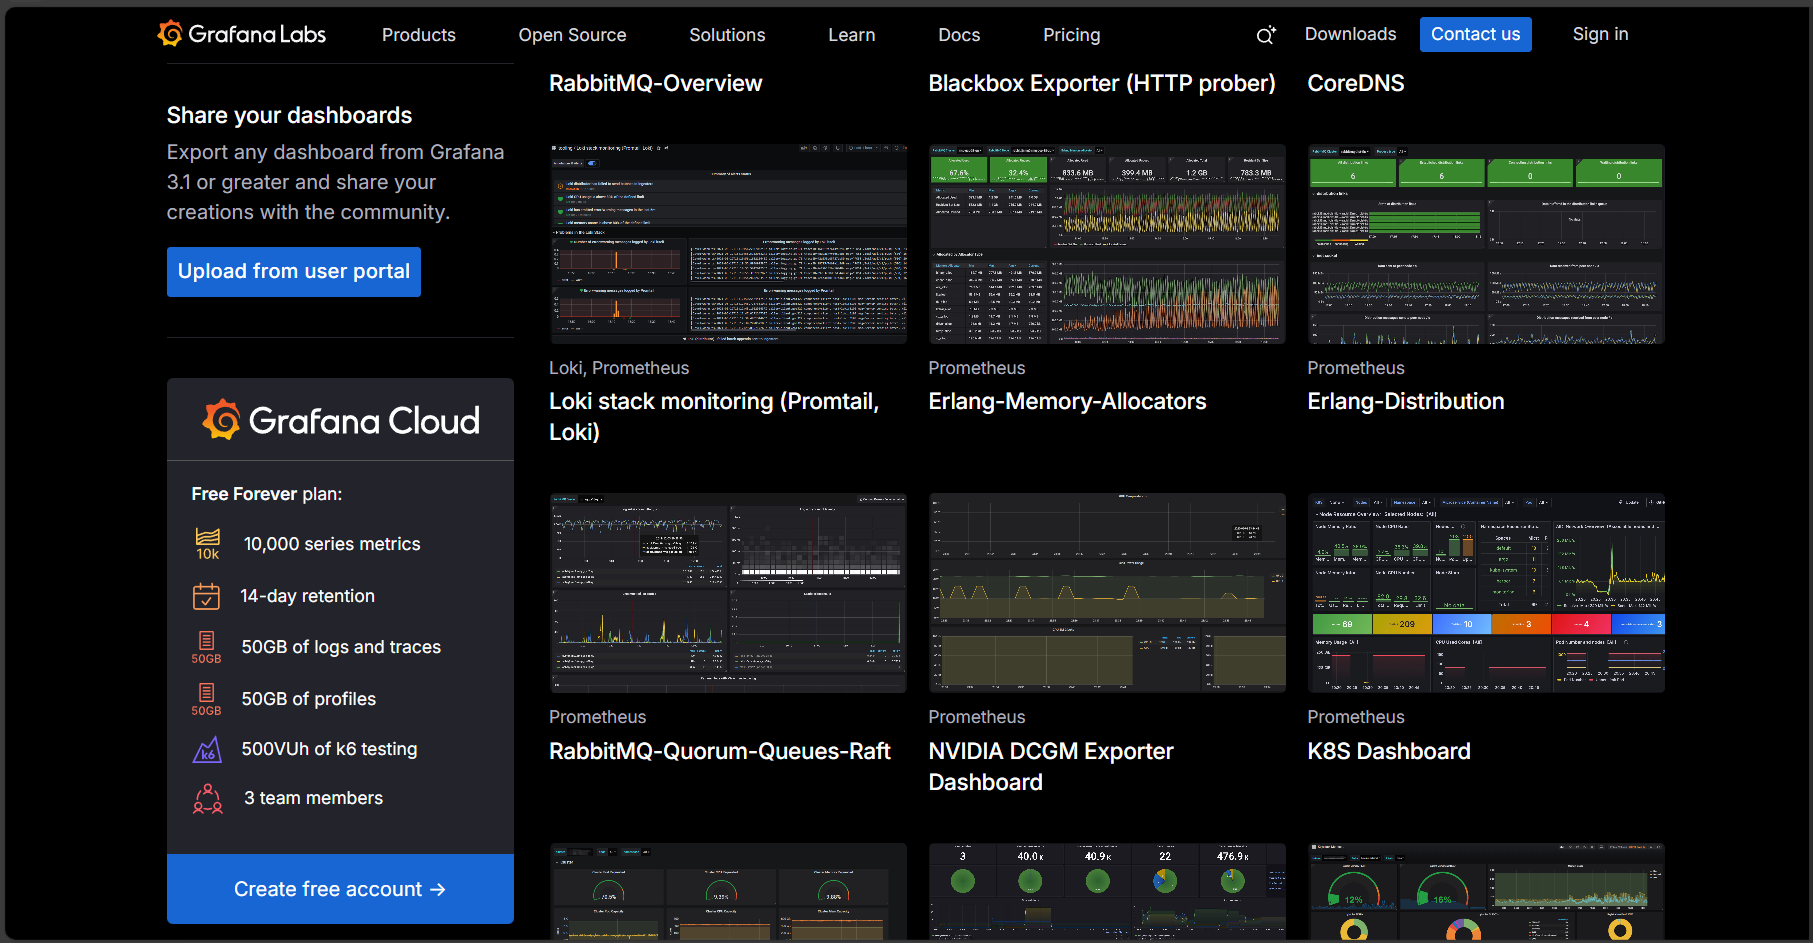
如图,选择一个仪表盘并点击,我选的是图中右下方的K8s Dashboard
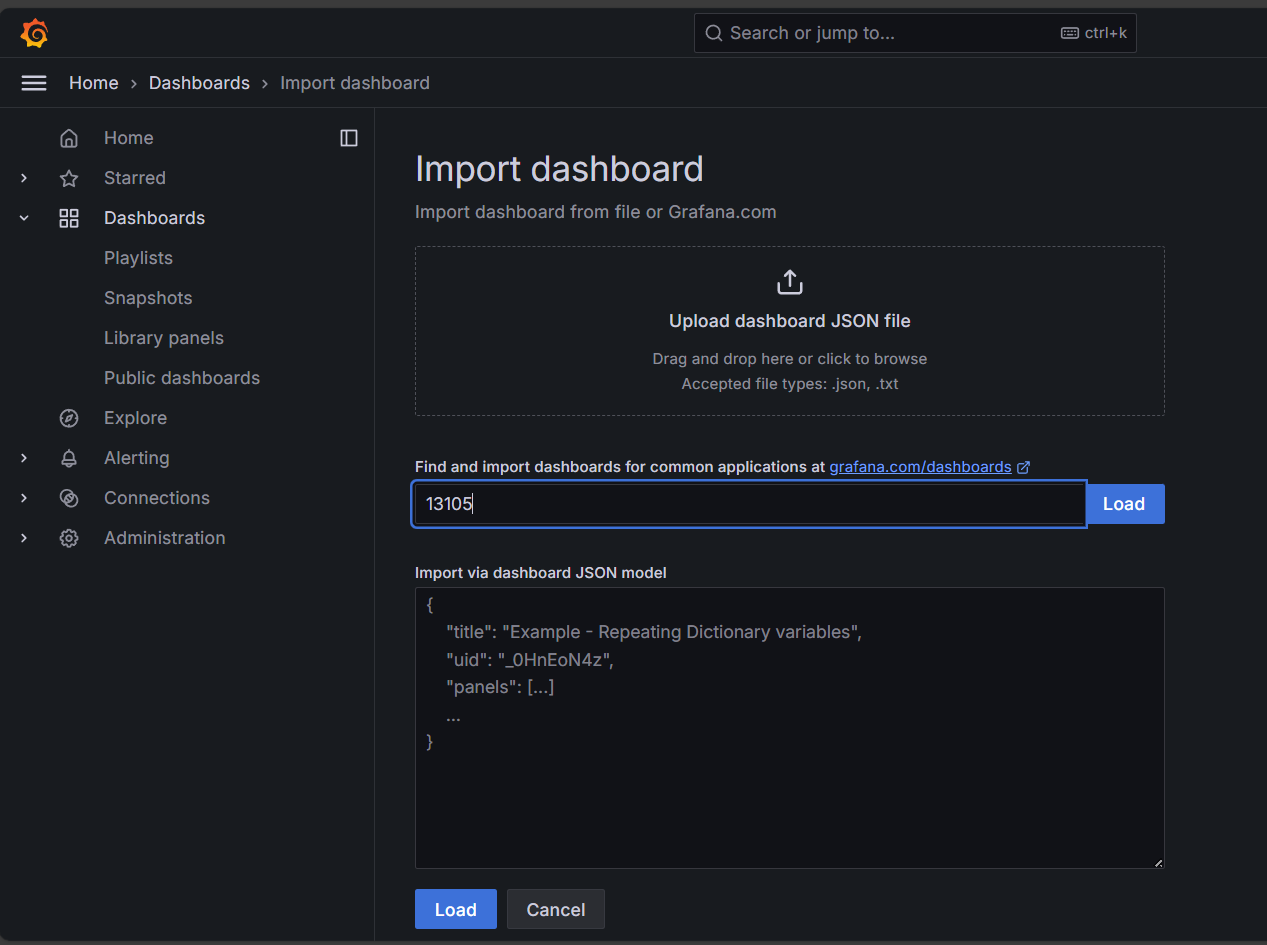
点击后向下滚动发现有个链接,我们只复制数值部分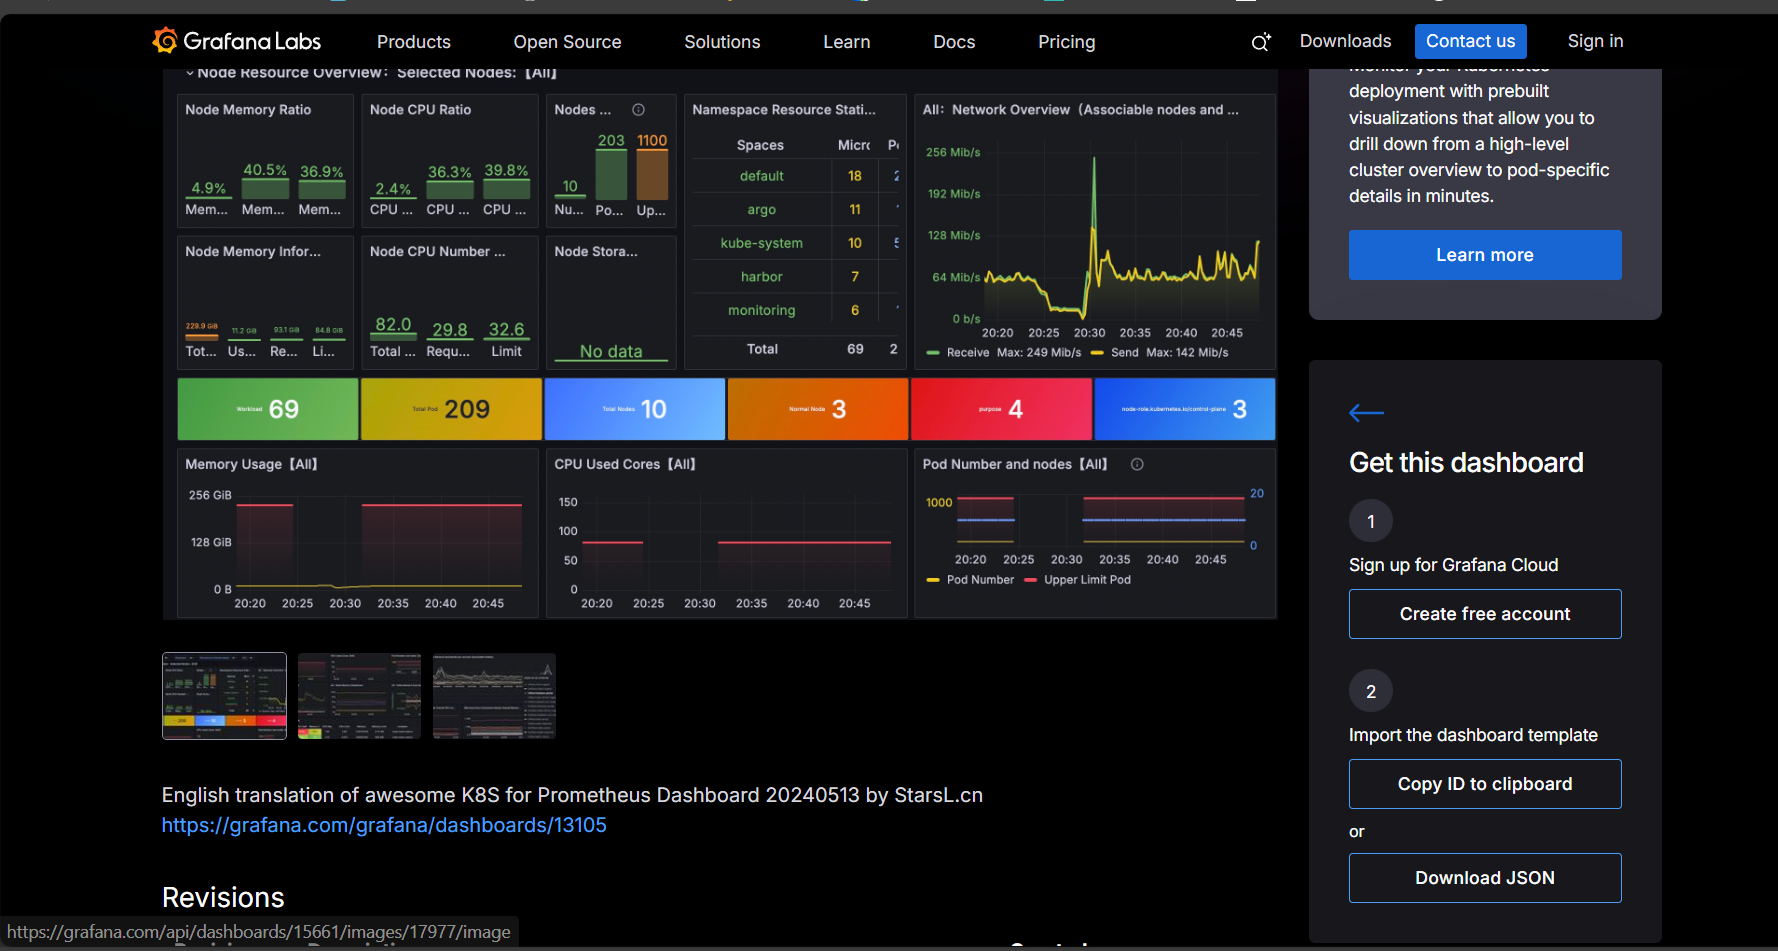 回到原本界面并粘贴,然后点击Load
发现没有选择数据源,选唯一的就行
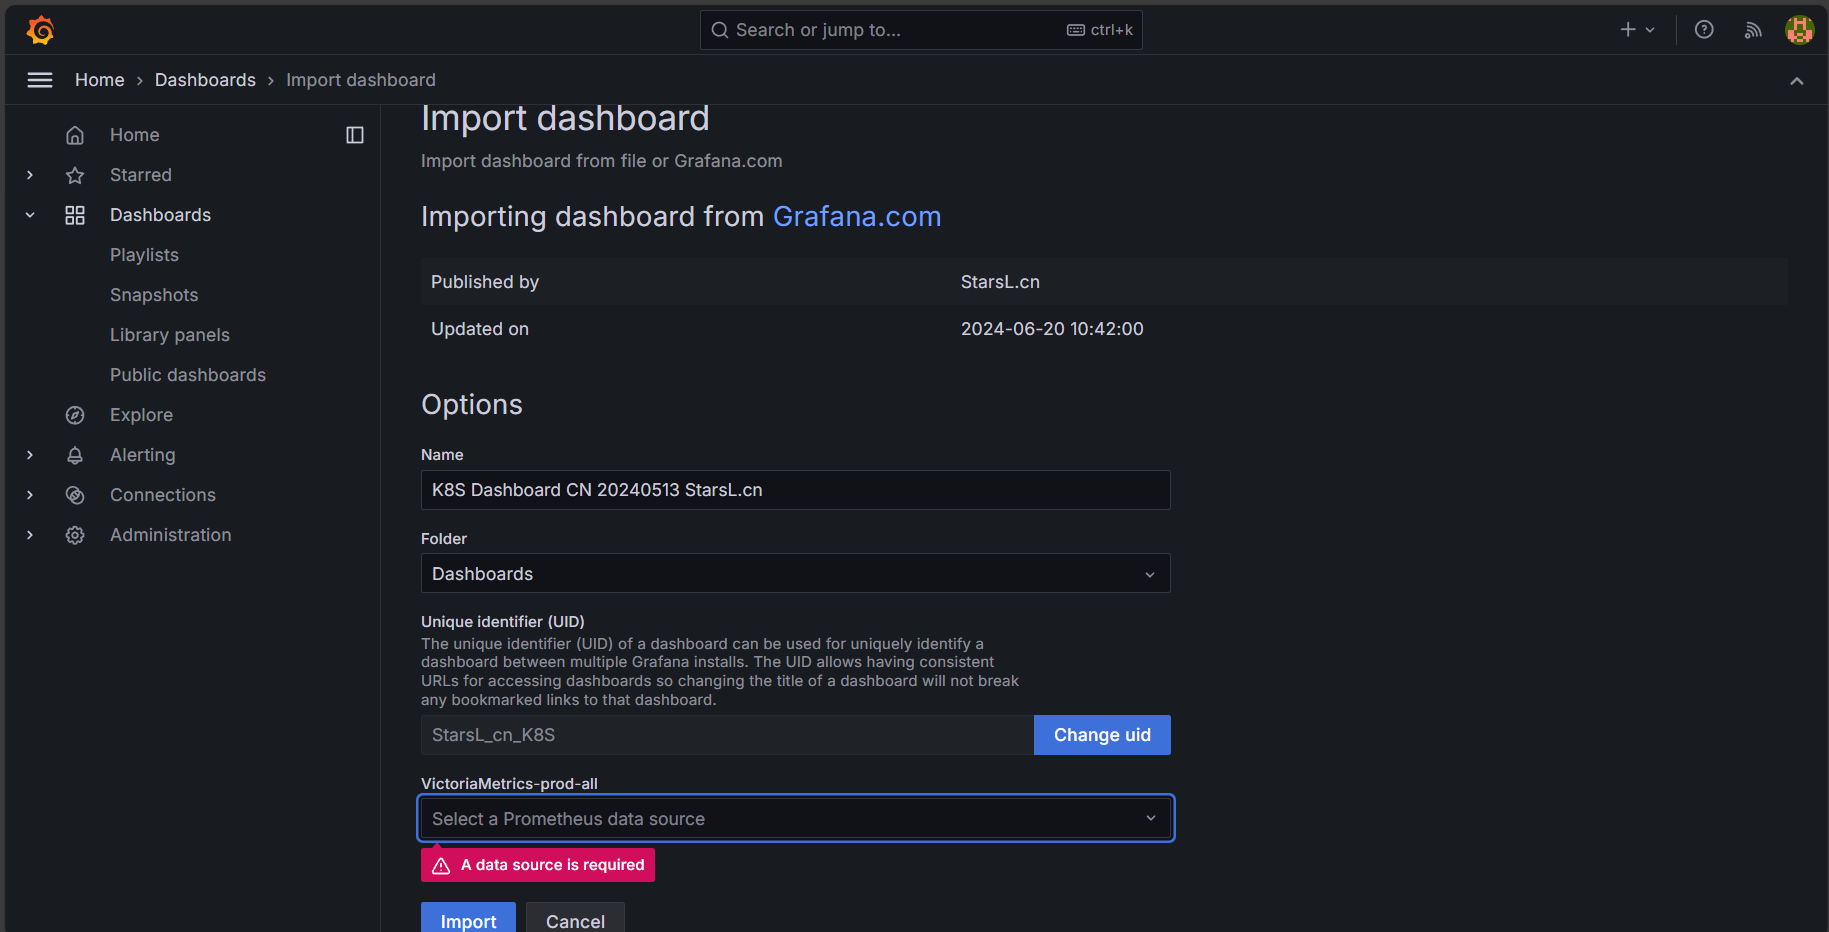
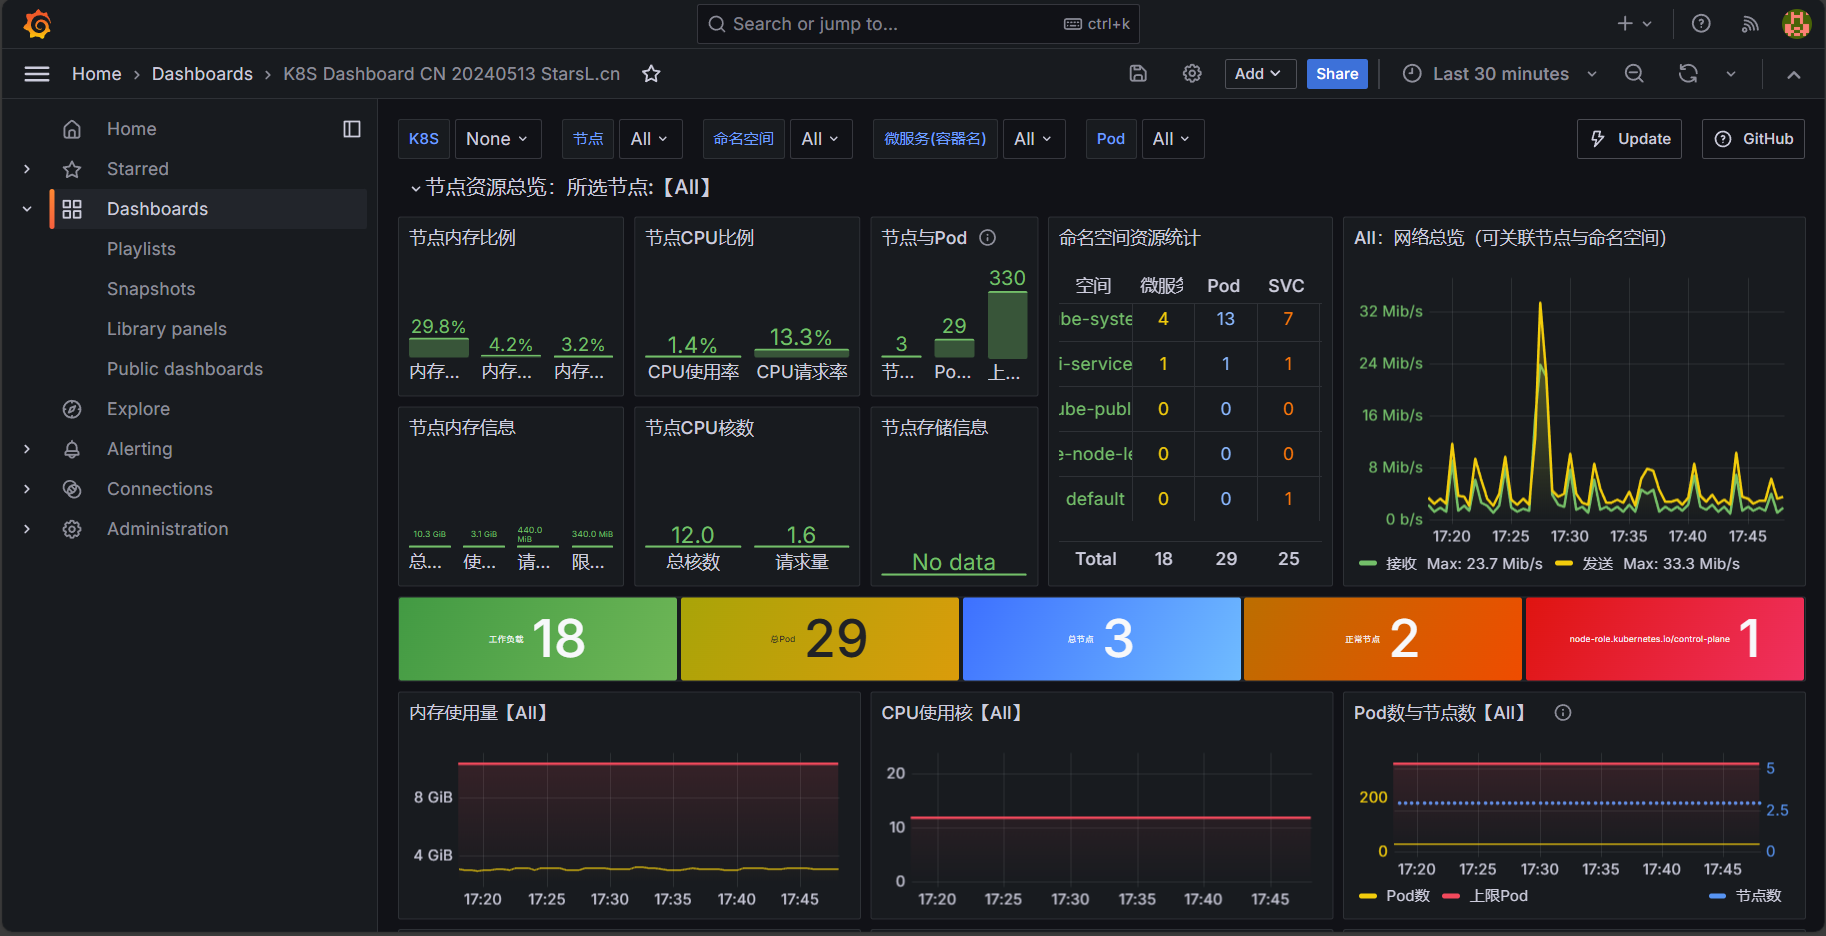
配置成功如图:

有“AI”的1024 = 2048,欢迎大家加入2048 AI社区
更多推荐
 21
21 0
0- 0


 已为社区贡献2条内容

所有评论(0)