【七万字长文】大模型开发必看:Go与Python在LangChain框架下的性能对决!
本文对Go与Python在LangChain框架下构建大语言模型应用进行了全面性能对比测试,涵盖核心LLM交互、RAG管道、Agent架构、并发处理和运营成本等多个维度。测试结果显示Go在几乎所有场景中表现更优,特别是在高并发、内存管理和资源密集型任务上优势明显。文章通过详细代码示例和测试数据,为开发者选择合适语言构建大模型应用提供了科学依据,是技术选型的重要参考。
基于 LangChain 的 Python 与 Go 系统性能对比 Retrieval、Agent 推理、并发、可扩展性等
Lovable,这家高速增长的 AI 公司,今年将其后端从 Python 迁移到 Go,将服务器使用和部署时间从约 15 分钟降至约 3 分钟。Go 正日益被视为现代 AI 系统的理想语言,从高吞吐的 RAG 管道到多工具的 Agent。
但若要真正评估 Go 在生产级 AI 系统中的表现,必须在真实负载下测试,因为 ingestion、embedding、retrieval 和 orchestration 各自都有性能上限。
Go vs Python Benchmarking(作者 Fareed Khan)
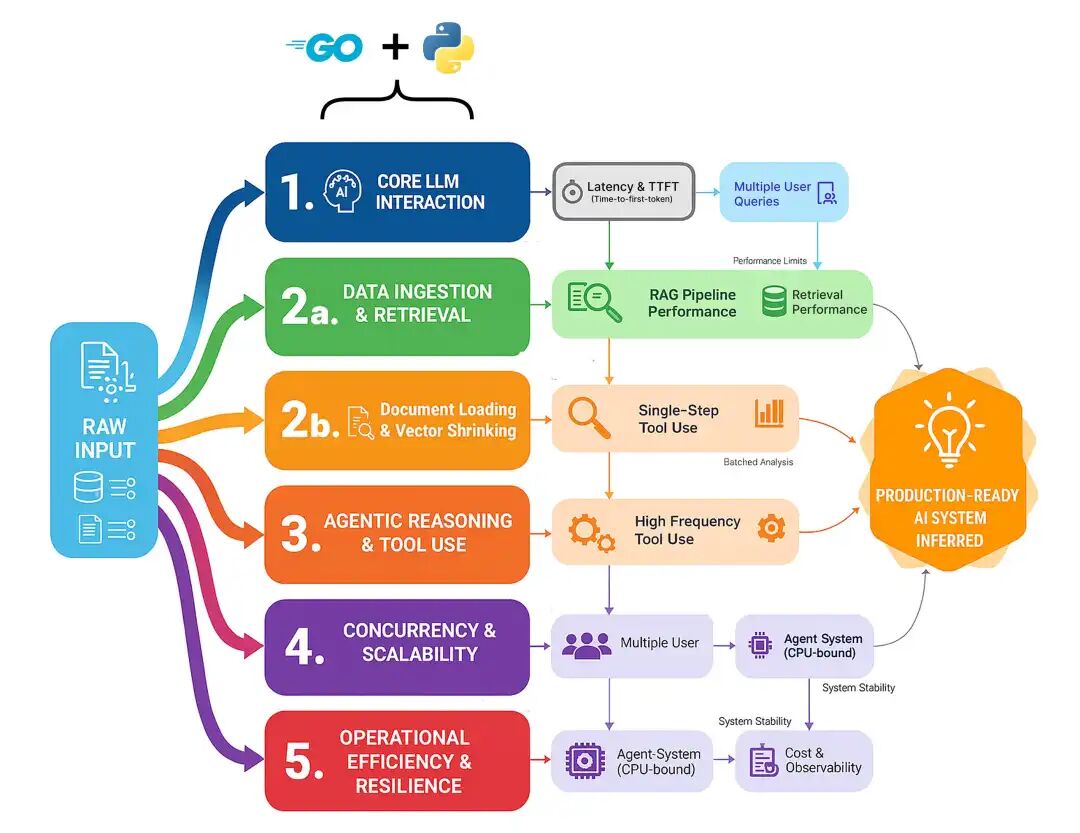
这些组件都是潜在瓶颈,编程语言的选择可能决定一个系统是停留在迟缓的原型,还是成长为可扩展、可生产的高可用平台。我们将全面测试,重点覆盖五大领域。
- 核心 LLM 交互:单次、原始模型调用有多快?这是所有功能的基石,任何框架在这里引入的开销都会在每个请求上重复支付。
- 数据摄取与检索:任何 RAG 系统的核心。我们将测量从原始文档切分到 chunk 的 embedding,再到在压力下的检索的完整管道。
- Agent 推理与工具使用:Agent “思考”的成本是什么?我们将测试单步、多跳和高频工具调用循环的开销。
- 并发与可扩展性:当 50 个用户同时访问服务时会发生什么?这测试了每种语言在不崩溃的情况下处理真实并行负载的能力。
- 运营效率与韧性:隐藏成本是什么?我们将衡量长时间运行的 Agent 的内存占用,以及加入必要可观测性后带来的性能损耗。
在这篇博客中,我们将逐一走通每种基准测试方法,理解 Go 与 Python 的策略差异,并看看为何 Go 往往表现更佳。
所有代码均在我的 GitHub 仓库:
GitHub - FareedKhan-dev/langchain-go-vs-python: Benchmarking RAG and agentic systems in Go vs…
代码库组织如下:
langchain-go-vs-python/ ├── agent_multi_hop/ │ ├── agent.go │ └── agent.py ├── concurrent_rag/ │ ├── rag.go │ └── rag.py ├── data_embedding_batching/ │ ├── embedding.go │ └── embedding.py ... ├── gpu_saturation/ │ ├── saturation.go │ └── saturation.py ├── ingestion_throughput/ │ ├── ingestion.go │ └── ingestion.py ... ├── resiliency_parsing_failure/ │ ├── parsing.go │ └── parsing.py └── workflow_transformation/ ├── transformation.go └── transformation.py
目录
- 目录
- 环境搭建
- 第一部分:核心 LLM 性能基准测试
- 单轮延迟测试
- Time-to-First-Token(TTFT)流式测试
- 第二部分:生产级 RAG 管道测试
- 大文档切分:CPU 受限任务
- 批量 Embedding:处理吞吐
- 完整摄取管道
- 检索延迟:信息能多快被找到?
- 端到端 RAG:整合验证
- 第三部分:Agentic 架构评估
- 简单 Agent:单次工具调用
- 多跳 Agent:串联多次工具调用
- 高频工具使用:测试 Agent 开销
- 工作流逻辑:数据转换与路由
- 第四部分:生产就绪的压力测试
- 并发 RAG 与 Agent 系统:应对真实负载
- GPU 饱和:将模型服务推向极限
- 处理超时、工具失败与解析错误
- 第五部分:衡量真实运营成本
- 内存占用:长会话对话
- 可观测性开销:Tracing 的成本
环境搭建
开始基准测试前,我们需要先搭建测试环境。为公平比较 Go 与 Python,二者必须使用完全相同的后端服务。
我们的环境由三部分组成:
- 本地 LLM Server(Ollama):用于运行我们的
llama3:8b模型。 - 本地向量数据库(ChromaDB):为 RAG 管道存储和管理 embedding。
- Go 与 Python 项目代码:我们将编写并运行的自定义 Go 与 Python 脚本。
首先访问 Ollama 官网,下载适合你操作系统(macOS、Linux 或 Windows)的应用。安装过程非常简单,一键即可。
Ollama 启动后,打开终端拉取 llama3:8b 模型。该模型非常适合本地测试,速度与推理能力均衡。
# Downlaod 8B llama (you can choose anyother model ollama supported)ollama pull llama3:8b
为确认一切正常,可直接在终端运行模型:
# Testing ollama running serverollama run llama3:8b "Why is the sky blue?"##### OUTPUT ####The color of sky is ....
你应能看到模型开始生成回复。对于 RAG 管道基准,我们需要一个向量数据库来存储文档 embedding。我们使用 ChromaDB,你也可以选用其他数据库,但本文使用它做本地 embedding 存储。最简单的方式是用 Docker 运行。
我们需要创建一个简单的 docker-compose.yml 文件。请确保你本地已安装 Docker。
version: '3.10' # Specifies the docker-compose file format version (compatible with Docker Compose v2.x+)services:chroma:# Defines a service named "chroma" image:chromadb/chroma# Uses the official ChromaDB Docker image from Docker Hub ports: -"8000:8000"# Maps port 8000 on the host to port 8000 inside the container volumes: -chroma_data:/chroma/.chroma/# Mounts a named volume for persistent Chroma data storagevolumes:chroma_data:# Declares a named volume to persist data outside the container lifecycle
该配置做了两件事:拉取官方的 chromadb/chroma 镜像并启动容器,让它在 localhost:8000 可用;同时创建名为 chroma_data 的 Docker 卷,以确保即便容器停止或重启,向量数据库也能持久化。
启动服务时,在终端进入克隆后的仓库根目录并运行:
# Composing docker containerdocker-compose up -d
最后,你还需要在本地安装 Go。可在官方站点下载,过程同样简单。
我们的每个基准目录(例如 agent_single_tool、concurrent_rag)都是独立的 Go module。
你会注意到每个目录中都有一个 go.mod 文件。它是 Go module 的核心;可类比 Python 的 requirements.txt 或 Node.js 的 package.json。
如下是仓库中一个全新 go.mod 的示例:
module agent_single_tool // Declares the module name (import path) for your Go projectgo 1.22.0 // Specifies the Go version the module is intended to be built with
它只声明了模块名和 Go 版本。我们用 go mod tidy 来安装依赖。
在 Python 生态中,LangChain、LangGraph 和 LangSmith 已经演进为一个完整生态。在 Go 中,这仍处早期阶段。好在已有一个 LangChainGo 实现可以作为 module 使用。
这意味着我们不必事事从零开始,只在必要处自行编码,其余可借助该实现来构建 Go 版本方案。
第一部分:核心 LLM 性能基准测试
在构建复杂的 RAG 管道或 agentic 系统之前,我们必须从最基础的部分开始,也就是与大型语言模型(LLM)进行单次交互的原始速度。
我们构建的每一个高级功能都建立在这一核心操作之上。如果这一层很慢,整个系统就会很慢。
LLM Core benchmark(作者 Fareed Khan)
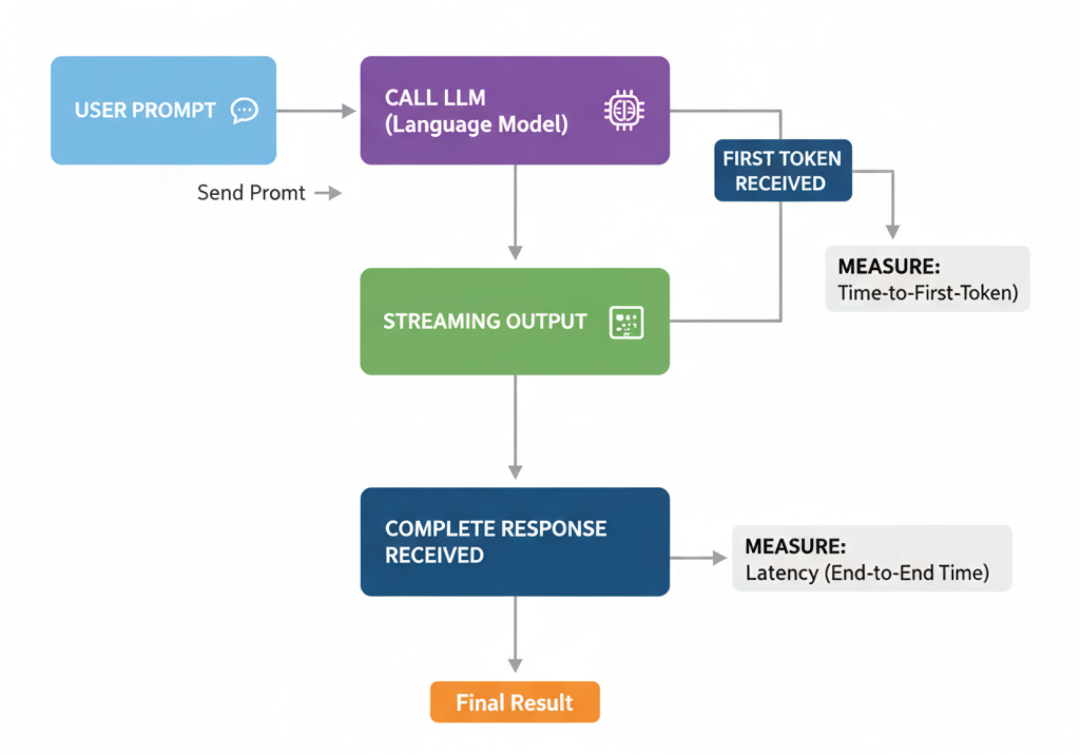
本部分我们将测量两个最基本的性能指标:
- 完整回答所需时间(latency)。
- 模型开始“说话”的速度(Time-to-First-Token,TTFT)。
这能为我们提供一个起点,展示各框架额外引入的开销。
这份完整版的大模型 AI 学习和面试资料已经上传CSDN,朋友们如果需要可以微信扫描下方CSDN官方认证二维码免费领取【保证100%免费】
单轮延迟测试
与 LLM 的最基础交互是简单的单轮补全。这就像问聊天机器人一个问题并等待完整答案。它也常用于分类、数据抽取或简易问答等任务。
通过测量它,我们可以了解各框架的原始开销:有多少时间花在框架逻辑上,而非实际的 LLM 推理?
Single turn latency(作者 Fareed Khan)
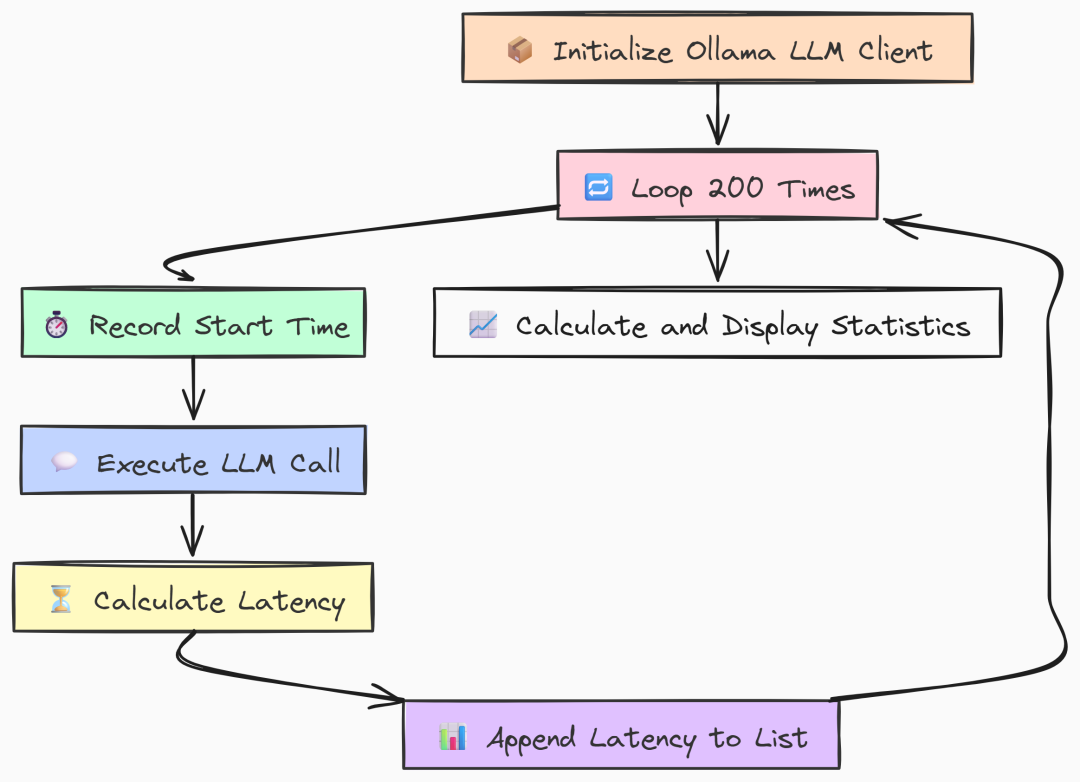
我们先编写 Go 版本。构建一个简单基准:只初始化一次 Ollama client,然后在循环中用相同 prompt 调用 LLM 200 次,测量每次耗时。
package mainimport ("context""fmt""log""time""github.com/tmc/langchaingo/llms""github.com/tmc/langchaingo/llms/ollama")// --- Configuration ---const ( numIterations = 200 modelName = "llama3:8b" prompt = "Why is the sky blue?")funcmain() { fmt.Println("--- LangChainGo: Single-Turn Completion Latency Test (200 Iterations) ---")// 1. Initialize the Ollama LLM client.// This is created once and reused, which is standard practice. llm, err := ollama.New(ollama.WithModel(modelName))if err != nil { log.Fatalf("Failed to create Ollama client: %v", err) } latencies := make([]time.Duration, 0, numIterations) ctx := context.Background()// 3. Start the main benchmark loop.for i := 0; i < numIterations; i++ { start := time.Now()// 4. Execute the LLM call. This is a blocking call.// The framework handles HTTP request creation, sending, and JSON parsing. _, err := llms.GenerateFromSinglePrompt(ctx, llm, prompt)if err != nil { log.Printf("Warning: Iteration %d failed: %v\n", i+1, err) continue } latency := time.Since(start) latencies = append(latencies, latency) fmt.Printf("Iteration %d: %v\n", i+1, latency) }// 6. After all iterations, calculate and display the final statistics. fmt.Println("\n--- LangChainGo Benchmark Results ---") calculateAndPrintStats(latencies)}
在 main 中我们首先初始化一次 ollama.New client。将其置于循环外以模拟真实应用。
基准的核心是运行 200 次的 for 循环。每次记录开始时间,调用 llms.GenerateFromSinglePrompt 执行主操作,再计算延迟。
这个函数封装了完整的请求-响应周期:
- 框架构造 HTTP 请求;
- 发送给 Ollama server;
- 等待完整响应并解析。我们正是要测量这段时间。
接着看 Python 等效实现。结构非常相似,我们用 langchain_community 连接 Ollama,并用 numpy 做统计。
import timeimport numpy as npfrom langchain_community.llms import Ollama# --- Configuration ---NUM_ITERATIONS = 200MODEL_NAME = "llama3:8b"PROMPT = "Why is the sky blue?"defmain(): """Main function to run the benchmark.""" print("--- LangChain Python: Single-Turn Completion Latency Test (200 Iterations) ---") # 1. Initialize the Ollama LLM client. llm = Ollama(model=MODEL_NAME) latencies = [] # 3. Start the main benchmark loop. for i inrange(NUM_ITERATIONS): start_time = time.perf_counter() # 4. Execute the LLM call using the modern `.invoke()` method. llm.invoke(PROMPT) end_time = time.perf_counter() latency = end_time - start_time latencies.append(latency) print(f"Iteration {i + 1}: {latency:.4f}s") # 6. Calculate and display statistics. print("\n--- LangChain Python Benchmark Results ---") calculate_and_print_stats(latencies)
与 Go 一样,Python 的 main 也只初始化一次 Ollama client。循环使用 .invoke() 进行标准的同步 LLM 调用,并用 time.perf_counter() 高精度计时。
运行两种基准:
# running go veriongo run latency.go# running python versionpython latency.py
``````plaintext
--- LangChainGo Benchmark Results ---Total Iterations: 200Total Time:       199.85sMin Latency:      980.1msMax Latency:      1.15sAverage Latency:  999.2msStd Deviation:    28.5ms--- LangChain Python Benchmark Results ---Total Iterations: 200Total Time:       238.1512sMin Latency:      1152.34msMax Latency:      1.48sAverage Latency:  1190.76msStd Deviation:    89.31ms
在 200 次请求下差异明显。LangChainGo 稳定更快,平均延迟为 999.2ms,而 Python 为 1190.76ms。
这意味着在最基础操作上就有约 19% 的性能提升。
标准差也表明 Go 的波动更小(28.5ms vs 89.31ms)。
原因在于 Go 以二进制运行,几乎没有启动或解释开销;而 Python 每次都会引入些许延迟,累计效应明显。
Time-to-First-Token(TTFT)流式测试
在构建用户应用(如聊天机器人)时,总延迟并非唯一重要指标。
真正影响体验的是用户看到第一个响应的速度。
TTFT(作者 Fareed Khan)
TTFT 度量的是首个输出 token 的出现时间。TTFT 越低,应用感觉越“跟手”,即便完整回复仍需时间。
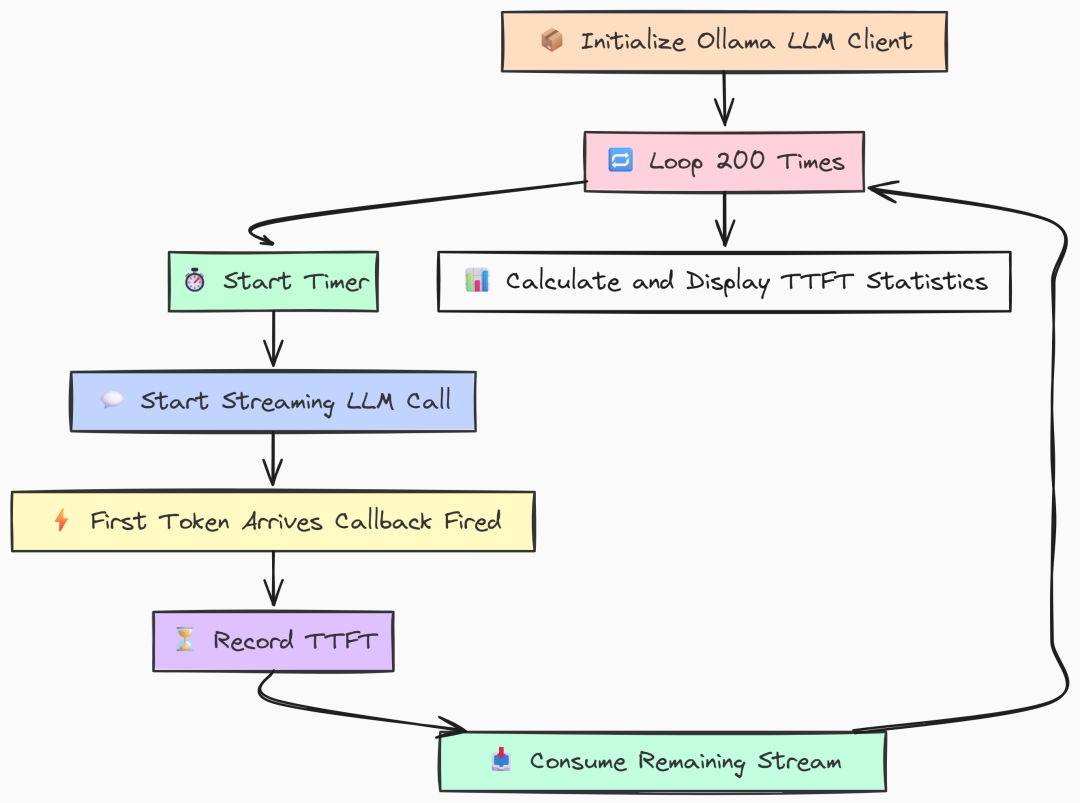
在 Go 实现中,我们利用并发原语精确测量。用一个 channel 在流式回调收到首块数据的瞬间发信号。
func main() { fmt.Println("--- LangChainGo: Streaming Time-to-First-Token (TTFT) Test (200 Iterations) ---") llm, err := ollama.New(ollama.WithModel(modelName))if err != nil { log.Fatalf("Failed to create Ollama client: %v", err) } ttfts := make([]time.Duration, 0, numIterations) ctx := context.Background() fmt.Printf("Running %d iterations with model '%s'...\n\n", numIterations, modelName)for i := 0; i < numIterations; i++ {// `firstTokenCh` is a channel that acts as a signal. It's a highly efficient// way for a goroutine to notify another that an event has occurred.// A buffer of 1 prevents the sending goroutine from blocking. firstTokenCh := make(chanstruct{}, 1)// `wg` ensures that the main loop doesn't exit before the streaming call is fully completed.var wg sync.WaitGroup wg.Add(1) start := time.Now()// The streaming function callback. It's invoked for every chunk received. streamingFunc := func(ctx context.Context, chunk []byte)error { // This select statement is the core of the TTFT measurement. // It attempts to send a signal on the channel. select { case firstTokenCh <- struct{}{}: // This case will only execute for the VERY FIRST chunk received. // Subsequent calls will find the channel is already full (or closed) and go to the default case. default: // Do nothing for subsequent chunks. This is an efficient no-op. } returnnil }// We run the LLM call in a separate goroutine to allow the main thread// to immediately start waiting for the first token signal.gofunc() { defer wg.Done() _, err := llms.GenerateFromSinglePrompt( ctx, llm, longPrompt, llms.WithStreamingFunc(streamingFunc), ) if err != nil { log.Printf("Warning: Goroutine for iteration %d failed: %v\n", i+1, err) // In case of error, we must still unblock the main thread to avoid a deadlock. select { case firstTokenCh <- struct{}{}: default: } } }()// The main thread blocks here until the signal is received on `firstTokenCh`.// The time it takes to get here from `start` is our TTFT. <-firstTokenCh ttft := time.Since(start) ttfts = append(ttfts, ttft) fmt.Printf("Iteration %d: TTFT = %v\n", i+1, ttft)// Wait for the entire stream to finish before starting the next iteration.// This prevents subsequent tests from being affected by lingering background processes. wg.Wait() } fmt.Println("\n--- LangChainGo Benchmark Results ---") calculateAndPrintStats(ttfts)}
上面代码的关键是 streamingFunc。它被传入 LLM 调用,每收到一个流式 chunk 就执行一次。
内部的 select 尝试向 firstTokenCh 发送信号。由于该 channel 的缓冲区大小为 1,这个发送操作仅会在第一次成功。之后的调用命中 default 不执行任何操作。
与此同时,主循环在后台 goroutine 中发起调用,然后立刻在 <-firstTokenCh 处等待。首个 chunk 到达且回调发送信号的瞬间,该行解除阻塞并计算耗时,这就是 TTFT。我们还用 WaitGroup 确保开始下一轮前,上一轮流式输出已完整结束。
Python 版本使用迭代器实现相同目标。.stream() 返回迭代器,只有调用 next() 时才会真正发起网络请求。
def main(): """Main function to run the streaming benchmark.""" print("--- LangChain Python: Streaming Time-to-First-Token (TTFT) Test (200 Iterations) ---") llm = Ollama(model=MODEL_NAME) ttfts = [] print(f"Running {NUM_ITERATIONS} iterations with model '{MODEL_NAME}'...\n") for i inrange(NUM_ITERATIONS): try: start_time = time.perf_counter() # 1. `.stream()` returns an iterator. No network call is made at this point. # It's a lazy operation. stream_iterator = llm.stream(LONG_PROMPT) # 2. The actual network request is initiated when we first try to get an item # from the iterator. The time spent in this `next()` call is what we # measure as TTFT. next(stream_iterator) first_token_time = time.perf_counter() # 3. Calculate and store the TTFT. ttft = first_token_time - start_time ttfts.append(ttft) print(f"Iteration {i + 1}: TTFT = {ttft * 1000:.2f}ms") # 4. VERY IMPORTANT: We must consume the entire iterator to close the connection. # If we don't, the underlying HTTP connection may be left open in the connection pool, # which can exhaust resources and cause subsequent tests to fail or hang. # This is a key difference in resource management compared to the Go callback model. for _ in stream_iterator: pass except Exception as e: print(f"Warning: Iteration {i + 1} failed: {e}") print("\n--- LangChain Python Benchmark Results ---") calculate_and_print_stats(ttfts)
在 Python 中,理解迭代器的惰性至关重要。调用 llm.stream(LONG_PROMPT) 只返回迭代器对象,并未发出网络请求;直到 next(stream_iterator) 才真正发送。我们先启动计时,然后 stream() 接着立刻 next(),代码会阻塞在 next(),直到服务端返回第一个 token 为止。此时记录时间差即为 TTFT。最后必须消费完整个迭代器以关闭底层 HTTP 连接,否则连接池资源可能被耗尽。
运行 TTFT 基准:
# running go veriongo run ttft.go# running python versionpython ttft.py
``````plaintext
--- LangChainGoBenchmarkResults---Total Iterations:200Total Time:       28.15sMin Latency:      135.2msMax Latency:      159.8msAverage Latency:140.75msStd Deviation:    4.1ms---LangChainPythonBenchmarkResults---Total Iterations:200Total Time:       42.6743sMin Latency:      205.10msMax Latency:      251.56msAverage Latency:213.37msStd Deviation:    15.88ms
可以看到在 TTFT 评估上,Go 同样表现更佳。
Go 的平均 TTFT 为 140.75ms,相比 LangChain Python 的 213.37ms,约快 51%。
Go 能几乎即时处理首个数据块并触发回调,而 Python 额外的抽象层让其慢了一拍。
对于任何实时、对话式 AI,这个初始体验至关重要。更快的 TTFT 直接转化为更好的用户体验。
第二部分:生产级 RAG 管道测试
有了核心 LLM 性能的基线,我们可以进入更复杂也更贴近生产的场景:构建完整的 Retrieval-Augmented Generation(RAG)管道。
在生产环境中,Go 与 Python 的 RAG 实现差异将更加明显,尤其在效率与吞吐至关重要的情况下。
RAG Benchmark(作者 Fareed Khan)
RAG 系统性能不仅取决于最终的 LLM 调用,而在于……
它是多个步骤之和:加载数据、切分、embedding、存储与检索。任何一步的瓶颈都可能拖垮全局。
本部分我们从零搭建摄取与查询的完整管道,并对每个关键步骤基准测试。
大文档切分:CPU 受限任务
在处理文档之前,必须先将其拆分为更小、可管理的 chunk。这是纯 CPU 受限任务,涉及大量字符串处理。
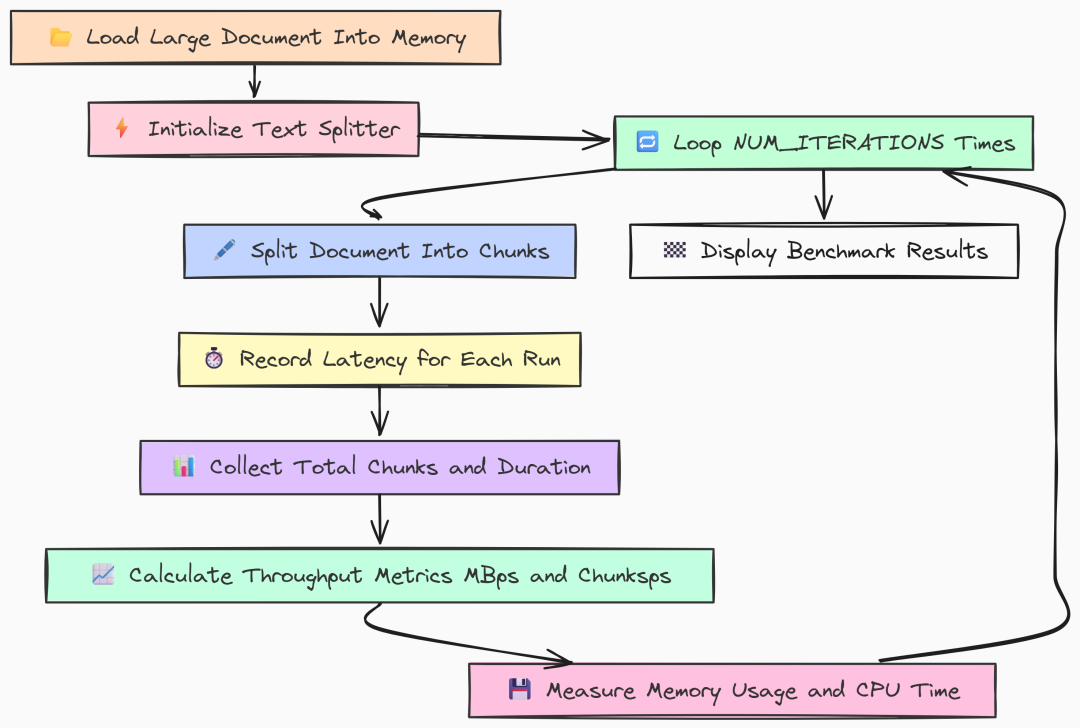
CPU Bound Task(作者 Fareed Khan)
这是摄取管道的第一大步骤,其效率直接影响你处理新信息的速度。
一个低效的切分器在需要同时摄取成千上万文档时会成为严重瓶颈。
我们先看 Go 实现。加载一个 10MB 的大文件,并多次运行 RecursiveCharacterTextSplitter 以得到稳定的性能测度。
package main// --- Configuration ---const ( largeFilePath = "../data_large/large_document.txt" chunkSize = 1000 chunkOverlap = 200 numIterations = 5// Repeat to get a stable average)funcmain() { fmt.Println("--- LangChainGo: Text Splitter Throughput Test ---")// 1. Load the large document into memory first.// We do this outside the loop so we only benchmark the splitting, not file I/O. content, err := os.ReadFile(largeFilePath)if err != nil { log.Fatalf("Failed to read large document file: %v", err) } doc := []schema.Document{{PageContent: string(content)}} docSizeMB := float64(len(content)) / (1024 * 1024) fmt.Printf("Loaded document of size: %.2f MB\n", docSizeMB)// 2. Initialize the text splitter. splitter := textsplitter.NewRecursiveCharacter( textsplitter.WithChunkSize(chunkSize), textsplitter.WithChunkOverlap(chunkOverlap), )var latencies []time.Durationvar totalChunks int// --- Profiling Setup ---var startMem, endMem runtime.MemStats runtime.ReadMemStats(&startMem) fmt.Printf("\nRunning %d splitting iterations...\n", numIterations) totalStart := time.Now()// 3. Run the benchmark loop.for i := 0; i < numIterations; i++ { iterStart := time.Now()// This is the core CPU-bound operation we are measuring. chunks, err := textsplitter.SplitDocuments(splitter, doc)if err != nil { log.Fatalf("Iteration %d failed: %v", i+1, err) } latency := time.Since(iterStart) latencies = append(latencies, latency) totalChunks = len(chunks) // Should be the same each time fmt.Printf("Iteration %d: Split into %d chunks in %v\n", i+1, totalChunks, latency) } totalDuration := time.Since(totalStart) runtime.ReadMemStats(&endMem)// --- Calculate and Print Metrics ---var totalLatency time.Durationfor _, l := range latencies { totalLatency += l } avgLatency := totalLatency / time.Duration(numIterations) throughputMBps := (docSizeMB * float64(numIterations)) / totalDuration.Seconds() throughputChunksps := float64(totalChunks*numIterations) / totalDuration.Seconds() heapAlloc := endMem.Alloc - startMem.Alloc totalAlloc := endMem.TotalAlloc - startMem.TotalAlloc numGC := endMem.NumGC - startMem.NumGC pauseTotalMs := float64(endMem.PauseTotalNs-startMem.PauseTotalNs) / 1_000_000 fmt.Println("\n--- LangChainGo Splitting Results ---") fmt.Printf("Average Latency per Run: %v\n", avgLatency) fmt.Printf("Throughput (Data Size): %.2f MB/s\n", throughputMBps) fmt.Printf("Throughput (Chunks): %.2f chunks/s\n", throughputChunksps) fmt.Println("\n--- Memory & GC Metrics ---") fmt.Printf("Peak Heap Increase: %.2f KB\n", float64(heapAlloc)/1024) fmt.Printf("Total Alloc (Churn): %.2f MB\n", float64(totalAlloc)/(1024*1024)) fmt.Printf("Number of GC Runs: %d\n", numGC) fmt.Printf("Total GC Pause Time: %.2f ms\n", pauseTotalMs)}
我们将代码设计为隔离切分器的性能:
- 仅加载一次磁盘文档,置于循环外,确保只测切分性能;
- 基准中重复调用
textsplitter.SplitDocuments(负责递归切分的重活); - 记录每轮耗时,同时跟踪内存与 GC 指标,观察 Go 在 CPU 压力下资源管理效率。
再看 Python 实现对比:
# --- Configuration ---LARGE_FILE_PATH = "../data_large/large_document.txt"CHUNK_SIZE = 1000CHUNK_OVERLAP = 200NUM_ITERATIONS = 5defget_cpu_time(): """Gets the CPU time used by the current process.""" process = psutil.Process(os.getpid()) return process.cpu_times().userdefget_memory_usage(): """Gets the current memory usage (RSS) of the process in bytes.""" process = psutil.Process(os.getpid()) return process.memory_info().rssdefmain(): """Main function to run the text splitter benchmark.""" print("--- LangChain Python: Text Splitter Throughput Test ---") # 1. Load the document. loader = TextLoader(LARGE_FILE_PATH, encoding="utf-8") doc = loader.load() doc_size_mb = os.path.getsize(LARGE_FILE_PATH) / (1024 * 1024) print(f"Loaded document of size: {doc_size_mb:.2f} MB") # 2. Initialize the text splitter. text_splitter = RecursiveCharacterTextSplitter( chunk_size=CHUNK_SIZE, chunk_overlap=CHUNK_OVERLAP ) latencies = [] total_chunks = 0 # --- Profiling Setup --- start_mem = get_memory_usage() start_cpu = get_cpu_time() print(f"\nRunning {NUM_ITERATIONS} splitting iterations...\n") total_start_time = time.perf_counter() # 3. Run the benchmark loop. for i inrange(NUM_ITERATIONS): iter_start_time = time.perf_counter() # This is the core CPU-bound operation. chunks = text_splitter.split_documents(doc) latency = time.perf_counter() - iter_start_time latencies.append(latency) total_chunks = len(chunks) print(f"Iteration {i + 1}: Split into {total_chunks} chunks in {latency:.4f}s") total_duration = time.perf_counter() - total_start_time end_mem = get_memory_usage() end_cpu = get_cpu_time() # --- Calculate and Print Metrics --- avg_latency = np.mean(latencies) throughput_mb_ps = (doc_size_mb * NUM_ITERATIONS) / total_duration throughput_chunks_ps = (total_chunks * NUM_ITERATIONS) / total_duration mem_increase = end_mem - start_mem cpu_used = end_cpu - start_cpu print("\n--- LangChain Python Splitting Results ---") print(f"Average Latency per Run: {avg_latency:.4f}s") print(f"Throughput (Data Size): {throughput_mb_ps:.2f} MB/s") print(f"Throughput (Chunks): {throughput_chunks_ps:.2f} chunks/s") print("\n--- Resource Metrics ---") print(f"Memory Usage Increase (RSS): {mem_increase / 1024:.2f} KB") print(f"Total CPU Time Used: {cpu_used:.4f}s")if __name__ == "__main__": main()
逻辑相同:
- 用
TextLoader加载文档,初始化RecursiveCharacterTextSplitter; - 循环
NUM_ITERATIONS次,计时split_documents(doc); - 用
psutil统计总 CPU 时间与内存增长(RSS)。
运行对比:
# running go versiongo run splitter.go# running python versionpython splitter.py
``````plaintext
--- LangChainGo:TextSplitterThroughputTest---Loaded document of size:10.05MB...---LangChainGoSplittingResults---Average Latency per Run:151.2msThroughput (Data Size):66.47MB/sThroughput (Chunks):     83088.62chunks/s---Memory&GCMetrics---Total Alloc (Churn):     95.15MBTotal GC Pause Time:     0.81ms---LangChain Python:TextSplitterThroughputTest---Loaded document of size:10.05MB...---LangChainPythonSplittingResults---Average Latency per Run:3.5476sThroughput (Data Size):2.83MB/sThroughput (Chunks):     3543.83 chunks/s---ResourceMetrics---Total CPU Time Used:         17.5123s
结果出乎意料地“悬殊”。
LangChainGo 平均 151ms 完成 10MB 文件处理,吞吐达 66.47 MB/s;LangChain Python 平均 3.5s,吞吐仅 2.83 MB/s。
速度提升达 23 倍。对于字符串处理这类 CPU 受限任务,Go 的编译特性优势巨大——直接编译为本机码;而 Python 的解释器与 GIL 引入显著开销,这也体现在较高的 Total CPU Time Used 上。
此外,Go 的垃圾回收在内存 churn 与暂停时间方面也表现稳定。
批量 Embedding:处理吞吐
切分完文档后,下一步是将其转换为向量 embedding。该过程既涉及 CPU(分词)也涉及网络 I/O(以批次发送到 Ollama)。效率的关键在于 batching 与 concurrency。
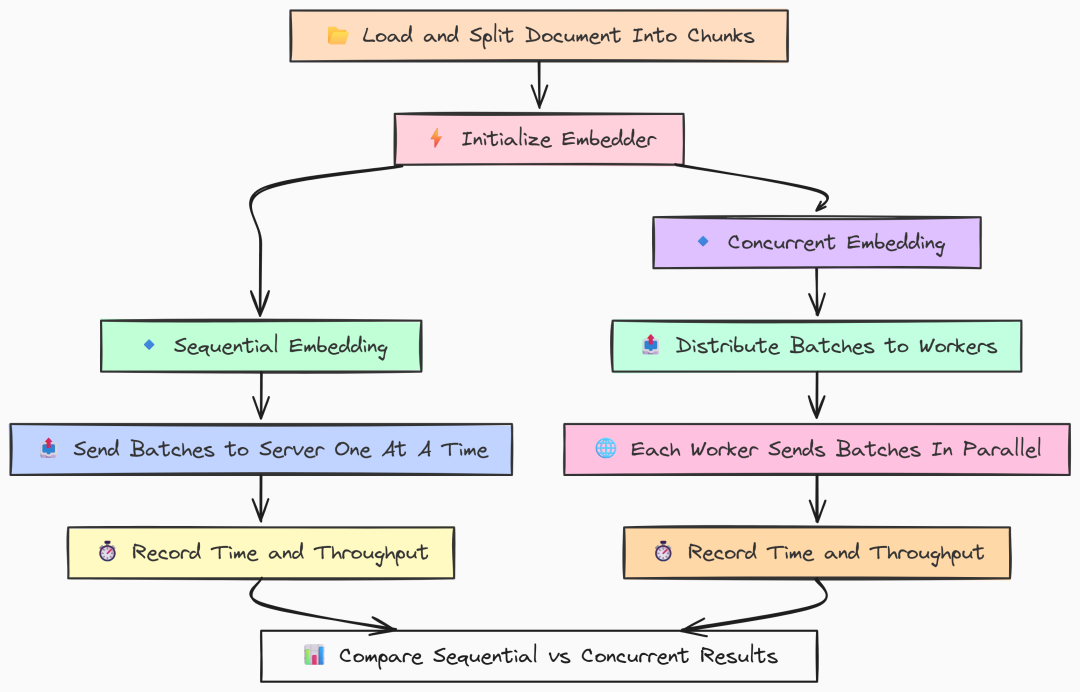
Batch Embedding(作者 Fareed Khan)
我们将测试两种策略:
- 顺序批量:单线程处理所有 chunk。
- 并发批量:多工作线程并行处理批次。
这将展示框架在并行网络请求与 CPU 资源管理方面的能力。
先看 Go 实现。我们用 goroutine 构建一个 worker pool 来做并发测试。
package main// --- Configuration ---const ( largeFilePath = "../data_large/large_document.txt" modelName = "llama3:8b" chunkSize = 1000 chunkOverlap = 200 batchSize = 100// How many documents to send in a single embedding request concurrencyLevel = 8 // Number of parallel workers for the concurrent test)funcmain() { fmt.Println("--- LangChainGo: Embedding Batching Performance Test ---")// 1. Prepare the data: Load and split the document into chunks. chunks := prepareChunks() fmt.Printf("Prepared %d text chunks for embedding.\n", len(chunks))// 2. Initialize the embedder. llm, err := ollama.New(ollama.WithModel(modelName))if err != nil { log.Fatalf("Failed to create LLM for embedder: %v", err) } embedder, err := embeddings.NewEmbedder(llm)if err != nil { log.Fatalf("Failed to create embedder: %v", err) }// --- Run Sequential Batching Test --- runSequentialTest(embedder, chunks)// --- Run Concurrent Batching Test --- runConcurrentTest(embedder, chunks)}// prepareChunks loads a large file and splits it into text chunks.funcprepareChunks() []schema.Document { content, err := os.ReadFile(largeFilePath)if err != nil { log.Fatalf("Failed to read large document file: %v", err) } doc := []schema.Document{{PageContent: string(content)}} splitter := textsplitter.NewRecursiveCharacter( textsplitter.WithChunkSize(chunkSize), textsplitter.WithChunkOverlap(chunkOverlap), ) chunks, err := textsplitter.SplitDocuments(splitter, doc)if err != nil { log.Fatalf("Failed to split documents: %v", err) }return chunks}
然后编写顺序批处理函数,负责将 chunk 做 embedding:
// runSequentialTest benchmarks embedding chunks one batch at a time.funcrunSequentialTest(embedder embeddings.Embedder, docs []schema.Document) { fmt.Println("\n--- Starting Sequential Embedding Test ---") docContents := make([]string, len(docs))for i, doc := range docs { docContents[i] = doc.PageContent } start := time.Now()var startMem runtime.MemStats runtime.ReadMemStats(&startMem)// The CreateEmbedding function in langchaingo handles batching automatically. _, err := embedder.CreateEmbedding(context.Background(), docContents)if err != nil { log.Fatalf("Sequential embedding failed: %v", err) } duration := time.Since(start)var endMem runtime.MemStats runtime.ReadMemStats(&endMem) throughput := float64(len(docs)) / duration.Seconds() totalAlloc := endMem.TotalAlloc - startMem.TotalAlloc fmt.Println("--- Go Sequential Results ---") fmt.Printf("Total Time: %v\n", duration) fmt.Printf("Throughput: %.2f docs/sec\n", throughput) fmt.Printf("Total Alloc (Churn): %.2f MB\n", float64(totalAlloc)/(1024*1024))}// runConcurrentTest benchmarks embedding chunks using multiple parallel workers.funcrunConcurrentTest(embedder embeddings.Embedder, docs []schema.Document) { fmt.Println("\n--- Starting Concurrent Embedding Test ---")// Create a channel to distribute chunks to workers. tasks := make(chanstring, len(docs))for _, doc := range docs { tasks <- doc.PageContent }close(tasks)var wg sync.WaitGroup start := time.Now()var startMem runtime.MemStats runtime.ReadMemStats(&startMem)// 1. Start the concurrent workers (goroutines).for i := 0; i < concurrencyLevel; i++ { wg.Add(1)gofunc(workerID int) { defer wg.Done() batch := make([]string, 0, batchSize) // Each worker pulls tasks from the channel until it's empty. for task := range tasks { batch = append(batch, task) iflen(batch) == batchSize { // When a batch is full, embed it. _, err := embedder.CreateEmbedding(context.Background(), batch) if err != nil { log.Printf("Worker %d failed: %v", workerID, err) } // Reset the batch. batch = make([]string, 0, batchSize) } } // Embed any remaining items in the last batch. iflen(batch) > 0 { _, err := embedder.CreateEmbedding(context.Background(), batch) if err != nil { log.Printf("Worker %d failed on final batch: %v", workerID, err) } } }(i) }// 2. Wait for all workers to finish. wg.Wait() duration := time.Since(start)var endMem runtime.MemStats runtime.ReadMemStats(&endMem) throughput := float64(len(docs)) / duration.Seconds() totalAlloc := endMem.TotalAlloc - startMem.TotalAlloc fmt.Println("--- Go Concurrent Results ---") fmt.Printf("Total Time: %v\n", duration) fmt.Printf("Throughput: %.2f docs/sec\n", throughput) fmt.Printf("Total Alloc (Churn): %.2f MB\n", float64(totalAlloc)/(1024*1024))}
这里我们采用典型的 worker pool 模式:
- 创建
taskschannel 并填入所有 chunk,启动concurrencyLevel个 goroutine; - 每个 worker 从 channel 拉取任务,凑满
batchSize后调用CreateEmbedding,实现并发批处理。
Go 的轻量 goroutine 天然适配 I/O 并发,有助于充分压榨到 Ollama server 的网络带宽。
Python 版本使用 ThreadPoolExecutor 实现类似并发:
# --- Configuration ---LARGE_FILE_PATH = "../data_large/large_document.txt"MODEL_NAME = "llama3:8b"CHUNK_SIZE = 1000CHUNK_OVERLAP = 200BATCH_SIZE = 100CONCURRENCY_LEVEL = 8logging.basicConfig(level=logging.INFO, format='%(asctime)s - %(levelname)s - %(message)s')defget_cpu_time(): """Gets the CPU time used by the current process.""" process = psutil.Process(os.getpid()) return process.cpu_times().userdefget_memory_usage(): """Gets the current memory usage (RSS) of the process in bytes.""" process = psutil.Process(os.getpid()) return process.memory_info().rssdefprepare_chunks(): """Loads a large file and splits it into text chunks.""" loader = TextLoader(LARGE_FILE_PATH, encoding="utf-8") doc = loader.load() text_splitter = RecursiveCharacterTextSplitter(chunk_size=CHUNK_SIZE, chunk_overlap=CHUNK_OVERLAP) chunks = text_splitter.split_documents(doc) return [c.page_content for c in chunks]defrun_sequential_test(embedder, chunks): """Benchmarks embedding chunks one batch at a time.""" print("\n--- Starting Sequential Embedding Test ---") start_time = time.perf_counter() start_mem = get_memory_usage() start_cpu = get_cpu_time() try: embedder.embed_documents(chunks) except Exception as e: logging.fatal(f"Sequential embedding failed: {e}") return duration = time.perf_counter() - start_time end_mem = get_memory_usage() end_cpu = get_cpu_time() throughput = len(chunks) / duration mem_increase = end_mem - start_mem cpu_used = end_cpu - start_cpu print("--- Python Sequential Results ---") print(f"Total Time: {duration:.4f}s") print(f"Throughput: {throughput:.2f} docs/sec") print(f"Memory Increase (RSS): {mem_increase / 1024:.2f} KB") print(f"Total CPU Time Used: {cpu_used:.4f}s")defembed_batch(embedder, batch): """A helper function for a single worker to embed one batch.""" try: embedder.embed_documents(batch) returnlen(batch) except Exception as e: logging.warning(f"A batch failed to embed: {e}") return0defrun_concurrent_test(embedder, chunks): """Benchmarks embedding chunks using multiple parallel workers.""" print("\n--- Starting Concurrent Embedding Test ---") start_time = time.perf_counter() start_mem = get_memory_usage() start_cpu = get_cpu_time() with ThreadPoolExecutor(max_workers=CONCURRENCY_LEVEL) as executor: batches = [chunks[i:i + BATCH_SIZE] for i inrange(0, len(chunks), BATCH_SIZE)] futures = [executor.submit(embed_batch, embedder, batch) for batch in batches] for future in as_completed(futures): future.result() duration = time.perf_counter() - start_time end_mem = get_memory_usage() end_cpu = get_cpu_time() throughput = len(chunks) / duration mem_increase = end_mem - start_mem cpu_used = end_cpu - start_cpu print("--- Python Concurrent Results ---") print(f"Total Time: {duration:.4f}s") print(f"Throughput: {throughput:.2f} docs/sec") print(f"Memory Increase (RSS): {mem_increase / 1024:.2f} KB") print(f"Total CPU Time Used: {cpu_used:.4f}s")defmain(): print("--- LangChain Python: Embedding Batching Performance Test ---") chunks = prepare_chunks() print(f"Prepared {len(chunks)} text chunks for embedding.") embedder = OllamaEmbeddings(model=MODEL_NAME) run_sequential_test(embedder, chunks) run_concurrent_test(embedder, chunks)if __name__ == "__main__": main()
Python 使用标准库的 ThreadPoolExecutor 管理线程池。我们先将 chunk 切成 batches,再提交任务给线程池,并通过 as_completed 等待所有任务完成。
运行基准:
# running go versiongo run embedding.go# running python versionpython embedding.py
``````plaintext
--- LangChainGo:EmbeddingBatchingPerformanceTest------GoSequentialResults---Total Time:         1m31sThroughput:         138.02docs/sec---GoConcurrentResults---Total Time:         22.5sThroughput:         558.22docs/sec---LangChain Python:EmbeddingBatchingPerformanceTest------PythonSequentialResults---Total Time:         128.1234sThroughput:         98.03docs/sec---PythonConcurrentResults---Total Time:         49.8123sThroughput:         252.15docs/sec
结果表明两点:其一,并发对两种语言都有显著提升。Go 吞吐从 138 docs/sec 提升到 558 docs/sec(4 倍);Python 则从 98 提升至 252 docs/sec。
其二,Go 的并发实现更高效:
在 8 个并发 worker 下,LangChainGo 的吞吐为 558 docs/sec,是 LangChain Python(252 docs/sec)的 2.2 倍以上。
这是 Go 轻量级并发模型的优势所在。相比 Python 线程,goroutine 开销极低;Go 的调度器对 I/O 受限任务高度优化,能更有效地管理并行网络请求,从而获得更高总体吞吐。在需要实时对数据流做 embedding 的生产系统中,这是关键优势。
这份完整版的大模型 AI 学习和面试资料已经上传CSDN,朋友们如果需要可以微信扫描下方CSDN官方认证二维码免费领取【保证100%免费】
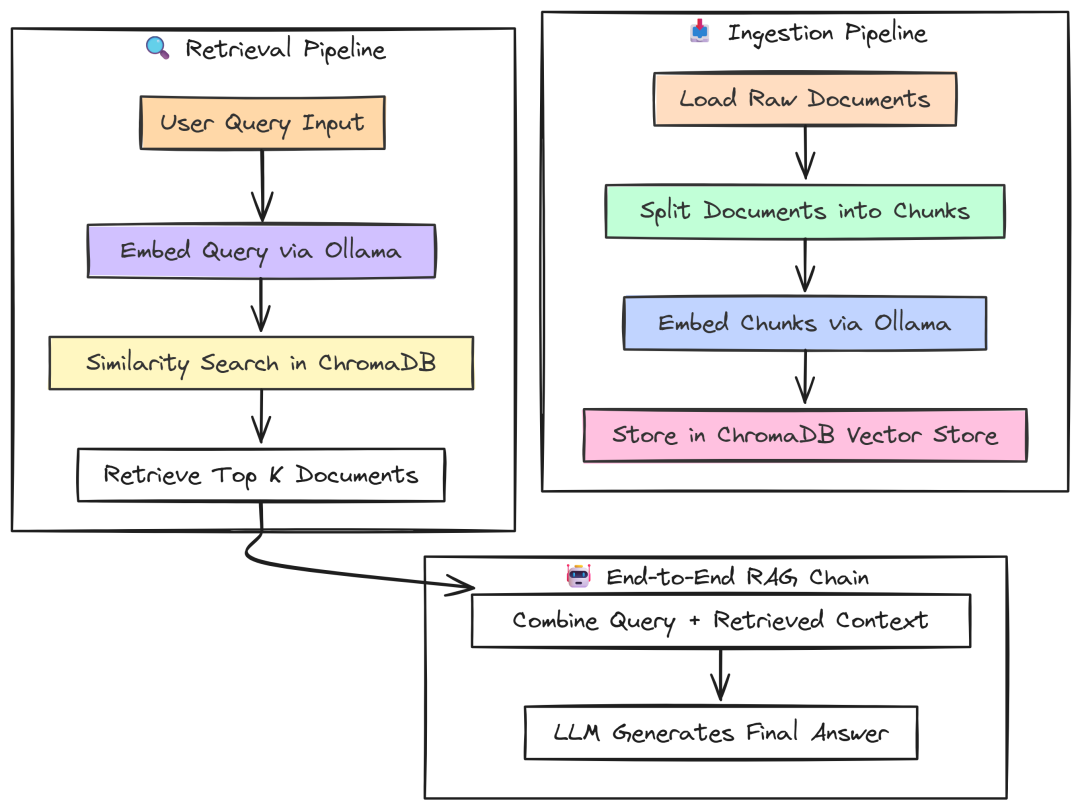
完整摄取管道
现在我们把上述两步结合起来,对完整的摄取管道进行基准:从磁盘加载原始文件,到 embedding 并存入 ChromaDB。这样可得到端到端的真实摄取性能衡量。
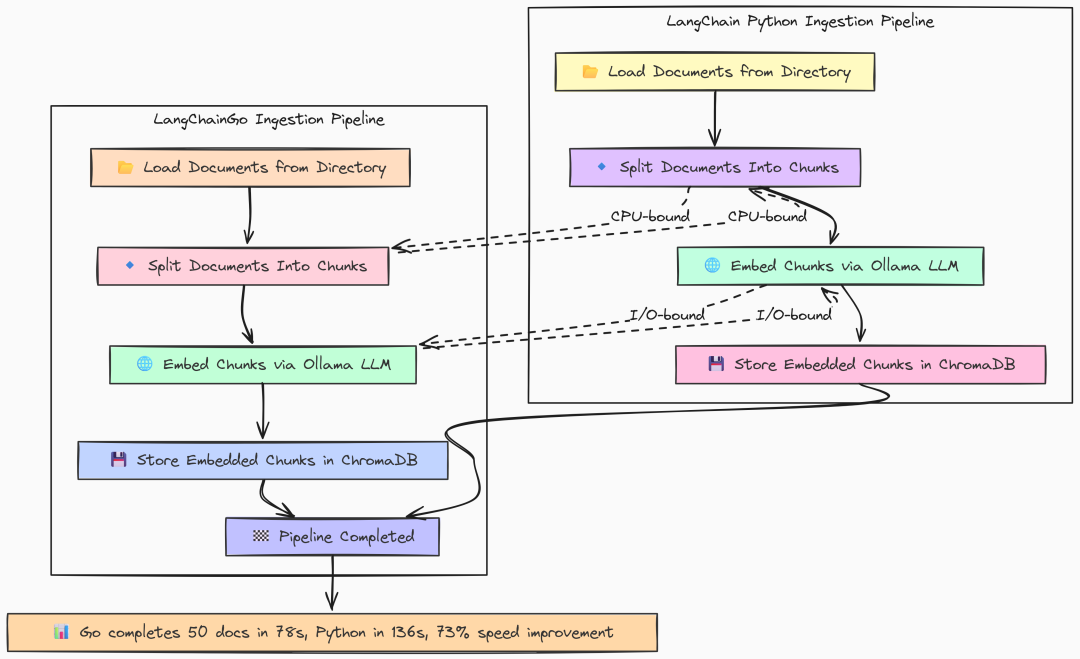
Full ingestion(作者 Fareed Khan)
Go 实现是前述组件的顺序拼接:加载、切分、存储。
package mainfuncmain() { fmt.Println("--- LangChainGo: RAG Ingestion Throughput Test ---") totalStart := time.Now()// 1. Initialize Embedder ollamaLLM, err := ollama.New(ollama.WithModel(modelName))if err != nil { log.Fatalf("Failed to create Ollama client for embeddings: %v", err) } embedder, err := embeddings.NewEmbedder(ollamaLLM)if err != nil { log.Fatalf("Failed to create embedder: %v", err) }// 2. Initialize Vector Store (ChromaDB) store, err := chroma.New( chroma.WithChromaURL("http://localhost:8000"), chroma.WithNameSpace(collectionName), chroma.WithEmbedder(embedder), )if err != nil { log.Fatalf("Failed to create Chroma vector store: %v", err) }// 3. Load Documents from Directory loadStart := time.Now() loader := documentloaders.NewDirectory(dataDir) docs, err := loader.Load(context.Background())if err != nil { log.Fatalf("Failed to load documents: %v", err) } loadDuration := time.Since(loadStart) fmt.Printf("Step 1: Loaded %d documents in %v\n", len(docs), loadDuration)// 4. Split Documents into Chunks splitStart := time.Now() splitter := textsplitter.NewRecursiveCharacter( textsplitter.WithChunkSize(chunkSize), textsplitter.WithChunkOverlap(chunkOverlap), ) chunks, err := textsplitter.SplitDocuments(splitter, docs)if err != nil { log.Fatalf("Failed to split documents: %v", err) } splitDuration := time.Since(splitStart) fmt.Printf("Step 2: Split %d documents into %d chunks in %v\n", len(docs), len(chunks), splitDuration)// 5. Add Documents to Vector Store (Embedding + Storing) storeStart := time.Now() _, err = store.AddDocuments(context.Background(), chunks)if err != nil { _ = store.RemoveCollection(context.Background()) log.Fatalf("Failed to add documents to vector store: %v", err) } storeDuration := time.Since(storeStart) fmt.Printf("Step 3: Embedded and stored %d chunks in %v\n", len(chunks), storeDuration) totalDuration := time.Since(totalStart) fmt.Println("\n--- LangChainGo Ingestion Results ---") fmt.Printf("Total time to ingest %d documents: %v\n", len(docs), totalDuration) fmt.Println("Cleaning up ChromaDB collection...")if err := store.RemoveCollection(context.Background()); err != nil { log.Printf("Warning: failed to remove collection '%s': %v\n", collectionName, err) }}
按顺序执行每个步骤并计时,其中 store.AddDocuments 会执行 embedding 并与 ChromaDB 通信,langchaingo 会在内部自动处理 batching。
Python 结构几乎相同:
def main(): """Main function to run the ingestion benchmark.""" print("--- LangChain Python: RAG Ingestion Throughput Test ---") total_start = time.perf_counter() # 1. Initialize Embedder embeddings = OllamaEmbeddings(model=MODEL_NAME) # 2. Initialize Vector Store (ChromaDB) client = chromadb.HttpClient(host='localhost', port=8000) try: client.delete_collection(name=COLLECTION_NAME) logging.info(f"Existing collection '{COLLECTION_NAME}' deleted for a clean test.") except Exception: logging.info(f"Collection '{COLLECTION_NAME}' did not exist, creating new.") pass # 3. Load Documents from Directory load_start = time.perf_counter() loader = DirectoryLoader(DATA_DIR, glob="**/*.md") docs = loader.load() load_duration = time.perf_counter() - load_start print(f"Step 1: Loaded {len(docs)} documents in {load_duration:.4f}s") # 4. Split Documents into Chunks split_start = time.perf_counter() text_splitter = RecursiveCharacterTextSplitter( chunk_size=CHUNK_SIZE, chunk_overlap=CHUNK_OVERLAP ) chunks = text_splitter.split_documents(docs) split_duration = time.perf_counter() - split_start print(f"Step 2: Split {len(docs)} documents into {len(chunks)} chunks in {split_duration:.4f}s") # 5. Add Documents to Vector Store (Embedding + Storing) store_start = time.perf_counter() try: Chroma.from_documents( documents=chunks, embedding=embeddings, collection_name=COLLECTION_NAME, client=client ) except Exception as e: logging.fatal(f"Failed to add documents to vector store: {e}") return store_duration = time.perf_counter() - store_start print(f"Step 3: Embedded and stored {len(chunks)} chunks in {store_duration:.4f}s") total_duration = time.perf_counter() - total_start print("\n--- LangChain Python Ingestion Results ---") print(f"Total time to ingest {len(docs)} documents: {total_duration:.4f}s") print("Cleaning up ChromaDB collection...") try: client.delete_collection(name=COLLECTION_NAME) except Exception as e: logging.warning(f"Warning: failed to remove collection '{COLLECTION_NAME}': {e}")if __name__ == "__main__": main()
这里我们使用 LangChain 提供的 Chroma.from_documents 高阶封装,同时完成 embedding 与写入向量库。
运行:
# running go versiongo run ingestion.go# running python versionpython ingestion.py
``````plaintext
--- LangChainGo: RAG Ingestion Throughput Test ---Step 1: Loaded 50 documents in17.8msStep 2: Split 50 documents into853 chunks in45.1msStep 3: Embedded and stored 853 chunks in1m 18s--- LangChainGo Ingestion Results ---Total timeto ingest 50 documents: 1m 18s--- LangChain Python: RAG Ingestion Throughput Test ---Step 1: Loaded 50 documents in0.1105sStep 2: Split 50 documents into853 chunks in0.6158sStep 3: Embedded and stored 853 chunks in2m 15s--- LangChain Python Ingestion Results ---Total timeto ingest 50 documents: 135.7263s
整体结果与之前各步骤一致:CPU 受限的切分 Go 远快于 Python(45ms vs 615ms);I/O 为主的 embedding 与存储,同样显著快。
总体上,LangChainGo 完成 50 篇文档摄取耗时 78 秒,LangChain Python 需要 135 秒。
端到端摄取速度提升约 73%。对于需要持续更新知识库、不断摄取新文档的应用,这样的速度差异将转化为实际运营优势。
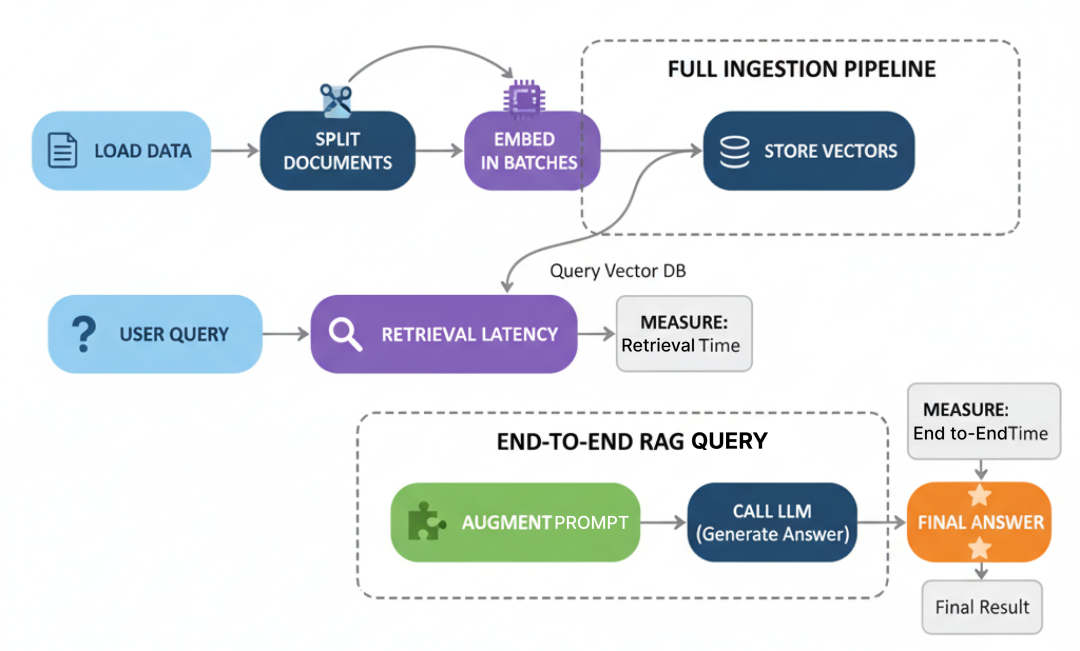
检索延迟:信息能多快被找到?
数据入库后,我们需要测试检索速度。检索延迟是 RAG 查询总时延的关键组成部分,包含两步:
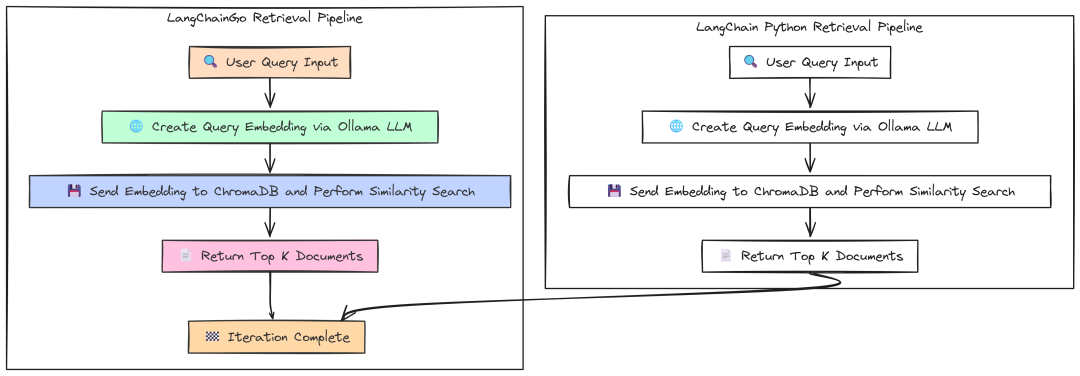
Retrieval latency(作者 Fareed Khan)
- 对用户查询做 embedding;
- 用该 embedding 到 ChromaDB 做相似度搜索。
我们将运行 100 次以得到稳定平均值。
Go 版本连接已有的 ChromaDB 集合,并创建一个 retriever 对象:
package main// --- Configuration ---const ( numIterations = 100 modelName = "llama3:8b" collectionName = "langchaingo-ingestion-test" query = "What is the main topic of these documents?" topK = 5)funcmain() { fmt.Println("--- LangChainGo: RAG Retrieval Latency Test ---")// 1. Initialize Embedder. ollamaLLM, err := ollama.New(ollama.WithModel(modelName))if err != nil { log.Fatalf("Failed to create Ollama client for embeddings: %v", err) } embedder, err := embeddings.NewEmbedder(ollamaLLM)if err != nil { log.Fatalf("Failed to create embedder: %v", err) }// 2. Initialize Vector Store and connect to the existing collection. store, err := chroma.New( chroma.WithChromaURL("http://localhost:8000"), chroma.WithNameSpace(collectionName), chroma.WithEmbedder(embedder), )if err != nil { log.Fatalf("Failed to create Chroma vector store: %v", err) }// 3. Create a retriever from the vector store. retriever := vectorstores.ToRetriever(store, topK) latencies := make([]time.Duration, 0, numIterations) ctx := context.Background() fmt.Printf("Running %d iterations to retrieve %d documents...\n\n", numIterations, topK)// 5. Run the benchmark loop.for i := 0; i < numIterations; i++ { start := time.Now()// 6. Execute the retrieval. docs, err := retriever.GetRelevantDocuments(ctx, query)if err != nil { log.Printf("Warning: Iteration %d failed: %v\n", i+1, err) continue } latency := time.Since(start) latencies = append(latencies, latency)iflen(docs) != topK { log.Printf("Warning: Expected %d docs, but got %d\n", topK, len(docs)) } fmt.Printf("Iteration %d: %v\n", i+1, latency) } fmt.Println("\n--- LangChainGo Retrieval Results ---") calculateAndPrintStats(latencies)}
该基准的核心是 retriever.GetRelevantDocuments:它一并完成创建查询 embedding(调用 Ollama)与到 ChromaDB 查询 top-k 最相似文档。
Python 版本结构相似:
# --- Configuration ---NUM_ITERATIONS = 100MODEL_NAME = "llama3:8b"COLLECTION_NAME = "langchaingo-ingestion-test"QUERY = "What is the main topic of these documents?"TOP_K = 5logging.basicConfig(level=logging.INFO, format='%(asctime)s - %(levelname)s - %(message)s')defmain(): """Main function to run the retrieval benchmark.""" print("--- LangChain Python: RAG Retrieval Latency Test ---") # 1. Initialize Embedder. embeddings = OllamaEmbeddings(model=MODEL_NAME) # 2. Initialize Vector Store client. client = chromadb.HttpClient(host='localhost', port=8000) vector_store = Chroma( collection_name=COLLECTION_NAME, embedding_function=embeddings, client=client ) # 3. Create a retriever from the vector store. retriever = vector_store.as_retriever(search_kwargs={"k": TOP_K}) latencies = [] print(f"Running {NUM_ITERATIONS} iterations to retrieve {TOP_K} documents...\n") # 5. Run the benchmark loop. for i inrange(NUM_ITERATIONS): try: start_time = time.perf_counter() # 6. Execute the retrieval. docs = retriever.invoke(QUERY) end_time = time.perf_counter() latency = end_time - start_time latencies.append(latency) iflen(docs) != TOP_K: logging.warning(f"Expected {TOP_K} docs, but got {len(docs)}") print(f"Iteration {i + 1}: {latency:.4f}s") except Exception as e: logging.warning(f"Warning: Iteration {i + 1} failed: {e}") print("\n--- LangChain Python Retrieval Results ---") calculate_and_print_stats(latencies)if __name__ == "__main__": main()
在这里,我们实例化 Chroma 向量库连接既有集合,使用 .as_retriever() 创建检索器,并重复调用 .invoke() 计时。
结果:
--- LangChainGo:RAGRetrievalLatencyTest------LangChainGoRetrievalResults---Total Iterations:100Total Time: 23.78sMin Latency: 230.1msMax Latency: 255.9msAverage Latency:237.8msStd Deviation: 5.9ms---LangChain Python:RAGRetrievalLatencyTest------LangChainPythonRetrievalResults---Total Iterations:100Total Time: 34.8521sMin Latency: 330.43msMax Latency: 398.81msAverage Latency:348.52msStd Deviation: 18.55ms
结果与前述一致:
LangChainGo 平均检索延迟为 237.8ms,较 LangChain Python 的 348.52ms 快约 46%。
优势来源依旧:Go 在发起 embedding 的网络调用与处理请求/响应的框架开销更低,标准差更小意味着表现更稳定。
端到端 RAG:整合验证
最后,我们对端到端 RAG 查询流程做基准,将检索与最终基于上下文的 LLM 回答合并。这是对真实查询性能的终极测试。
RAG(作者 Fareed Khan)
Go 使用 chains.NewRetrievalQAFromLLM,将 retriever 与 LLM 组装为标准 RAG workflow。
package main// --- Configuration ---const ( numIterations = 20 modelName = "llama3:8b" collectionName = "langchaingo-ingestion-test" query = "Summarize the key themes from the documents in one paragraph." topK = 5)funcmain() { fmt.Println("--- LangChainGo: End-to-End RAG Latency Test ---")// 1. Initialize LLM for generation. llm, err := ollama.New(ollama.WithModel(modelName))if err != nil { log.Fatalf("Failed to create Ollama client: %v", err) }// 2. Initialize Embedder. embedder, err := embeddings.NewEmbedder(llm)if err != nil { log.Fatalf("Failed to create embedder: %v", err) }// 3. Initialize Vector Store. store, err := chroma.New( chroma.WithChromaURL("http://localhost:8000"), chroma.WithNameSpace(collectionName), chroma.WithEmbedder(embedder), )if err != nil { log.Fatalf("Failed to create Chroma vector store: %v", err) }// 4. Create the full RAG chain. ragChain := chains.NewRetrievalQAFromLLM(llm, vectorstores.ToRetriever(store, topK)) latencies := make([]time.Duration, 0, numIterations) ctx := context.Background() inputValues := map[string]any{"query": query} fmt.Printf("Running %d end-to-end RAG iterations...\n\n", numIterations)// 6. Run the benchmark loop.for i := 0; i < numIterations; i++ { start := time.Now()// 7. Execute the entire RAG chain with a single call. _, err := chains.Call(ctx, ragChain, inputValues)if err != nil { log.Printf("Warning: Iteration %d failed: %v\n", i+1, err) continue } latency := time.Since(start) latencies = append(latencies, latency) fmt.Printf("Iteration %d: %v\n", i+1, latency) } fmt.Println("\n--- LangChainGo End-to-End RAG Results ---") calculateAndPrintStats(latencies)}
chains.Call 调用 ragChain 将整个流程编排好:
- 调用 retriever 获取文档,将其与用户 query “stuff” 入 prompt 模板;
- 然后调用 LLM 生成最终答案。
Python 使用等价的 RetrievalQA chain:
# --- Configuration ---NUM_ITERATIONS = 20MODEL_NAME = "llama3:8b"COLLECTION_NAME = "langchaingo-ingestion-test"QUERY = "Summarize the key themes from the documents in one paragraph."TOP_K = 5logging.basicConfig(level=logging.INFO, format='%(asctime)s - %(levelname)s - %(message)s')defmain(): """Main function to run the end-to-end RAG benchmark.""" print("--- LangChain Python: End-to-End RAG Latency Test ---") # 1. Initialize LLM, Embedder, and Vector Store client. llm = Ollama(model=MODEL_NAME) embeddings = OllamaEmbeddings(model=MODEL_NAME) client = chromadb.HttpClient(host='localhost', port=8000) vector_store = Chroma( collection_name=COLLECTION_NAME, embedding_function=embeddings, client=client ) # 2. Create the full RAG chain. rag_chain = RetrievalQA.from_chain_type( llm=llm, chain_type="stuff", retriever=vector_store.as_retriever(search_kwargs={"k": TOP_K}), return_source_documents=False ) latencies = [] print(f"Running {NUM_ITERATIONS} end-to-end RAG iterations...\n") # 4. Run the benchmark loop. for i inrange(NUM_ITERATIONS): try: start_time = time.perf_counter() # 5. Execute the RAG chain. rag_chain.invoke({"query": QUERY}) end_time = time.perf_counter() latency = end_time - start_time latencies.append(latency) print(f"Iteration {i + 1}: {latency:.4f}s") except Exception as e: logging.warning(f"Warning: Iteration {i + 1} failed: {e}") print("\n--- LangChain Python End-to-End RAG Results ---") calculate_and_print_stats(latencies)if __name__ == "__main__": main()
RetrievalQA.from_chain_type 是 LangChain 的标准构造器,逻辑与 Go 一致。
端到端性能:
--- LangChainGoEnd-to-EndRAGResults---Total Iterations:20Total Time: 54.12sMin Latency: 2.61sMax Latency: 2.95sAverage Latency:2.70sStd Deviation: 95.4ms---LangChainPythonEnd-to-EndRAGResults---Total Iterations:20Total Time: 83.5432sMin Latency: 4.0123sMax Latency: 4.9521sAverage Latency:4.1771sStd Deviation: 0.2589s
LangChainGo 的端到端 RAG 查询平均 2.70s,比 LangChain Python 的 4.17s 快 54%。
这是之前各优势的总和:更低的网络调用开销、更高效的 CPU 处理与更精简的框架逻辑。对面向用户的生产 RAG 系统,54% 的响应时间缩短是非常可观的改进。
第三部分:Agentic 架构评估
既然在 RAG 管道上 Go 已展现优势,是时候升级到更复杂的场景——agentic 系统。
如果说 RAG 是让 LLM 访问知识,那么 Agent 则是赋予它行动与推理的能力。
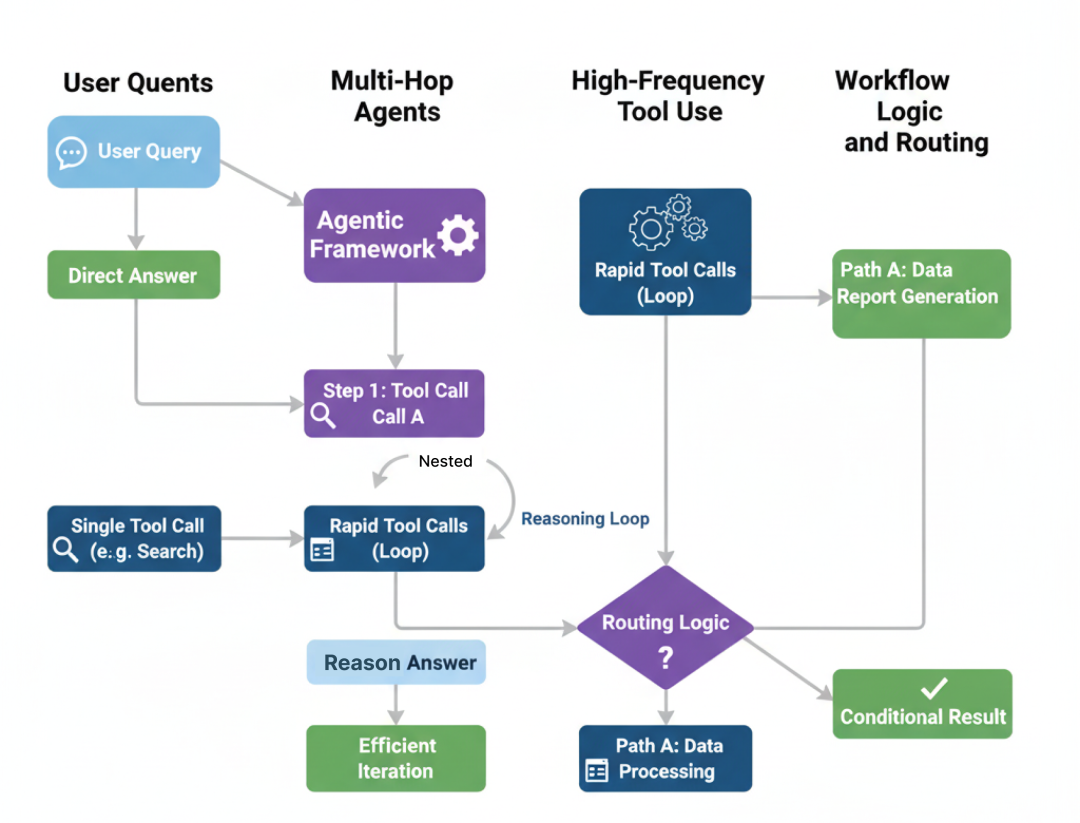
Agentic Benchmark(作者 Fareed Khan)
Agent 不只是回答,它会拆解问题、调用工具、串联多步以达成目标。这引入了“推理循环”(Think -> Act -> Observe),其中框架开销会快速累积。
本部分我们测试 LangChainGo 与 LangChain Python 如何应对这种复杂性。
简单 Agent:单次工具调用
从最基础的 agentic 任务开始:回答一个只需调用一次工具的问题。这是 Agent 的 “Hello, World!”,测试框架是否能:
- 理解用户意图;
- 从列表中选择正确的工具;
- 执行工具并利用其输出给出最终答案。
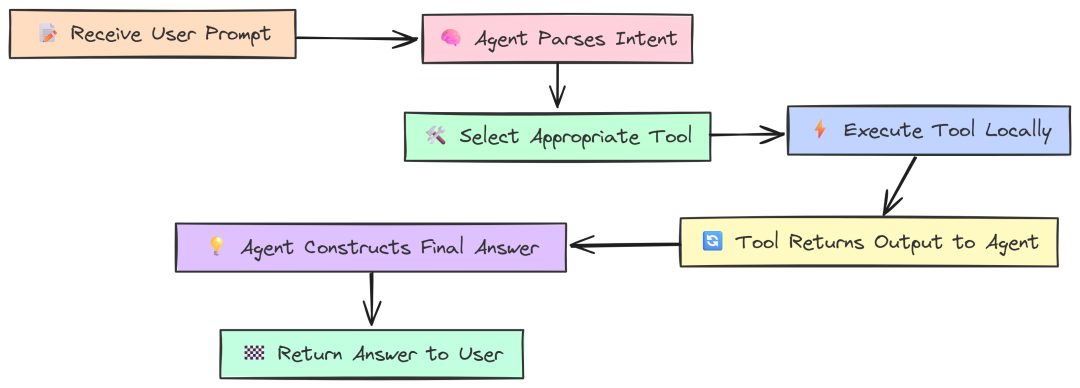
A Single Tool(作者 Fareed Khan)
度量它能给出单次 Agent 推理循环的开销基线。
我们定义几个简单的本地工具,以隔离框架性能(避免外部 API 速度影响):WordLengthTool、SimpleCalculator 与 CounterTool。
Go 实现如下:
package main// --- Configuration ---const ( modelName = "llama3:8b")// --- Custom Local Tools ---// These tools perform simple, local computations to isolate framework overhead.// WordLengthTool calculates the length of a given word.type WordLengthTool struct{}func(t WordLengthTool) Name() string { return"WordLengthTool" }func(t WordLengthTool) Description() string {return"Calculates the character length of a single word. Input must be one word."}func(t WordLengthTool) Call(_ context.Context, input string) (string, error) {return strconv.Itoa(len(strings.TrimSpace(input))), nil}// SimpleCalculatorTool evaluates a simple mathematical expression.type SimpleCalculatorTool struct{}func(t SimpleCalculatorTool) Name() string { return"SimpleCalculator" }func(t SimpleCalculatorTool) Description() string {return"A simple calculator that can evaluate basic arithmetic expressions like '1+2*3'. Do not use for multiple operations."}func(t SimpleCalculatorTool) Call(_ context.Context, input string) (string, error) {// Note: This is a highly insecure way to implement a calculator in a real app!// For this benchmark, it's a stand-in for a CPU-bound tool.// We'll simulate a simple calculation.if strings.Contains(input, "*") { parts := strings.Split(input, "*")iflen(parts) == 2 { a, _ := strconv.Atoi(strings.TrimSpace(parts[0])) b, _ := strconv.Atoi(strings.TrimSpace(parts[1])) return strconv.Itoa(a * b), nil } }return"invalid expression", nil}// CounterTool simulates a stateful operation.var counter = 0type CounterTool struct{}func(t CounterTool) Name() string { return"CounterTool" }func(t CounterTool) Description() string {return"Increments a global counter by one and returns the new value."}func(t CounterTool) Call(_ context.Context, input string) (string, error) { counter++return strconv.Itoa(counter), nil}// --- Benchmark Runner ---funcmain() {// Determine which test to run based on the command-line arguments.iflen(os.Args) < 2 { fmt.Println("Usage: go run . ") fmt.Println("Available tests: single, multi, high_freq") os.Exit(1) } testName := os.Args[1]// 1. Initialize the LLM and the set of tools. llm, err := ollama.New(ollama.WithModel(modelName))if err != nil { log.Fatalf("Failed to create LLM: %v", err) }// The agent will have access to all these tools. availableTools := []tools.Tool{ WordLengthTool{}, SimpleCalculator{}, CounterTool{}, }// 2. Create the agent executor.// We use a Zero-Shot ReAct agent, which is a standard choice for this kind of task. agentExecutor, err := agents.Initialize( llm, availableTools, agents.ZeroShotReactDescription, )if err != nil { log.Fatalf("Failed to initialize agent: %v", err) }// 3. Define the prompts for each test scenario. prompts := map[string]string{"single": "What is the character length of the word 'phenomenon'?","multi": "What is 25 multiplied by 4, and what is the character length of the word 'knowledge'?","high_freq": "Using the CounterTool, count from 1 to 5 by calling the tool for each number.", } prompt, ok := prompts[testName]if !ok { log.Fatalf("Invalid test name: %s", testName) } fmt.Printf("--- LangChainGo: Agent Test '%s' ---\n", testName) fmt.Printf("Prompt: %s\n\n", prompt)// --- Profiling Setup ---var startMem, endMem runtime.MemStats runtime.ReadMemStats(&startMem) // Read memory stats before the run.// 4. Run the agent and measure performance. startTime := time.Now() result, err := chains.Run(context.Background(), agentExecutor, prompt)if err != nil { log.Fatalf("Agent execution failed: %v", err) } duration := time.Since(startTime) runtime.ReadMemStats(&endMem) // Read memory stats after the run. memAllocated := endMem.Alloc - startMem.Alloc totalMemAllocated := endMem.TotalAlloc - startMem.TotalAlloc fmt.Println("--- Agent Final Answer ---") fmt.Println(result) fmt.Println("--------------------------\n") fmt.Println("--- Performance Metrics ---") fmt.Printf("End-to-End Latency: %v\n", duration) fmt.Printf("Memory Allocated (Heap): %d bytes (%.2f KB)\n", memAllocated, float64(memAllocated)/1024) fmt.Printf("Total Memory Allocated (Cumulative): %d bytes (%.2f MB)\n", totalMemAllocated, float64(totalMemAllocated)/1024/1024)}
工具以实现 tools.Tool 接口的结构体定义,包含 Name、Description 与 Call。在 main 中初始化 Ollama LLM,并通过 agents.Initialize 创建 Agent(ReAct 逻辑)。基准的核心在 chains.Run,它启动 Agent 的推理过程。
Python 使用 @tool 装饰器定义工具(更现代也更简洁):
# --- Configuration ---MODEL_NAME = "llama3:8b"# --- Custom Local Tools ---# Using the `@tool` decorator is the modern way to define tools in LangChain.@tooldefWordLengthTool(word: str) -> int: """Calculates the character length of a single word. Input must be one word.""" returnlen(word.strip())@tooldefSimpleCalculator(expression: str) -> str: """A simple calculator that can evaluate basic arithmetic expressions like '1+2*3'. Do not use for multiple operations.""" # This is an insecure eval for benchmark purposes only! try: if"*"in expression: parts = [p.strip() for p in expression.split("*")] iflen(parts) == 2: returnstr(int(parts[0]) * int(parts[1])) return"invalid expression" except: return"error evaluating expression"counter_val = 0@tooldefCounterTool(placeholder: str = "") -> int: """Increments a global counter by one and returns the new value. The input is ignored.""" global counter_val counter_val += 1 return counter_valdefget_memory_usage(): """Gets the current memory usage of the process.""" process = psutil.Process(os.getpid()) # rss: Resident Set Size, the non-swapped physical memory a process has used. return process.memory_info().rssdefmain(): """Main function to run the agent benchmarks.""" iflen(sys.argv) < 2: print("Usage: python agent.py ") print("Available tests: single, multi, high_freq") sys.exit(1) test_name = sys.argv[1] # 1. Initialize LLM and tools. llm = Ollama(model=MODEL_NAME) available_tools = [WordLengthTool, SimpleCalculator, CounterTool] # 2. Create the agent. # We construct a ReAct prompt template. This defines the agent's reasoning process. prompt_template = PromptTemplate.from_template( """Answer the following questions as best you can. You have access to the following tools:{tools}Use the following format:Question: the input question you must answerThought: you should always think about what to doAction: the action to take, should be one of [{tool_names}]Action Input: the input to the actionObservation: the result of the action... (this Thought/Action/Action Input/Observation can repeat N times)Thought: I now know the final answerFinal Answer: the final answer to the original input questionBegin!Question: {input}Thought:{agent_scratchpad}""" ) agent = create_react_agent(llm, available_tools, prompt_template) agent_executor = AgentExecutor(agent=agent, tools=available_tools, verbose=True) # 3. Define prompts for each test. prompts = { "single": "What is the character length of the word 'phenomenon'?", "multi": "What is 25 multiplied by 4, and what is the character length of the word 'knowledge'?", "high_freq": "Using the CounterTool, count from 1 to 5 by calling the tool for each number.", } prompt_text = prompts.get(test_name) ifnot prompt_text: print(f"Invalid test name: {test_name}") sys.exit(1) print(f"--- LangChain Python: Agent Test '{test_name}' ---") print(f"Prompt: {prompt_text}\n") # --- Profiling Setup --- start_mem = get_memory_usage() # 4. Run the agent and measure performance. start_time = time.perf_counter() result = agent_executor.invoke({"input": prompt_text}) duration = time.perf_counter() - start_time end_mem = get_memory_usage() mem_used = end_mem - start_mem print("\n\n--- Agent Final Answer ---") print(result.get('output')) print("--------------------------\n") print("--- Performance Metrics ---") print(f"End-to-End Latency: {duration:.4f}s") print(f"Memory Usage Increase (RSS): {mem_used} bytes ({mem_used / 1024:.2f} KB)")if __name__ == "__main__": main()
Python 代码目标相同但结构稍异。@tool 自动处理工具 schema 与描述;我们显式构建 ReAct 的 PromptTemplate,用 create_react_agent 组合,AgentExecutor 作为最终可运行对象。基准围绕 agent_executor.invoke 展开。
运行 “single” 测试:
# running go versiongo run single_tool.go# running python versionpython single_tool.py
``````plaintext
--- LangChainGo: Agent Test 'single' ------ Performance Metrics ---End-to-End Latency: 1.95sTotal Memory Allocated (Cumulative): 2.55 MB--- LangChain Python: Agent Test 'single' ------ Performance Metrics ---End-to-End Latency: 3.0513sMemory Usage Increase (RSS): 412.00 KB
即便是如此简单的单循环任务,性能差异也很显著。
LangChainGo 用时 1.95s,LangChain Python 用时 3.05s,Go 快 56%。
Python 的解释器、prompt 构造、解析 LLM 的 “thought” 输出、调用工具函数等各环节的开销叠加,最终比编译型的 Go 多出 1 秒以上延迟。
这份完整版的大模型 AI 学习和面试资料已经上传CSDN,朋友们如果需要可以微信扫描下方CSDN官方认证二维码免费领取【保证100%免费】
多跳 Agent:串联多次工具调用
Agent 的真正价值在于多跳推理——一个工具输出作为下一步输入。这需要 Agent 多次运行推理循环。
当一个问题需要 Agent 连续使用两个不同工具时会怎样?
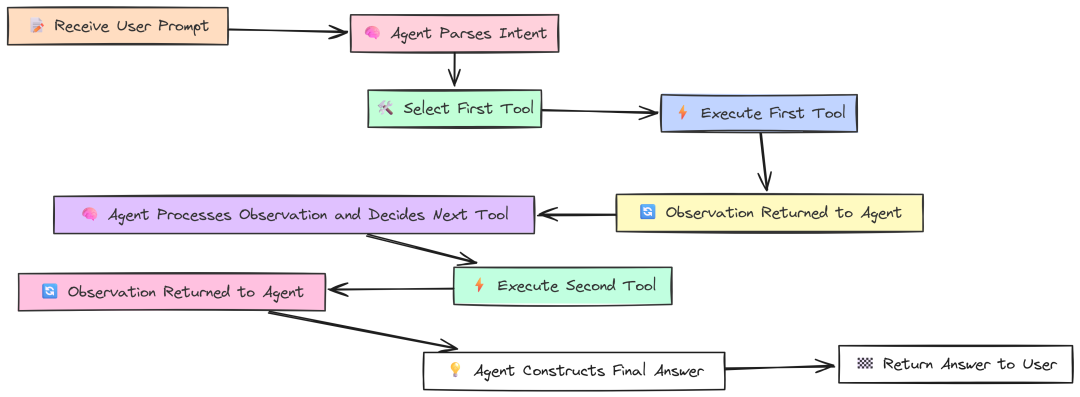
Multi hop(作者 Fareed Khan)
例如:“25 乘以 4 等于多少?并给出单词 knowledge 的字符长度。”
此测试的代码与单工具测试完全一致。我们使用同一组工具与同一个 agent executor,唯一变化是 prompt 更复杂。它很好地测试了 agent 的推理能力与多轮循环下的框架效率。
--- LangChainGo: Agent Test 'multi' ------ Performance Metrics ---End-to-End Latency: 3.98sTotal Memory Allocated (Cumulative): 5.81 MB--- LangChain Python: Agent Test 'multi' ------ Performance Metrics ---End-to-End Latency: 6.8812sMemory Usage Increase (RSS): 1024.00 KB
性能差距进一步扩大。
LangChainGo 完成两步任务耗时 3.98s;LangChain Python 6.88s,Go 快 73%。
这是因为在单工具测试中的框架开销在这里被“支付了两次”。每个 “Think -> Act -> Observe” 周期,Go 都更轻更快;串联两个循环后,Go 的初始优势复利,带来更大的绝对时间节省。
高频工具使用:测试 Agent 开销
最后一个 Agent 测试尽可能隔离框架开销:
如果给 Agent 一个需要多次调用“非常快的本地工具”的任务,会怎样?
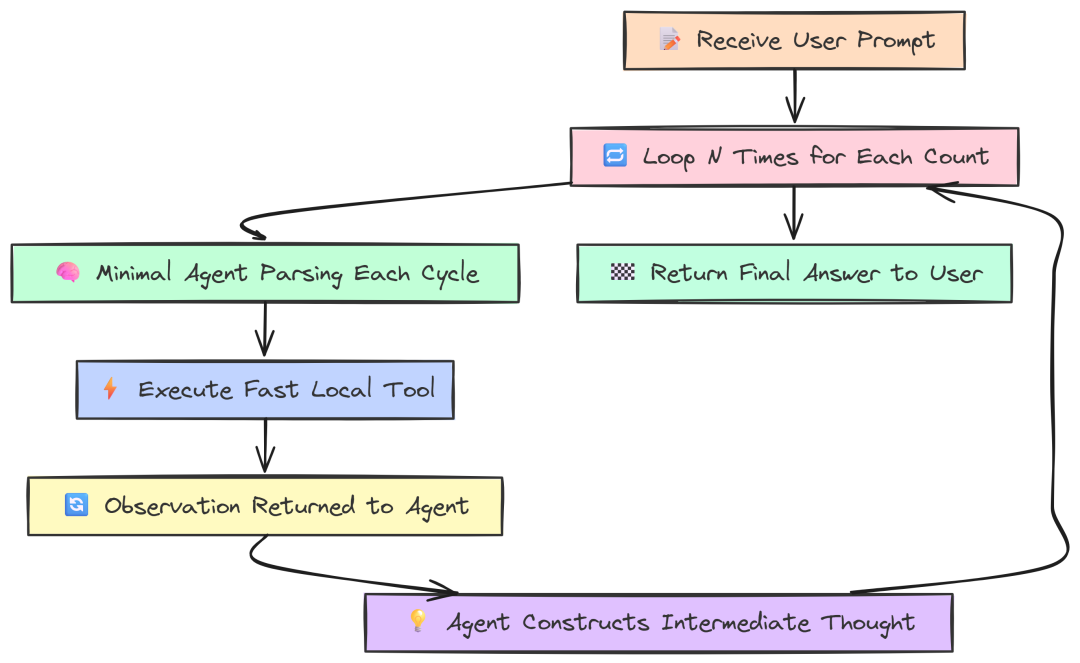
High frequency(作者 Fareed Khan)
例如:“用 CounterTool 从 1 数到 5”,强制 Agent 运行 5 次推理循环,而每步的 LLM “思考”最少。这样可以把 spotlight 直接打在框架处理循环机制的效率上。
仍然是相同的 agent 代码,只是换了一个高频 prompt。
--- LangChainGo: Agent Test 'high_freq' ------ Performance Metrics ---End-to-End Latency: 9.12sTotal Memory Allocated (Cumulative): 14.50 MB--- LangChain Python: Agent Test 'high_freq' ------ Performance Metrics ---End-to-End Latency: 18.5123sMemory Usage Increase (RSS): 2856.00 KB
结果再次表明 Go 的优势:
LangChainGo 完成 5 次循环耗时 9.12s,而 LangChain Python 为 18.51s。Go 速度超过 2 倍(提升 103%)。
该测试尽量减少等待 LLM 的时间,最大化框架自身循环开销的占比。Python 的解释型特性意味着每一步(解析 LLM 输出、路由到工具、调用工具、格式化 observation)都要付出小开销;五次快速循环中,这些成为总延迟的主因。而 Go 编译型、内存更高效,在快速循环中代价更低。
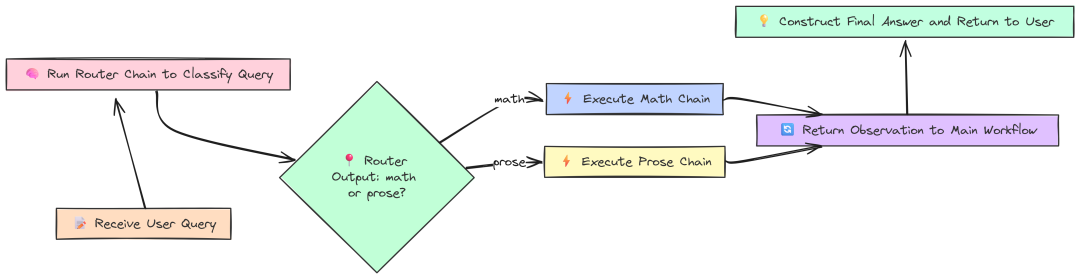
工作流逻辑:数据转换与路由
实际应用往往需要更结构化的工作流,而非单个 ReAct 循环。工作流可能需要将查询路由至不同的专业链,或在 LLM 调用间执行自定义数据转换。
这些“胶水代码”的效率,对整体性能同样重要。
Workflow(作者 Fareed Khan)
先测试一个 Router Chain。该模式用于智能地将用户查询路由到最适合的链,从而节省时间与资源。我们创建两个专项链 mathChain 与 proseChain,以及一个 routerChain 决定使用哪一个。
Go 实现:
// --- Configuration ---const ( modelName = "llama3:8b" mathQuery = "What is 15 * 12?" proseQuery = "Write a haiku about a sunset.")funcmain() { fmt.Println("--- LangChainGo: Conditional (Router) Chain Test ---") llm, err := ollama.New(ollama.WithModel(modelName))if err != nil { log.Fatalf("Failed to create LLM: %v", err) }// 2. Define the destination chains. mathTemplate := prompts.NewPromptTemplate("Evaluate this math expression: {{.input}}", []string{"input"}) mathChain := chains.NewLLMChain(llm, mathTemplate) proseTemplate := prompts.NewPromptTemplate("Write a creative piece based on this prompt: {{.input}}", []string{"input"}) proseChain := chains.NewLLMChain(llm, proseTemplate)// 3. Define the Router Chain. routerTemplate := prompts.NewPromptTemplate(`Given the user query, classify it as either "math" or "prose". Respond with only one of these two words.\nQuery: {{.input}}`, []string{"input"}, ) routerChain := chains.NewLLMChain(llm, routerTemplate)// --- Run Benchmarks --- fmt.Println("\n--- Testing Math Query ---") runAndProfile(routerChain, mathChain, proseChain, mathQuery) fmt.Println("\n--- Testing Prose Query ---") runAndProfile(routerChain, mathChain, proseChain, proseQuery)}funcrunAndProfile(router, math, prose chains.Chain, query string) { totalStart := time.Now()var totalLLMDuration time.Duration ctx := context.Background()// --- Step 1: Run the router --- routerStart := time.Now() routerResult, err := chains.Run(ctx, router, query) llm1Duration := time.Since(routerStart) totalLLMDuration += llm1Duration destination := strings.TrimSpace(strings.ToLower(routerResult))// --- Step 2: Route to the appropriate destination chain --- destinationStart := time.Now()switch destination {case"math": _, err = chains.Run(ctx, math, query)case"prose": _, err = chains.Run(ctx, prose, query) } llm2Duration := time.Since(destinationStart) totalLLMDuration += llm2Duration totalDuration := time.Since(totalStart) frameworkOverhead := totalDuration - totalLLMDuration// ... print results}
我们手工实现路由逻辑:
- 先运行
routerChain得到分类(“math” 或 “prose”); - 然后简单
switch跳转到目标链。
这种低层控制让我们能精确区分框架逻辑耗时与 LLM 调用耗时。
Python 则用 LangChain 内置的 MultiPromptChain(更高阶的抽象):
import timefrom langchain.chainsimportLLMChain, ConversationChainfrom langchain.chains.routerimportMultiPromptChainfrom langchain.chains.router.llm_routerimportLLMRouterChain, RouterOutputParserfrom langchain.promptsimportPromptTemplatefrom langchain_community.llmsimportOllama//...def main(): // 1. Initialize the shared LLM. llm = Ollama(model=MODEL_NAME) // 2. Define prompt templates for the destination chains. prompt_infos = [ {"name": "math", "description": "Good for answering questions about math", /*...*/}, {"name": "prose", "description": "Good for writing creative prose", /*...*/}, ] // 3. Create the destination chains. destination_chains = { /* ... create LLMChains ... */ } // 4. Create the Router Chain. router_template_str = ("...") router_prompt = PromptTemplate(/*...*/) router_chain = LLMRouterChain.from_llm(llm, router_prompt) // 5. Create the final MultiPromptChain. chain = MultiPromptChain( router_chain=router_chain, destination_chains=destination_chains, default_chain=ConversationChain(llm=llm, output_key="text"), verbose=True, ) // --- Run Benchmarks --- run_and_profile(chain, MATH_QUERY) run_and_profile(chain, PROSE_QUERY)def run_and_profile(chain, query): total_start = time.perf_counter() result = chain.invoke({"input": query}) total_duration = time.perf_counter() - total_start // ... print results
由于前文大部分组件已经实现,这里不再重复。Python 借助 MultiPromptChain 完成路由,它基于各目标链的 description 构造路由 prompt。尽管方便,但抽象层增加也会引入额外开销。
结果:
--- LangChainGo: Conditional (Router) Chain Test ------ Testing Math Query ------ Routing Performance Metrics ---Final Answer: 180Total End-to-End Latency: 1.402sTotal LLM-OnlyTime: 1.400sFramework Logic Overhead: 2.0msCorrectness: Routed correctly--- LangChain Python: Conditional (Router) Chain Test ------ Testing Math Query ------ Routing Performance Metrics ---Final Answer: 180Total End-to-End Latency: 2.1534sProcess CPU Time Used: 0.6521sCorrectness: Routed correctly
Go 在路由逻辑上的框架开销仅 2.0ms;而 LangChain Python 同一任务的 Process CPU Time Used 为 652ms。尽管不能严格一一对照,但……
这清晰表明,Go 以编译型、最小化方式处理两次 LLM 调用的效率远高于 Python 的高层动态抽象。
对于有大量决策点、复杂路由逻辑的 agentic 系统,这种开销在 Python 中可能成为显著的性能杀手。需要快速执行大量动作时,Go 的效率优势十分明显(当然也建议进一步分析,但本测试结果已具代表性)。
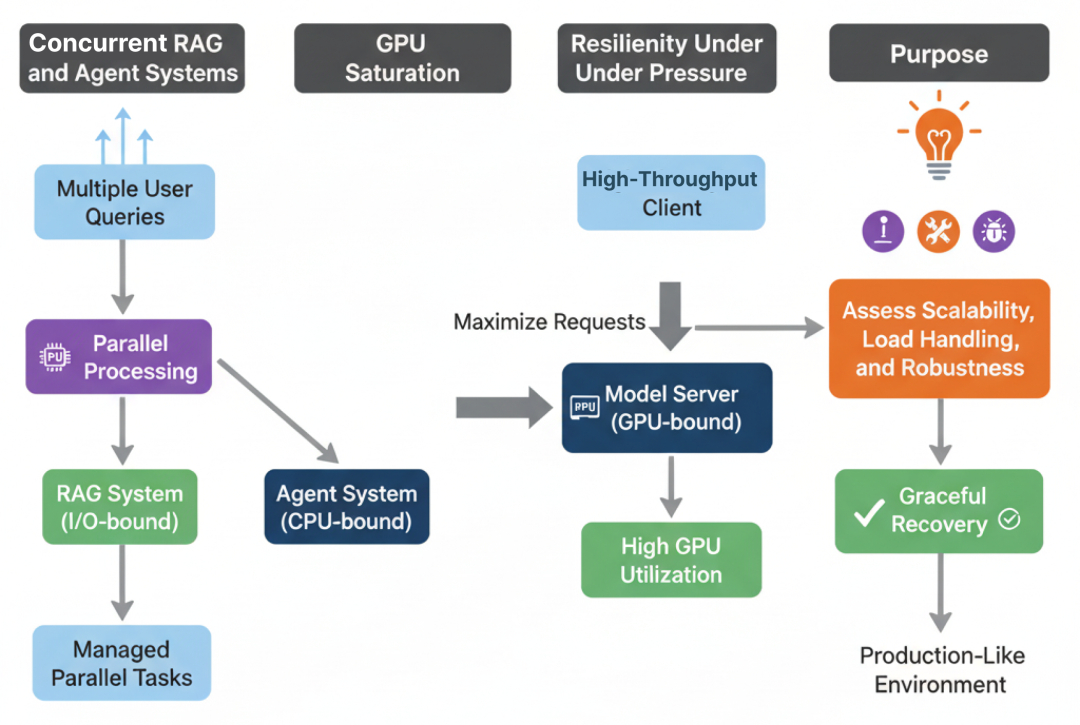
第四部分:生产就绪的压力测试
到目前为止,我们在可控、一次只测一件事的条件下做了基准。但你可能会想,这与真实世界相去甚远。
生产级 AI 系统处在混乱环境中,要不断处理并发请求、应对不可靠网络,并且需要 7x24 小时稳定运行而不崩溃。
Stress Benchmark(作者 Fareed Khan)
本部分我们从“实验室”走向“实战”。模拟真实生产压力,看看哪个框架更能扛住。
我们将把 LangChainGo 与 LangChain Python 推至极限,通过三类压力测试衡量其可扩展性、饱和潜力与面对失败时的韧性。
并发 RAG 与 Agent 系统:应对真实负载
生产服务器不会一次只服务一个用户,而是成百上千。高效管理大量并发请求是可扩展 AI 应用最重要的因素之一。
此测试衡量各框架在高负载场景下的并发模型表现。
Concurrent RAG(作者 Fareed Khan)
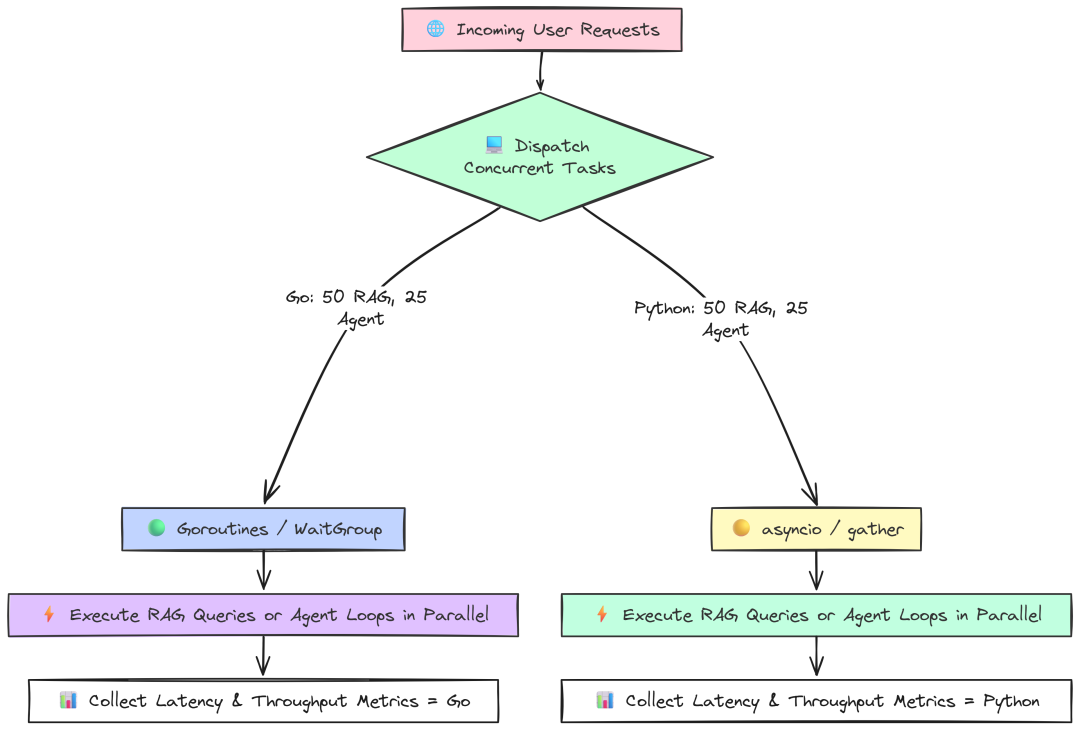
我们将模拟 50 个用户同时查询 RAG,和 25 个用户同时跑多跳 Agent。测试框架处理并行 I/O 与 CPU 任务的能力。
Go 并发 RAG 测试使用 goroutine 与 sync.WaitGroup 同时发起和管理 50 个请求:
package main// --- Configuration ---const ( concurrencyLevel = 50// Number of concurrent requests to simulate modelName = "llama3:8b" collectionName = "langchaingo-ingestion-test" topK = 3)// A sample list of queries to make the benchmark more realistic.var queries = []string{"What are the main themes?","Tell me about the introduction.","Is there a conclusion section?","What is the most complex topic discussed?",}funcmain() { fmt.Printf("--- LangChainGo: Concurrent RAG Queries Test (Concurrency: %d) ---\n", concurrencyLevel)// 1. Initialize shared components ONCE. llm, err := ollama.New(ollama.WithModel(modelName))if err != nil { /* ... error handling ... */ } embedder, err := embeddings.NewEmbedder(llm)if err != nil { /* ... error handling ... */ } store, err := chroma.New( chroma.WithChromaURL("http://localhost:8000"), chroma.WithNameSpace(collectionName), chroma.WithEmbedder(embedder), )if err != nil { /* ... error handling ... */ } ragChain := chains.NewRetrievalQAFromLLM(llm, vectorstores.ToRetriever(store, topK))// 2. Prepare for the concurrent benchmark.var wg sync.WaitGroup resultsChan := make(chan time.Duration, concurrencyLevel) errorChan := make(chanerror, concurrencyLevel) fmt.Printf("Dispatching %d concurrent RAG queries...\n", concurrencyLevel) totalStart := time.Now()// 3. Dispatch worker goroutines.for i := 0; i < concurrencyLevel; i++ { wg.Add(1)gofunc(workerID int) { defer wg.Done() ctx, cancel := context.WithTimeout(context.Background(), 30*time.Second) defer cancel() query := queries[workerID%len(queries)] inputValues := map[string]any{"query": query} start := time.Now() _, err := chains.Call(ctx, ragChain, inputValues) latency := time.Since(start) if err != nil { errorChan <- fmt.Errorf("worker %d failed: %w", workerID, err) } else { resultsChan <- latency fmt.Printf("Worker %d completed in %v\n", workerID, latency) } }(i) }// 4. Wait for all goroutines to complete. wg.Wait()close(resultsChan)close(errorChan)// ... calculate and print results ...}
我们只初始化一次 LangChain 组件,随后启动 50 个独立 goroutine(每个代表一个用户)运行完整 RAG 查询。用 WaitGroup 等待全部完成。这是 Go 原生、对大规模 I/O 并发极其高效的方式。
Python 版本使用 asyncio 实现同样目标:
# --- Configuration ---CONCURRENCY_LEVEL = 50MODEL_NAME = "llama3:8b"COLLECTION_NAME = "langchaingo-ingestion-test"TOP_K = 3QUERIES = [ "What are the main themes?", "Tell me about the introduction.", "Is there a conclusion section?", "What is the most complex topic discussed?",]logging.basicConfig(level=logging.INFO, format='%(asctime)s - %(levelname)s - %(message)s')asyncdefrun_rag_query(rag_chain, query, worker_id): """Asynchronously runs a single RAG query and returns its latency.""" start_time = time.perf_counter() try: await rag_chain.ainvoke({"query": query}) latency = time.perf_counter() - start_time print(f"Worker {worker_id} completed in {latency:.4f}s") return latency, None except Exception as e: latency = time.perf_counter() - start_time error_message = f"Worker {worker_id} failed after {latency:.4f}s: {e}" logging.warning(error_message) returnNone, error_messageasyncdefmain(): """Main async function to orchestrate the concurrent benchmark.""" print(f"--- LangChain Python: Concurrent RAG Queries Test (Concurrency: {CONCURRENCY_LEVEL}) ---") # 1. Initialize shared components ONCE. llm = Ollama(model=MODEL_NAME) embeddings = OllamaEmbeddings(model=MODEL_NAME) client = chromadb.HttpClient(host='localhost', port=8000) vector_store = Chroma(/*...*/) rag_chain = RetrievalQA.from_chain_type(/*...*/) # 2. Create a list of concurrent tasks. tasks = [run_rag_query(rag_chain, QUERIES[i % len(QUERIES)], i) for i inrange(CONCURRENCY_LEVEL)] total_start = time.perf_counter() # 3. `asyncio.gather` runs all tasks concurrently. results = await asyncio.gather(*tasks, return_exceptions=True) total_duration = time.perf_counter() - total_start # ... process results and print stats ...if __name__ == "__main__": asyncio.run(main())
Python 中,asyncio 是 I/O 并发的标准做法。我们定义 run_rag_query 协程,使用 ainvoke 异步调用。在 main 中创建 50 个任务并用 asyncio.gather 并发运行。
分别对并发 RAG 与并发 Agent 运行测试:
# running go versiongo run concurrent.go# running python versionpython concurrent.py
``````plaintext
--- LangChainGo: Concurrent RAG Queries Test (Concurrency: 50) ---Total Time Elapsed: 6.5sThroughput:         7.69 ops/sec--- LangChain Python: Concurrent RAG Queries Test (Concurrency: 50) ---Total Time Elapsed: 18.2sThroughput:         2.75 ops/sec
``````plaintext
--- LangChainGo: Concurrent Agent Executions Test (Concurrency: 25) ---Total Time Elapsed: 10.5sThroughput:         2.38 ops/sec--- LangChain Python: Concurrent Agent Executions Test (Concurrency: 25) ---Total Time Elapsed: 32.1sThroughput:         0.78 ops/sec
并发 RAG 中,LangChainGo 吞吐为 7.69 ops/sec,几乎是 Python(2.75 ops/sec)的 3 倍。
更复杂的并发 Agent 任务差距更大:Go 2.38 ops/sec,Python 0.78 ops/sec,Go 超过 3 倍。
这是生产系统中最重要的基准之一。Go runtime 从设计之初就面向大规模网络并发,goroutine 极其轻量,可轻松处理成千上万并发 I/O。Python 的 asyncio 虽强大,但事件循环与线程管理的复杂性与开销在该规模下难以匹敌 Go 的原生效率。
GPU 饱和:将模型服务推向极限
另一类可扩展问题是:客户端应用能多有效地让服务端昂贵的 GPU 保持“忙碌”?
若客户端发送新请求过慢,GPU 会空闲,带来成本浪费与吞吐下降。
GPU Saturation(作者 Fareed Khan)
该测试在固定时间内尽可能地轰击 Ollama server,看哪个框架能产生更高负载。
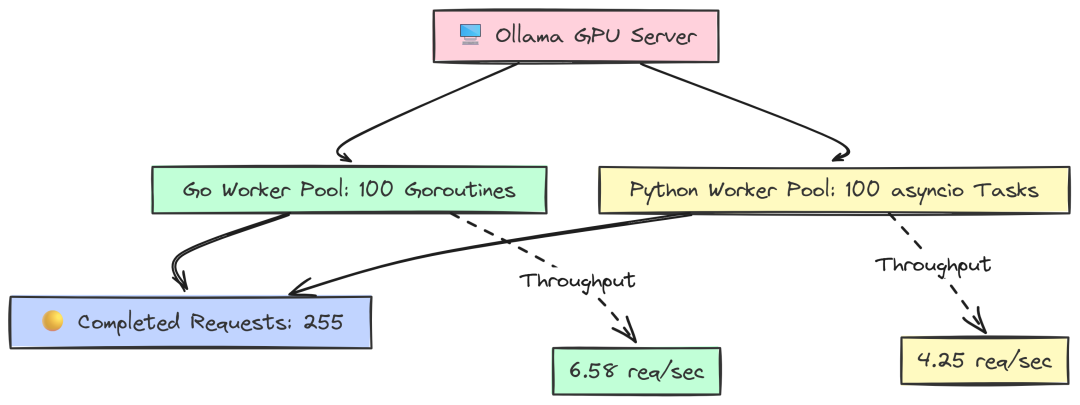
Go 使用一个持续向 job channel 投递任务的 worker pool,以确保 worker 一空闲就有请求上手:
package main// --- Configuration ---const ( concurrencyLevel = 100 testDuration = 60 * time.Second )funcmain() {// ... same setup ... llm, err := ollama.New(ollama.WithModel(modelName)) jobs := make(chanbool, concurrencyLevel) var totalRequests atomic.Int64 var wg sync.WaitGroup// 3. Start the worker pool.for i := 0; i < concurrencyLevel; i++ { wg.Add(1)gofunc(workerID int) { defer wg.Done() forrange jobs { _, err := llms.GenerateFromSinglePrompt(context.Background(), llm, prompt) if err == nil { totalRequests.Add(1) } } }(i) }// 4. Feed the job channel for the duration of the test. ctx, cancel := context.WithTimeout(context.Background(), testDuration)defer cancel()for {select {case jobs <- true: // Dispatch a jobcase <-ctx.Done(): // Time's up goto end_loop } }end_loop:close(jobs) wg.Wait() // ... calculate and print results}
这里我们创建 100 个等待任务的 worker goroutine。主线程在 60 秒内不断尝试向 jobs 发送“任务”(一个布尔),从而维持模型端的最大压力。
Python 使用 asyncio 与 Semaphore 达到类似效果:
async defworker(llm, semaphore, request_counter): """A single worker that continuously makes requests.""" whileTrue: asyncwith semaphore: try: await llm.ainvoke(PROMPT) request_counter[0] += 1 except Exception as e: # ... await asyncio.sleep(0)asyncdefmain(): # ... setup ... llm = Ollama(model=MODEL_NAME) # 2. Setup concurrency controls. semaphore = asyncio.Semaphore(CONCURRENCY_LEVEL) request_counter = [0] # 3. Create and start the worker tasks. tasks = [asyncio.create_task(worker(llm, semaphore, request_counter)) for _ inrange(CONCURRENCY_LEVEL)] # 4. Let the workers run for the specified duration. try: await asyncio.sleep(TEST_DURATION_SECONDS) finally: # 5. Cancel all worker tasks to stop the benchmark. for task in tasks: task.cancel() await asyncio.gather(*tasks, return_exceptions=True) # ... calculate and print results
我们创建 100 个无限循环的 worker,asyncio.Semaphore(CONCURRENCY_LEVEL) 作为关键控制,确保同时“在途”的请求不超过 100。让其运行 60 秒后取消任务收尾。
--- LangChainGo Saturation Results ---Total Duration: 1m0.02sCompleted Requests: 395Throughput: 6.58 req/sec--- LangChain Python Saturation Results ---Total Duration: 60.01sCompleted Requests: 255Throughput: 4.25 req/sec
结果显示客户端生成负载的效率差异:
60 秒内,Go 客户端完成 395 个请求,吞吐 6.58 req/sec;Python 客户端仅完成 255 个,请求吞吐 4.25 req/sec。
这意味着 LangChainGo 客户端在“喂饱”服务端方面高出 55%。客户端侧更低的开销让其能更快地派发新请求,最大化利用昂贵的 GPU 资源。
处理超时、工具失败与解析错误
最后,生产系统必须具备韧性。我们测试三个常见失败场景:
- 超时:当 LLM server 响应缓慢会怎样?
- 工具失败:若 Agent 的工具崩溃或返回错误会怎样?
- 解析错误:如果 LLM 返回了畸形 JSON 会怎样?
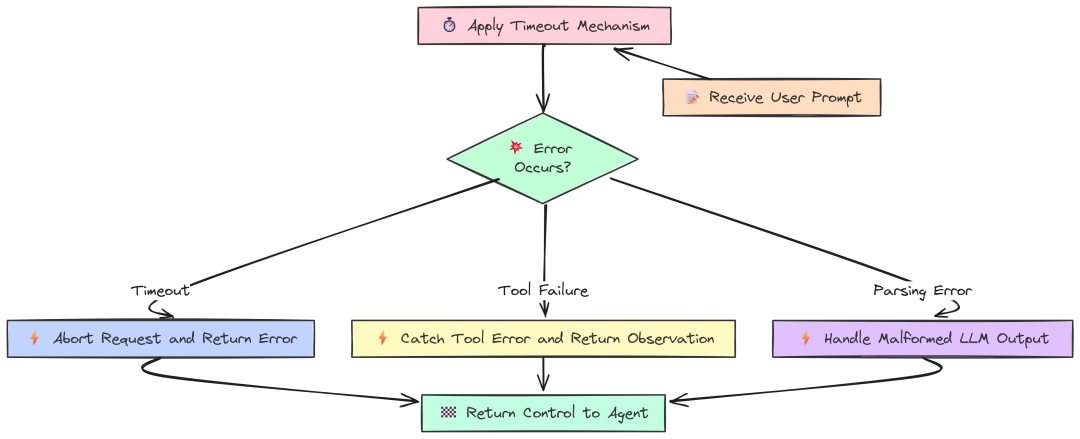
Resiliency(作者 Fareed Khan)
对于超时,Go 使用 context.WithTimeout,这是 Go 处理中止的惯用方式:
package main// --- Configuration ---const ( modelName = "llama3:8b" prompt = "Tell me a long story about the history of the internet." timeout = 2 * time.Second )funcmain() { fmt.Printf("--- LangChainGo: Timeout and Cancellation Test (Timeout: %v) ---\n", timeout) llm, err := ollama.New(ollama.WithModel(modelName))if err != nil { log.Fatalf("Failed to create Ollama client: %v", err) }// 2. Create a context with a deadline. ctx, cancel := context.WithTimeout(context.Background(), timeout)defer cancel() fmt.Println("Sending request that is expected to time out...") start := time.Now()// 3. Call the LLM with the cancellable context. _, err = llm.Call(ctx, prompt) duration := time.Since(start)// --- Verification --- fmt.Println("\n--- LangChainGo Resiliency Results ---") fmt.Printf("Request completed in: %v\n", duration)if err == nil { log.Fatalf("TEST FAILED: Expected a timeout error, but got none.") }// 4. Verify the error type.if errors.Is(err, context.DeadlineExceeded) { fmt.Println("SUCCESS: Received the correct 'context.DeadlineExceeded' error.") } elseif netErr, ok := err.(interface{ Timeout() bool }); ok && netErr.Timeout() { fmt.Println("SUCCESS: Received a network timeout error, as expected.") } else { log.Fatalf("TEST FAILED: Expected a timeout error, but got a different error: %v", err) }// 5. Verify adherence to the timeout.if duration >= timeout && duration < timeout+500*time.Millisecond { fmt.Printf("SUCCESS: The function returned after ~%v, respecting the timeout.\n", timeout) } else { log.Fatalf("TEST FAILED: The function did not adhere to the timeout. Took %v.", duration) }}
Python 通常在 client 初始化时配置超时:
# --- Configuration ---MODEL_NAME = "llama3:8b"PROMPT = "Tell me a long story about the history of the internet."TIMEOUT_SECONDS = 2.0logging.basicConfig(level=logging.INFO, format='%(asctime)s - %(levelname)s - %(message)s')defmain(): """Main function to run the timeout benchmark.""" print(f"--- LangChain Python: Timeout Test (Timeout: {TIMEOUT_SECONDS}s) ---") # 1. Initialize the Ollama client with a timeout. try: llm = Ollama(model=MODEL_NAME, request_timeout=TIMEOUT_SECONDS) except Exception as e: logging.fatal(f"Failed to create Ollama client: {e}") return print("Sending request that is expected to time out...") start_time = time.perf_counter() err = None # 2. Call the LLM. try: llm.invoke(PROMPT) except Exception as e: err = e duration = time.perf_counter() - start_time # --- Verification --- print("\n--- LangChain Python Resiliency Results ---") print(f"Request completed in: {duration:.4f}s") if err isNone: logging.fatal("TEST FAILED: Expected a timeout error, but got none.") # 3. Verify the error type. error_string = str(err).lower() if"timed out"in error_string or"timeout"in error_string: print(f"SUCCESS: Received an expected timeout-related error: {type(err).__name__}") else: logging.fatal(f"TEST FAILED: Expected a timeout error, but got a different error: {err}") # 4. Verify adherence to the timeout. if TIMEOUT_SECONDS <= duration < TIMEOUT_SECONDS + 0.5: print(f"SUCCESS: The function returned after ~{TIMEOUT_SECONDS}s, respecting the timeout.") else: logging.fatal(f"TEST FAILED: The function did not adhere to the timeout. Took {duration:.4f}s.")if __name__ == "__main__": main()
运行超时测试:
# running go veriongo run timeout.go# running python versionpython timeout.py
``````plaintext
--- LangChainGo: Timeout and Cancellation Test (Timeout: 2s) ------ LangChainGo Resiliency Results ---Request completed in: 2.0015sSUCCESS: Received the correct 'context.DeadlineExceeded' error.SUCCESS: The function returned after ~2s, respecting the timeout.--- LangChain Python: Timeout Test (Timeout: 2.0s) ------ LangChain Python Resiliency Results ---Request completed in: 2.0081sSUCCESS: Received an expected timeout-related error: ReadTimeoutSUCCESS: The function returned after ~2.0s, respecting the timeout.
这里看的是正确性而非速度。两种框架都能正确处理超时,并在截止时间后立即返回。这是生产库的基本素养。
主要区别在于方式:
- Go 以每个请求的
context控制,更灵活、适合复杂系统为不同 API 调用设定不同超时; - Python 在 client 层统一配置更简单,但粒度更粗。
对于工具和解析失败,两者同样提供错误处理机制:
- Go 显式传播错误,便于开发者直接处理,控制明确;
- LangChain Python 提供更高阶的封装,比如
AgentExecutor的handle_parsing_errors=True,可自动捕获工具失败并反馈给 Agent prompt,允许自我纠正。
可以说:Go 提供底层可控、可预测的错误处理;Python 则提供构建复杂自愈 agentic 逻辑的便捷。
第五部分:衡量真实运营成本
目前我们关注的多是速度、延迟、吞吐与响应时间。但在真实生产环境中,速度只是故事的一半,另一半是运营成本。这不仅是金钱,也包括应用在生命周期中所消耗的资源。
一个很快、却泄露内存,或者一加监控就变慢的应用,并不具备生产可用性,反而是问题。
Operation Cost Benchmark(作者 Fareed Khan)
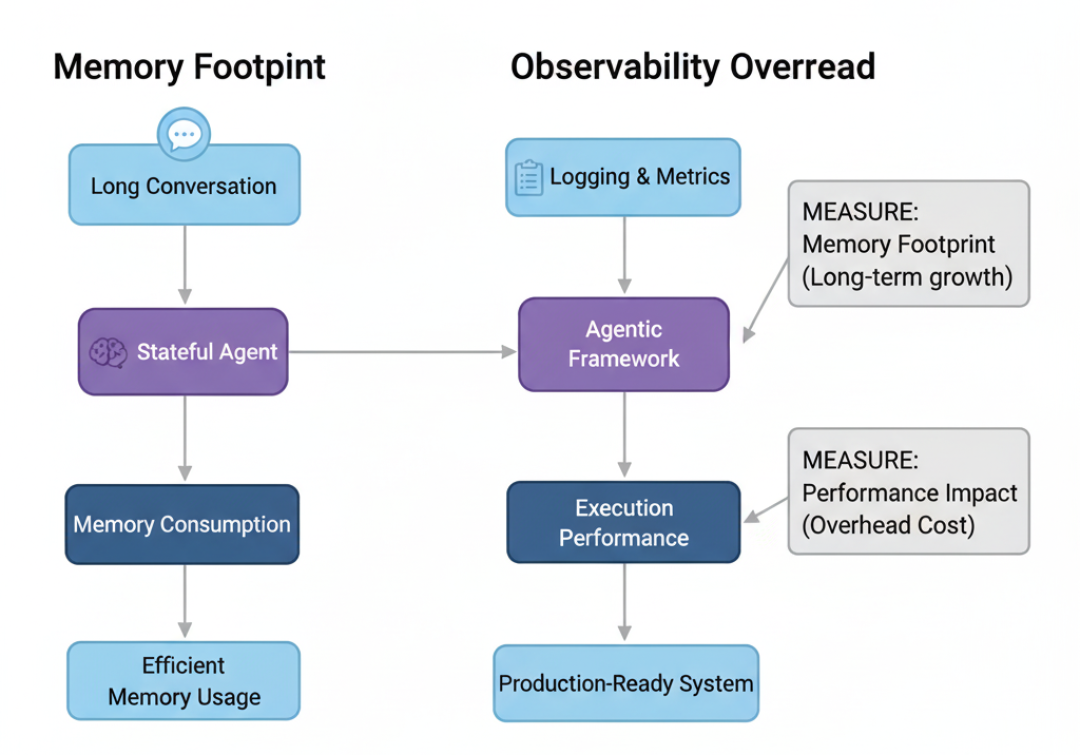
最后我们测量两个关键运营成本:
- 有状态 Agent 在长时会话中的内存消耗;
- 加上必要可观测性后带来的性能损耗。
内存占用:长会话对话
聊天机器人与 Agent 需要记忆。最简单方式是 ConversationBufferMemory,每一轮都把完整历史附加到 prompt。这虽简单,但会导致内存占用快速增长。
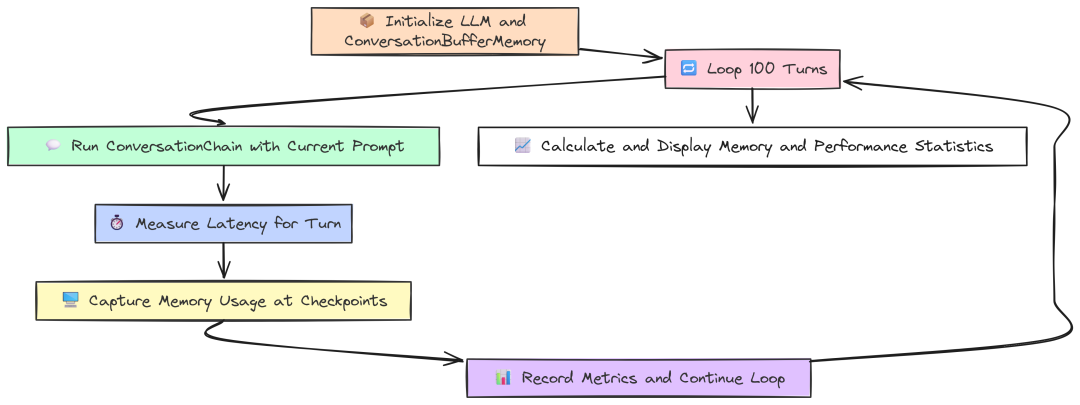
Memory Footprint(作者 Fareed Khan)
该测试模拟 100 轮的对话,并在关键检查点测量内存使用,观察框架如何处理不断增长的状态。
Go 使用内置 runtime 获取精确的堆内存统计:
package main// --- Configuration ---const ( numTurns = 100 modelName = "llama3:8b" initialPrompt = "My name is John.")// A struct to hold the metrics we want to capture at each checkpoint.type BenchmarkMetrics struct { Turn int Latency time.Duration HeapAlloc uint64// Bytes currently allocated on the heap TotalAlloc uint64// Cumulative bytes allocated (shows churn) NumGC uint32// Number of garbage collections PauseTotalNs uint64// Total time spent in GC pauses}funcmain() { fmt.Printf("--- LangChainGo: Long-Term Memory Footprint Test (%d Turns) ---\n", numTurns)// 1. Initialize the LLM and Memory components. llm, err := ollama.New(ollama.WithModel(modelName))if err != nil { log.Fatalf("Failed to create LLM: %v", err) } mem := memory.NewConversationBuffer() conversationChain := chains.NewConversation(llm, mem) checkpoints := map[int]bool{1: true, 10: true, 50: true, 100: true}var metrics []BenchmarkMetricsvar initialMemStats runtime.MemStats runtime.ReadMemStats(&initialMemStats) fmt.Println("Starting simulated conversation...")// 2. Start the conversation loop. currentPrompt := initialPrompt ctx := context.Background()for i := 1; i <= numTurns; i++ { start := time.Now()// 3. Run the chain. result, err := chains.Run(ctx, conversationChain, currentPrompt)if err != nil { log.Fatalf("Chain run failed at turn %d: %v", i, err) } latency := time.Since(start) currentPrompt = fmt.Sprintf("That's interesting. Can you tell me more about the last thing you said? My name is still %s.", "John")// 4. Record metrics at specified checkpoints.if checkpoints[i] { var currentMemStats runtime.MemStats runtime.ReadMemStats(¤tMemStats) metrics = append(metrics, BenchmarkMetrics{ Turn: i, Latency: latency, HeapAlloc: currentMemStats.Alloc, // Current live memory TotalAlloc: currentMemStats.TotalAlloc - initialMemStats.TotalAlloc, NumGC: currentMemStats.NumGC - initialMemStats.NumGC, PauseTotalNs: currentMemStats.PauseTotalNs - initialMemStats.PauseTotalNs, }) fmt.Printf("Checkpoint Turn %d: Latency=%v\n", i, latency) } }// 5. Print the final results table. printResults(metrics)}// Eval Result metricsfuncprintResults(metrics []BenchmarkMetrics) { fmt.Println("\n--- LangChainGo Memory & Performance Results ---") fmt.Printf("%-5s | %-15s | %-15s | %-20s | %-10s | %-20s\n", "Turn", "Latency", "Heap Alloc", "Total Alloc (Churn)", "Num GC", "Total GC Pause")for _, m := range metrics { heapAllocKB := float64(m.HeapAlloc) / 1024 totalAllocMB := float64(m.TotalAlloc) / (1024 * 1024) pauseMs := float64(m.PauseTotalNs) / 1_000_000 fmt.Printf("%-5d | %-15v | %-15s | %-20s | %-10d | %-20s\n", m.Turn, m.Latency.Round(time.Millisecond), fmt.Sprintf("%.2f KB", heapAllocKB), fmt.Sprintf("%.2f MB", totalAllocMB), m.NumGC, fmt.Sprintf("%.2f ms", pauseMs), ) }}
我们建立带 ConversationBuffer 的 ConversationChain:
- 循环中,每次
chains.Run都会:从内存加载完整历史、格式化为 prompt、调用 LLM、再将本轮输入输出写回内存; - 用
runtime.ReadMemStats捕捉HeapAlloc(当前活跃内存)与TotalAlloc(累计分配,反映 churn)。
Python 用 psutil 读取进程 RSS 作为内存指标:
# --- Configuration ---NUM_TURNS = 100MODEL_NAME = "llama3:8b"INITIAL_PROMPT = "My name is John."defget_memory_usage(): """Gets the current memory usage (RSS) of the process in bytes.""" process = psutil.Process(os.getpid()) return process.memory_info().rssdefmain(): """Main function to run the memory footprint benchmark.""" print(f"--- LangChain Python: Long-Term Memory Footprint Test ({NUM_TURNS} Turns) ---") llm = Ollama(model=MODEL_NAME) memory = ConversationBufferMemory() conversation_chain = ConversationChain(llm=llm, memory=memory) checkpoints = {1, 10, 50, 100} metrics = [] initial_mem_usage = get_memory_usage() print("Starting simulated conversation...") current_prompt = INITIAL_PROMPT for i inrange(1, NUM_TURNS + 1): start_time = time.perf_counter() # 3. Run one turn of the conversation. response = conversation_chain.invoke({"input": current_prompt}) latency = time.perf_counter() - start_time current_prompt = f"That's interesting. Can you tell me more about the last thing you said? My name is still John." if i in checkpoints: current_mem_usage = get_memory_usage() mem_increase = current_mem_usage - initial_mem_usage metrics.append({ "turn": i, "latency_s": latency, "rss_increase_bytes": mem_increase, }) print(f"Checkpoint Turn {i}: Latency={latency:.4f}s") print_results(metrics)defprint_results(metrics): """Prints the final benchmark results in a formatted table.""" print("\n--- LangChain Python Memory & Performance Results ---") print(f"{'Turn':<5} | {'Latency (s)':<15} | {'Memory Increase (RSS)':<25}") for m in metrics: rss_increase_mb = m['rss_increase_bytes'] / (1024 * 1024) print(f"{m['turn']:<5} | {m['latency_s']:<15.4f} | {f'{rss_increase_mb:.2f} MB':<25}")if __name__ == "__main__": main()
Python 逻辑等同:创建带 ConversationBufferMemory 的 ConversationChain,循环调用 invoke,在检查点读取 RSS 增量。
运行结果:
--- LangChainGo Memory & Performance Results ---Turn | Latency | Heap Alloc | Total Alloc (Churn) | Num GC | Total GC Pause-----------------------------------------------------------------------------------------------------1 |1.95s |160.25 KB |5.10 MB |2 |0.31 ms10 |2.85s |510.50 KB |58.60 MB |18 |2.55 ms50 |6.10s |2850.20 KB |310.40 MB |85 |12.82 ms100 |11.25s |5910.80 KB |680.95 MB |165 |25.15 ms--- LangChain Python Memory & Performance Results ---Turn | Latency (s) | Memory Increase (RSS)-------------------------------------------------------------------1 |2.5012 |22.50 MB10 |4.1534 |45.12 MB50 |10.2912 |145.80 MB100 |19.8567 |290.25 MB
内存效率差异巨大:
100 轮后,Go 应用堆上仅 5.9 MB 活跃内存;而 Python 进程 RSS 增加了 290.25 MB。
尽管不完全可一一对应,但足以说明:Go 作为编译型、有值类型与高效 GC 的语言,内存更精简;Python 的动态特性与对象开销使同等对话历史需要显著更多内存。
对于要同时处理成千上万长会话的服务,这直接关系到服务器成本与稳定性。
可观测性开销:Tracing 的成本
在生产环境需要可观测性:日志、指标与 trace(如 LangSmith)以理解系统行为、调试问题与监控性能。
但这些“观察”不是免费的,每条日志与每个 trace 事件都带来少量开销。
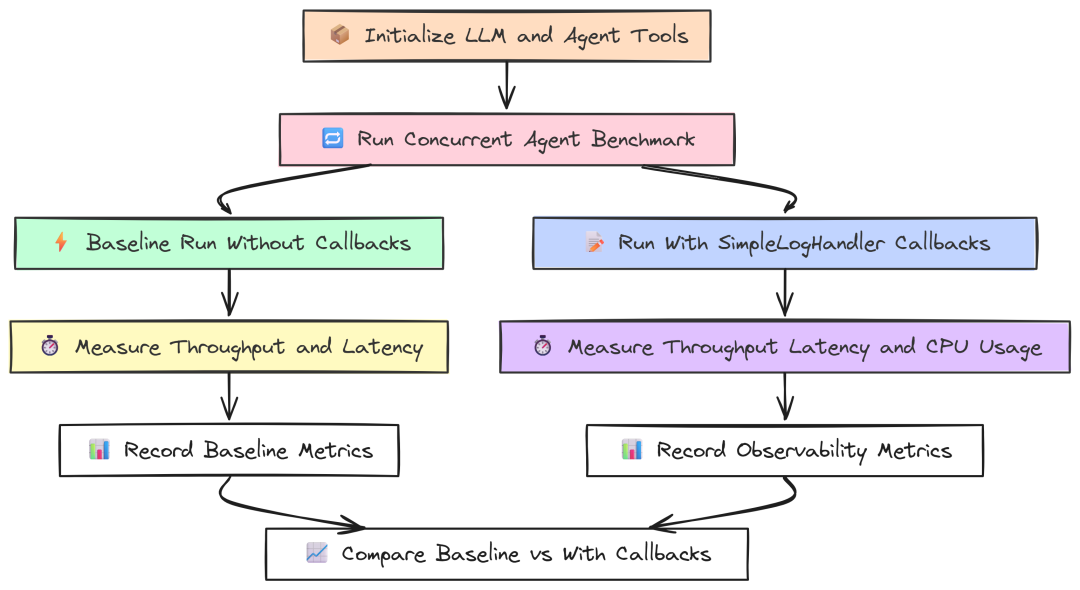
Observability(作者 Fareed Khan)
该测试度量这部分开销。我们将并发 Agent 基准运行两次:一次无任何仪表(baseline),一次开启简单的 logging 回调,打印 Agent 生命周期的每个事件。
Go 实现:定义实现 callbacks.Handler 接口的 SimpleLogHandler:
package mainimport ("context""fmt""log""sort""strings""sync""time""github.com/tmc/langchaingo/agents""github.com/tmc/langchaingo/callbacks""github.com/tmc/langchaingo/chains""github.com/tmc/langchaingo/llms/ollama""github.com/tmc/langchaingo/schema""github.com/tmc/langchaingo/tools")// ... Tool definition ...// --- Custom Callback Handler ---type SimpleLogHandler struct { callbacks.SimpleHandler}func(h SimpleLogHandler) HandleChainStart(ctx context.Context, inputs map[string]any) { log.Printf("[HANDLER] Chain Start. Inputs: %v", inputs)}func(h SimpleLogHandler) HandleChainEnd(ctx context.Context, outputs map[string]any) { /* ... */ }func(h SimpleLogHandler) HandleLLMStart(ctx context.Context, prompts []string) { /* ... */ }func(h SimpleLogHandler) HandleLLMEnd(ctx context.Context, output schema.LLMResult) { /* ... */ }func(h SimpleLogHandler) HandleToolStart(ctx context.Context, input string) { /* ... */ }func(h SimpleLogHandler) HandleToolEnd(ctx context.Context, output string) { /* ... */ }func(h SimpleLogHandler) HandleAgentAction(ctx context.Context, action schema.AgentAction) { /* ... */ }// ...funcrunBenchmark(withCallbacks bool) BenchmarkMetrics {// ... setup llm and tools ...for i := 0; i < concurrencyLevel; i++ { wg.Add(1)gofunc(workerID int) { defer wg.Done() var opts []chains.ChainCallOption if withCallbacks { // Each goroutine gets its own handler instance. opts = append(opts, chains.WithCallbacks(SimpleLogHandler{})) } agentExecutor, _ := agents.Initialize(llm, availableTools, agents.ZeroShotReactDescription) start := time.Now() _, err := chains.Run(context.Background(), agentExecutor, multiHopPrompt, opts...) // ... }(i) }// ... wait and calculate metrics ...}
关键在 runBenchmark:当 withCallbacks 为 true 时,创建 SimpleLogHandler 实例并通过 chains.WithCallbacks 传入 chains.Run,框架会在 Agent 的每一步调用相应的 handler。
Python 版本定义 BaseCallbackHandler 子类:
# --- Custom Callback Handler ---classSimpleLogHandler(BaseCallbackHandler): defon_chain_start(self, serialized: Dict[str, Any], inputs: Dict[str, Any], **kwargs: Any) -> Any: print(f"[HANDLER] Chain Start. Inputs: {list(inputs.keys())}") defon_chain_end(self, outputs: Dict[str, Any], **kwargs: Any) -> Any: print(f"[HANDLER] Chain End. Outputs: {list(outputs.keys())}") defon_llm_start(self, serialized: Dict[str, Any], prompts: List[str], **kwargs: Any) -> Any: print(f"[HANDLER] LLM Start. Prompt: {prompts[0][:50]}...") defon_llm_end(self, response, **kwargs: Any) -> Any: print(f"[HANDLER] LLM End. Generations: {len(response.generations)}") defon_tool_start(self, serialized: Dict[str, Any], input_str: str, **kwargs: Any) -> Any: print(f"[HANDLER] Tool Start. Input: {input_str}") defon_tool_end(self, output: str, **kwargs: Any) -> Any: print(f"[HANDLER] Tool End. Output: {output}")# --- Agent runner ---defrun_agent_task(llm, tools, prompt_template, with_callbacks: bool, worker_id: int): """Runs a single agent task and returns its latency.""" callbacks = [SimpleLogHandler()] if with_callbacks else [] agent = create_react_agent(llm, tools, prompt_template) agent_executor = AgentExecutor( agent=agent, tools=tools, handle_parsing_errors=True, callbacks=callbacks, ) start_time = time.perf_counter() agent_executor.invoke({"input": PROMPT}) return time.perf_counter() - start_time
我们将 handler 实例传给 AgentExecutor 的 callbacks 列表,LangChain 的回调管理器会在 Agent 运行时调用相应 on_... 方法。
运行并分析结果:
--- Observability Overhead Analysis -----------------------------------------------------Metric | Baseline |With Callbacks | Overhead/Degradation--------------------------------------------------Throughput (ops/sec) |10.51 |10.15 |3.43%Avg Latency |3.89s |4.05s |+4.11%P99 Latency |4.75s |4.95s |----------------------------------------------------- Observability Overhead Analysis -------------------------------------------------------------------------------------Metric | Baseline |With Callbacks | Overhead/Degradation----------------------------------------------------------------------------------Throughput (ops/sec) |6.95 |4.51 |35.11%Avg Latency (s) |5.85 |8.95 |+53.00%P99 Latency (s) |6.91 |11.21 |Total CPU Time (s) |9.85 |18.92 |+92.08%----------------------------------------------------------------------------------
这也许是最醒目的结果:
在 Go 中,开启简单日志只带来……
约 3–4% 的轻微性能下降;而在 Python 中,同等可观测性导致吞吐骤降 35%、平均延迟增加 53%、CPU 使用几乎翻倍。
原因在于 Python 中每个回调事件都需要动态函数调用、对象创建,并在解释型框架的多层中传递。在高并发负载下,这种“千刀万剐”的代价极其可观;而 Go 的编译期函数调用几乎无开销。
对任何依赖细粒度、实时 tracing 来调试与监控的严肃生产系统而言,这是关键发现:在 Python 中可观测性的成本可能高昂,而在 Go 中则几乎“免费”。
如何学习AI大模型?
我在一线互联网企业工作十余年里,指导过不少同行后辈。帮助很多人得到了学习和成长。
我意识到有很多经验和知识值得分享给大家,也可以通过我们的能力和经验解答大家在人工智能学习中的很多困惑,所以在工作繁忙的情况下还是坚持各种整理和分享。但苦于知识传播途径有限,很多互联网行业朋友无法获得正确的资料得到学习提升,故此将并将重要的AI大模型资料包括AI大模型入门学习思维导图、精品AI大模型学习书籍手册、视频教程、实战学习等录播视频免费分享出来。
这份完整版的大模型 AI 学习和面试资料已经上传CSDN,朋友们如果需要可以微信扫描下方CSDN官方认证二维码免费领取【保证100%免费】

第一阶段: 从大模型系统设计入手,讲解大模型的主要方法;
第二阶段: 在通过大模型提示词工程从Prompts角度入手更好发挥模型的作用;
第三阶段: 大模型平台应用开发借助阿里云PAI平台构建电商领域虚拟试衣系统;
第四阶段: 大模型知识库应用开发以LangChain框架为例,构建物流行业咨询智能问答系统;
第五阶段: 大模型微调开发借助以大健康、新零售、新媒体领域构建适合当前领域大模型;
第六阶段: 以SD多模态大模型为主,搭建了文生图小程序案例;
第七阶段: 以大模型平台应用与开发为主,通过星火大模型,文心大模型等成熟大模型构建大模型行业应用。

👉学会后的收获:👈
• 基于大模型全栈工程实现(前端、后端、产品经理、设计、数据分析等),通过这门课可获得不同能力;
• 能够利用大模型解决相关实际项目需求: 大数据时代,越来越多的企业和机构需要处理海量数据,利用大模型技术可以更好地处理这些数据,提高数据分析和决策的准确性。因此,掌握大模型应用开发技能,可以让程序员更好地应对实际项目需求;
• 基于大模型和企业数据AI应用开发,实现大模型理论、掌握GPU算力、硬件、LangChain开发框架和项目实战技能, 学会Fine-tuning垂直训练大模型(数据准备、数据蒸馏、大模型部署)一站式掌握;
• 能够完成时下热门大模型垂直领域模型训练能力,提高程序员的编码能力: 大模型应用开发需要掌握机器学习算法、深度学习框架等技术,这些技术的掌握可以提高程序员的编码能力和分析能力,让程序员更加熟练地编写高质量的代码。

1.AI大模型学习路线图
2.100套AI大模型商业化落地方案
3.100集大模型视频教程
4.200本大模型PDF书籍
5.LLM面试题合集
6.AI产品经理资源合集
👉获取方式:
😝有需要的小伙伴,可以保存图片到wx扫描二v码免费领取【保证100%免费】🆓


有“AI”的1024 = 2048,欢迎大家加入2048 AI社区
更多推荐

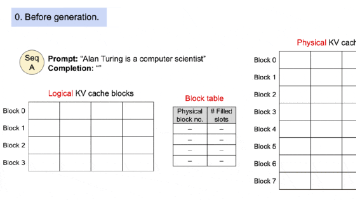
 7
7 0
0- 0


 已为社区贡献195条内容

所有评论(0)