MetaComputing AI PC with Framework Laptop 13 硬件测评
MetaComputing AI PC + Framework Laptop 13 的组合,是一台极具特色和前瞻性的设备。它在多核CPU性能、系统响应速度、内存带宽和集成GPU性能上带来了远超传统ARM笔记本甚至部分X86轻薄本的惊喜表现。模块化设计赋予了它长久的生命力。
本次测试基于 MetaComputing AI PC with Framework Laptop 13,系统为 Debian GNU/Linux 12.11(bookworm)aarch64,内核版本 Linux 6.6.89。所有测试均在系统刚启动、无额外后台负载的情况下进行,结果更偏向理论性能上限,实际日常使用中会受功耗策略、温控与负载情况影响。
基础信息
系统信息
roma@debian ~> fastfetch
        _,met$$$$$gg.          roma@debian
     ,g$$$$$$$$$$$$$$$P.       -----------
   ,g$$P""       """Y$$.".     OS: Debian GNU/Linux 12.11 (bookworm) aarch64
  ,$$P'              `$$$.     Host: MC FML13V04 Board (1.0)
',$$P       ,ggs.     `$$b:    Kernel: Linux 6.6.89-cix-build-generic
`d$$'     ,$P"'   .    $$$     Uptime: 11 mins
 $$P      d$'     ,    $$P     Packages: 2632 (dpkg)
 $$:      $$.   -    ,d$$'     Shell: fish 3.6.0
 $$;      Y$b._   _,d$P'       Display (BOE095F): 2256x1504 @ 2x in 13", 60 Hz [Built-in]
 Y$$.    `.`"Y$$$$P"'          DE: GNOME 43.9
 `$$b      "-.__               WM: Mutter (Wayland)
  `Y$$b                        WM Theme: Adwaita
   `Y$$.                       Theme: Adwaita [GTK2/3/4]
     `$$b.                     Icons: Adwaita [GTK2/3/4]
       `Y$$b.                  Font: Cantarell (11pt) [GTK2/3/4]
         `"Y$b._               Cursor: Adwaita (24px)
             `""""             Terminal: /dev/pts/0
                               CPU: Cortex-A720*2 + Cortex-A520*4 + Cortex-A720*6 (12) @ 2.60 GHz
                               GPU: Mali-G720-Immortalis [Integrated]
                               Memory: 7.74 GiB / 30.94 GiB (25%)
                               Swap: 0 B / 976.00 MiB (0%)
                               Disk (/): 21.29 GiB / 466.95 GiB (5%) - ext4
                               Local IP (wlan0): 192.168.50.38/24
                               Battery (ABC): 95% [AC Connected]
                               Locale: en_US.UTF-8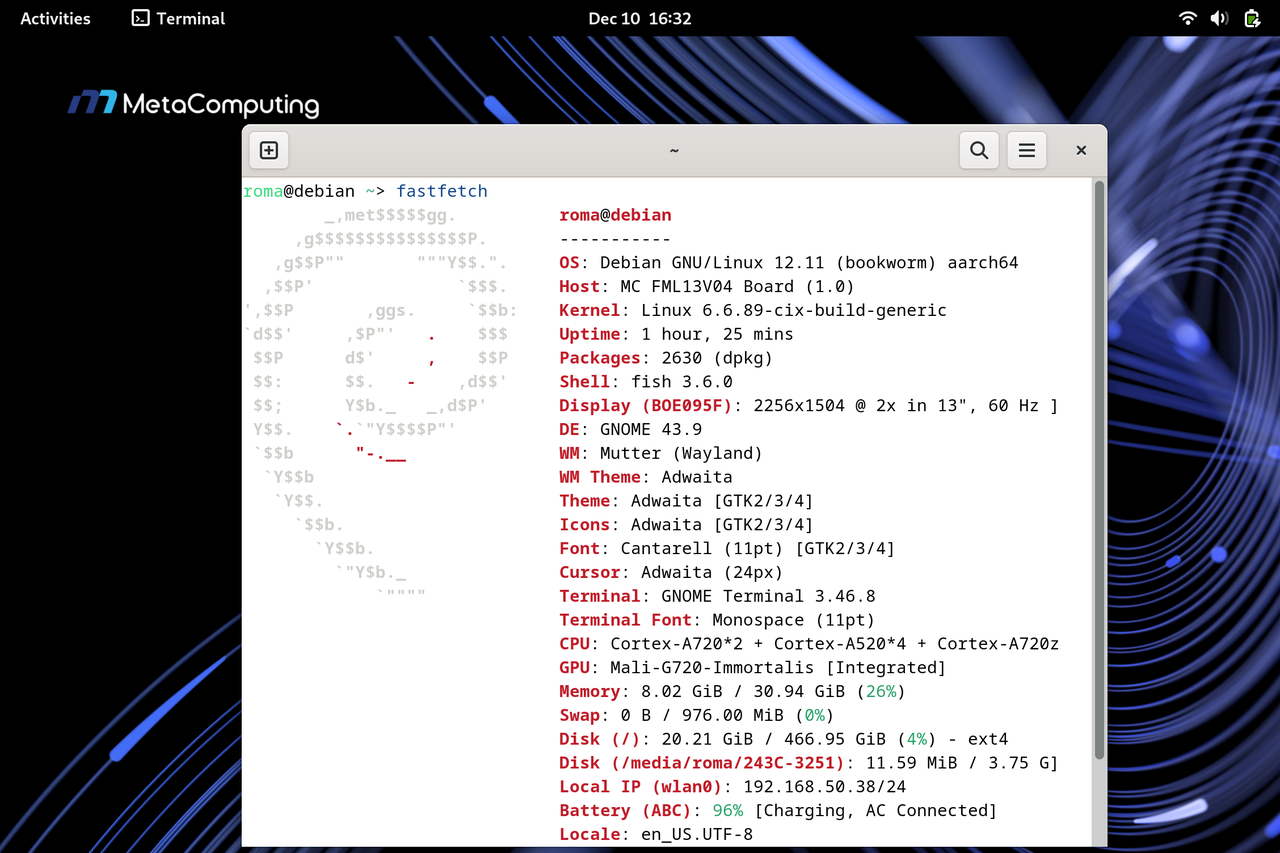
基准测试结果
系统响应、开关机测试
-
系统启动时间测试:系统从内核加载到进入图形界面总耗时 约 9.7 秒,其中 userspace 仅 6.1 秒 即达到 graphical.target。
roma@debian ~ > systemd-analyze

Startup finished in 3.587s (kernel) + 6.134s (userspace) = 9.722s
graphical.target reached after 6.075s in userspace.-
系统关闭时间测试:关机时间仅需约 46.45毫秒(实际断电时间)。这几乎是“瞬间”完成,体现了系统进程管理的效率和底层固件响应的迅速。用户完全无需等待。
roma@debian ~> time sudo shutdown -h now

Broadcast message from root@debian on pts/2 (Wed 2025-12-17 14:00:28 CST):

The system will power off now!


________________________________________________________
Executed in   46.45 millis    fish           external
   usr time    3.12 millis  993.00 micros    2.13 millis
   sys time    5.48 millis    0.00 micros    5.48 millis
-
系统响应时间测试
roma@debian ~> time ls
Desktop/  Documents/  Downloads/  Geekbench-6.2.2-LinuxARMPreview/  Music/  Pictures/  Public/  Templates/  tinymembench/  top500-benchmark/  Videos/

________________________________________________________
Executed in    6.07 millis    fish           external
   usr time    0.84 millis  844.00 micros    0.00 millis
   sys time    5.29 millis  696.00 micros    4.60 millis
CPU
-
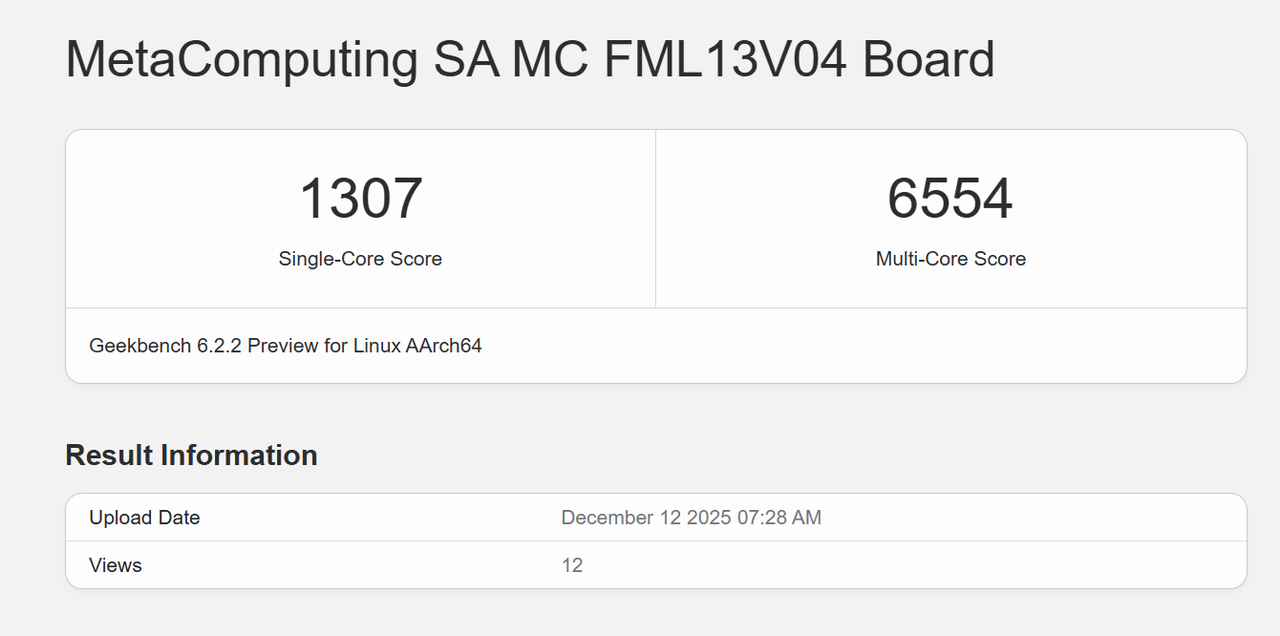
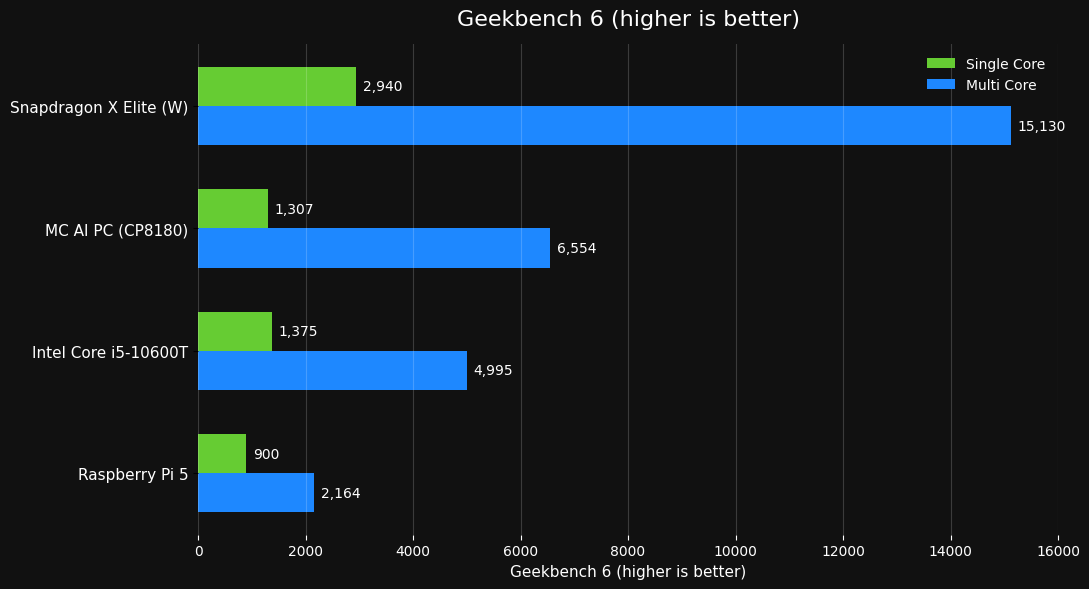
Geekbench 6
-
Geekbench 6跑分对比图(部分数据来源于网络(Bilibili、Youtube))
-
Coremark:单核性能已经明显超过传统嵌入式 ARM多;核扩展性良好,线程数拉高后仍能线性增长
-
单核测试:24832.38(单位:Iterations/Sec)
roma@debian ~/coremark (main)> make compile XCFLAGS="-DMULTITHREAD=1 -DUSE_PTHREAD" roma@debian ~/coremark (main)> ./coremark.exe 2K performance run parameters for coremark. CoreMark Size : 666 Total ticks : 12081 Total time (secs): 12.081000 Iterations/Sec : 24832.381425 Iterations : 300000 Compiler version : GCC12.2.0 Compiler flags : -O2 -DMULTITHREAD=1 -DUSE_PTHREAD -lrt -lpthread Memory location : Please put data memory location here (e.g. code in flash, data on heap etc) seedcrc : 0xe9f5 [0]crclist : 0xe714 [0]crcmatrix : 0x1fd7 [0]crcstate : 0x8e3a [0]crcfinal : 0xcc42 Correct operation validated. See README.md for run and reporting rules. CoreMark 1.0 : 24832.381425 / GCC12.2.0 -O2 -DMULTITHREAD=1 -DUSE_PTHREAD -lrt -lpthread / Heap-
多核测试:186003.26(单位:Iterations/Sec)
-
roma@debian ~/coremark (main)> make compile XCFLAGS="-DMULTITHREAD=64 -DUSE_PTHREAD"
roma@debian ~/coremark (main)> ./coremark.exe
2K performance run parameters for coremark.
CoreMark Size    : 666
Total ticks      : 103224
Total time (secs): 103.224000
Iterations/Sec   : 186003.255057
Iterations       : 19200000
Compiler version : GCC12.2.0
Compiler flags   : -O2 -DMULTITHREAD=64 -DUSE_PTHREAD  -lrt -lpthread
Parallel PThreads : 64
Memory location  : Please put data memory location here
                        (e.g. code in flash, data on heap etc)
seedcrc          : 0xe9f5

Correct operation validated. See README.md for run and reporting rules.
CoreMark 1.0 : 186003.255057 / GCC12.2.0 -O2 -DMULTITHREAD=64 -DUSE_PTHREAD  -lrt -lpthread / Heap / 64:PThreads
GPU
-
Glmark2测试结果:得分 3845,这个分数需要结合场景和分辨率来看。在 800x600 窗口化下跑出近 5000 FPS 的单项测试,以及最终 3845 的总分,表明 Mali-G720 Immortalis 的性能远超以往的 ARM 集成显卡(如 Mali-G78/G710)。
roma@debian ~/coremark (main)> make compile XCFLAGS="-DMULTITHREAD=64 -DUSE_PTHREAD"
roma@debian ~/coremark (main)> ./coremark.exe
2K performance run parameters for coremark.
CoreMark Size    : 666
Total ticks      : 103224
Total time (secs): 103.224000
Iterations/Sec   : 186003.255057
Iterations       : 19200000
Compiler version : GCC12.2.0
Compiler flags   : -O2 -DMULTITHREAD=64 -DUSE_PTHREAD  -lrt -lpthread
Parallel PThreads : 64
Memory location  : Please put data memory location here
                        (e.g. code in flash, data on heap etc)
seedcrc          : 0xe9f5

Correct operation validated. See README.md for run and reporting rules.
CoreMark 1.0 : 186003.255057 / GCC12.2.0 -O2 -DMULTITHREAD=64 -DUSE_PTHREAD  -lrt -lpthread / Heap / 64:PThreads
Memory
-
LPDDR5(32G)
-
高带宽: 多种复制 (
copy) 操作速度达到 14-16 GB/s,而填充 (fill) 操作更是飙升至 35-41 GB/s (如standard memset达 41.25 GB/s)。这明显是 LPDDR5 或 LPDDR5X 内存的特征,提供了充沛的数据吞吐能力,对 CPU 多核性能、GPU 纹理填充、大数据处理至关重要。 -
低延迟: 内存延迟测试 (
Memory latency test) 结果优秀。在常见应用使用的大小范围内(几MB到几十MB),额外延迟普遍在 几十纳秒 (ns) 级别。即使在最大的 64MB 块测试中,单/双随机读取延迟也仅为 194.1 ns / 228.1 ns (普通页) 和 175.6 ns / 210.6 ns (大页)。这确保了系统的快速响应。
tinymembench v0.4.9 (simple benchmark for memory throughput and latency)

==========================================================================
== Memory bandwidth tests                                               ==
==                                                                      ==
== Note 1: 1MB = 1000000 bytes                                          ==
== Note 2: Results for 'copy' tests show how many bytes can be          ==
==         copied per second (adding together read and writen           ==
==         bytes would have provided twice higher numbers)              ==
== Note 3: 2-pass copy means that we are using a small temporary buffer ==
==         to first fetch data into it, and only then write it to the   ==
==         destination (source -> L1 cache, L1 cache -> destination)    ==
== Note 4: If sample standard deviation exceeds 0.1%, it is shown in    ==
==         brackets                                                     ==
==========================================================================

 C copy backwards                                     :  14892.4 MB/s (1.0%)
 C copy backwards (32 byte blocks)                    :  15205.4 MB/s (0.4%)
 C copy backwards (64 byte blocks)                    :  15140.4 MB/s (0.3%)
 C copy                                               :  14994.8 MB/s (0.3%)
 C copy prefetched (32 bytes step)                    :  14132.7 MB/s (0.2%)
 C copy prefetched (64 bytes step)                    :  14301.2 MB/s (0.8%)
 C 2-pass copy                                        :  14294.2 MB/s
 C 2-pass copy prefetched (32 bytes step)             :  13718.6 MB/s
 C 2-pass copy prefetched (64 bytes step)             :  14677.6 MB/s (0.3%)
 C fill                                               :  36013.7 MB/s (2.1%)
 C fill (shuffle within 16 byte blocks)               :  35850.4 MB/s (2.0%)
 C fill (shuffle within 32 byte blocks)               :  35094.1 MB/s (0.5%)
 C fill (shuffle within 64 byte blocks)               :  35493.6 MB/s (0.4%)
 ---
 standard memcpy                                      :  16168.9 MB/s (1.9%)
 standard memset                                      :  41249.7 MB/s (5.9%)
 ---
 NEON LDP/STP copy                                    :  16664.6 MB/s (1.0%)
 NEON LDP/STP copy pldl2strm (32 bytes step)          :  15130.8 MB/s (0.4%)
 NEON LDP/STP copy pldl2strm (64 bytes step)          :  15379.7 MB/s (0.2%)
 NEON LDP/STP copy pldl1keep (32 bytes step)          :  15705.0 MB/s
 NEON LDP/STP copy pldl1keep (64 bytes step)          :  16216.1 MB/s (0.4%)
 NEON LD1/ST1 copy                                    :  16102.1 MB/s (0.2%)
 NEON STP fill                                        :  37033.2 MB/s (1.9%)
 NEON STNP fill                                       :  34190.7 MB/s (2.6%)
 ARM LDP/STP copy                                     :  16468.4 MB/s (1.9%)
 ARM STP fill                                         :  39243.4 MB/s (2.7%)
 ARM STNP fill                                        :  33605.0 MB/s (1.6%)

==========================================================================
== Framebuffer read tests.                                              ==
==                                                                      ==
== Many ARM devices use a part of the system memory as the framebuffer, ==
== typically mapped as uncached but with write-combining enabled.       ==
== Writes to such framebuffers are quite fast, but reads are much       ==
== slower and very sensitive to the alignment and the selection of      ==
== CPU instructions which are used for accessing memory.                ==
==                                                                      ==
== Many x86 systems allocate the framebuffer in the GPU memory,         ==
== accessible for the CPU via a relatively slow PCI-E bus. Moreover,    ==
== PCI-E is asymmetric and handles reads a lot worse than writes.       ==
==                                                                      ==
== If uncached framebuffer reads are reasonably fast (at least 100 MB/s ==
== or preferably >300 MB/s), then using the shadow framebuffer layer    ==
== is not necessary in Xorg DDX drivers, resulting in a nice overall    ==
== performance improvement. For example, the xf86-video-fbturbo DDX     ==
== uses this trick.                                                     ==
==========================================================================

 NEON LDP/STP copy (from framebuffer)                 :   2235.3 MB/s
 NEON LDP/STP 2-pass copy (from framebuffer)          :   1515.1 MB/s
 NEON LD1/ST1 copy (from framebuffer)                 :   2231.8 MB/s
 NEON LD1/ST1 2-pass copy (from framebuffer)          :   1525.6 MB/s
 ARM LDP/STP copy (from framebuffer)                  :   1911.1 MB/s
 ARM LDP/STP 2-pass copy (from framebuffer)           :   1175.7 MB/s

==========================================================================
== Memory latency test                                                  ==
==                                                                      ==
== Average time is measured for random memory accesses in the buffers   ==
== of different sizes. The larger is the buffer, the more significant   ==
== are relative contributions of TLB, L1/L2 cache misses and SDRAM      ==
== accesses. For extremely large buffer sizes we are expecting to see   ==
== page table walk with several requests to SDRAM for almost every      ==
== memory access (though 64MiB is not nearly large enough to experience ==
== this effect to its fullest).                                         ==
==                                                                      ==
== Note 1: All the numbers are representing extra time, which needs to  ==
==         be added to L1 cache latency. The cycle timings for L1 cache ==
==         latency can be usually found in the processor documentation. ==
== Note 2: Dual random read means that we are simultaneously performing ==
==         two independent memory accesses at a time. In the case if    ==
==         the memory subsystem can't handle multiple outstanding       ==
==         requests, dual random read has the same timings as two       ==
==         single reads performed one after another.                    ==
==========================================================================

block size : single random read / dual random read, [MADV_NOHUGEPAGE]
      1024 :    0.0 ns          /     0.0 ns
      2048 :    0.0 ns          /     0.0 ns
      4096 :    0.0 ns          /     0.0 ns
      8192 :    0.0 ns          /     0.0 ns
     16384 :    0.0 ns          /     0.0 ns
     32768 :    0.0 ns          /     0.0 ns
     65536 :    0.0 ns          /     0.0 ns
    131072 :    1.0 ns          /     1.5 ns
    262144 :    2.0 ns          /     2.8 ns
    524288 :    3.0 ns          /     3.9 ns
   1048576 :   19.3 ns          /    27.6 ns
   2097152 :   27.1 ns          /    34.1 ns
   4194304 :   31.9 ns          /    36.2 ns
   8388608 :   37.2 ns          /    37.3 ns
  16777216 :   52.8 ns          /    50.5 ns
  33554432 :  128.8 ns          /   168.6 ns
  67108864 :  194.1 ns          /   228.1 ns

block size : single random read / dual random read, [MADV_HUGEPAGE]
      1024 :    0.0 ns          /     0.0 ns
      2048 :    0.0 ns          /     0.0 ns
      4096 :    0.0 ns          /     0.0 ns
      8192 :    0.0 ns          /     0.0 ns
     16384 :    0.0 ns          /     0.0 ns
     32768 :    0.0 ns          /     0.0 ns
     65536 :    0.0 ns          /     0.0 ns
    131072 :    1.0 ns          /     1.5 ns
    262144 :    1.5 ns          /     2.1 ns
    524288 :    1.8 ns          /     2.4 ns
   1048576 :   17.5 ns          /    26.1 ns
   2097152 :   25.2 ns          /    32.3 ns
   4194304 :   28.9 ns          /    34.3 ns
   8388608 :   31.1 ns          /    35.0 ns
  16777216 :   41.8 ns          /    47.3 ns
  33554432 :  123.6 ns          /   163.9 ns
  67108864 :  175.6 ns          /   210.6 ns
Disk
-
ZHITAI TiPlus7100 512GB ,iozone 基准测试
-
顺序读写 (1M): 表现强劲,读取 ~4.9 GB/s,写入 ~4.6 GB/s。这达到了 PCIe 4.0 x4 NVMe SSD 的主流高性能水平,确保了大文件传输、视频加载、系统启动/休眠的速度。
-
4K 随机读写: 读取 ~74.5 MB/s,写入 ~203.7 MB/s。写入性能不错,读取性能相对普通。这反映了 SSD 控制器和闪存颗粒的特性。对于日常使用(系统操作、程序加载)影响不大,但对于高并发随机读密集的数据库类应用会是瓶颈。
|
基准 |
结果(MB/s) |
|
iozone 4K 随机写入 |
203.7 |
|
iozone 4K 随机读取 |
74.5 |
|
iozone 4K 顺序写入 |
141.8 |
|
iozone 4K 顺序读取 |
195.5 |
|
iozone 1M 随机写入 |
4,677.2 |
|
iozone 1M 随机读取 |
4,240.2 |
|
iozone 1M 顺序写入 |
4,575.3 |
|
iozone 1M 顺序读取 |
4,911.3 |
WLAN(Wi-Fi 6 AX210 160MHz)
-
测试结果受路由器和网络环境影响较大。单向上传 (TX) 达到 355 Mbps 和下载 (RX) 215 Mbps,表明 Intel AX210 网卡在良好的 Wi-Fi 6/6E (160MHz) 环境下能提供接近有线千兆网的无线速度。同时收发时性能有所下降是正常现象,但吞吐量总和 (278 Mbps) 依然可观,满足高清视频流、大文件同步、在线协作等需求绰绰有余。
|
测试项 |
结果 |
|
iperf3 发 |
355 Mbits/sec |
|
iperf3 收 |
215 Mbits/sec |
|
iperf3 同时收发 |
上传 (TX):161 Mbits/sec |
|
下载 (RX):117 Mbits/sec |
总结
MetaComputing AI PC + Framework Laptop 13 的组合,是一台极具特色和前瞻性的设备。它在多核CPU性能、系统响应速度、内存带宽和集成GPU性能上带来了远超传统ARM笔记本甚至部分X86轻薄本的惊喜表现。模块化设计赋予了它长久的生命力。

有“AI”的1024 = 2048,欢迎大家加入2048 AI社区
更多推荐
 21
21 0
0- 0


 已为社区贡献2条内容

所有评论(0)