【Python练习】Shopee 电商数据清洗与分析 (二):借助 DeepSeek 实现数据结构化清洗与自动化报告
承接上一篇【Python练习】Shopee 电商数据采集与清洗 (一),我们已经通过 Selenium 抓取到了 Shopee 商品的原始数据(标题、价格、销量)。原始 CSV 中的标题(Name)是非结构化的,充斥着马来文、英文缩写和各种关键词堆砌。仅靠正则(Regex)很难提取出准确的材质款式和卖点。利用 Python (pandas) 结合 AI 大模型 API (DeepSeek数据清洗:
0. 前言
承接上一篇 【Python练习】Shopee 电商数据采集与清洗 (一),我们已经通过 Selenium 抓取到了 Shopee 商品的原始数据(标题、价格、销量)。
痛点: 原始 CSV 中的标题(Name)是非结构化的,充斥着马来文、英文缩写和各种关键词堆砌。仅靠正则(Regex)很难提取出准确的 材质、款式 和 卖点。
本篇目标: 利用 Python (pandas) 结合 AI 大模型 API (DeepSeek),实现:
-
数据清洗:标准化价格与销量。
-
智能结构化:利用 LLM 将非标准标题清洗为标准字段(归一化处理)。
-
自动化报告:自动生成包含图表和 AI 洞察的 Word 分析报告。
1. 准备工作
1.1 依赖库安装
本项目需要处理 Excel、绘图、调用 API 以及生成 Word 文档。
pip install pandas matplotlib seaborn openai python-docx1.2 申请 API Key
本教程使用 DeepSeek API(兼容 OpenAI SDK),价格便宜且对中文/马来文理解能力强。请自行申请 API Key 并替换代码中的配置。
2. 核心实现步骤
2.1 基础数据清洗
上一篇抓取的 Price 带有 RM 符号,Sold 带有 k 单位(如 1.2k),无法直接计算。需要先转换为 float。
-
价格:正则去除
RM、空格、换行符。 -
销量:识别
k,将1.2k修正为1200。 -
GMV:计算
Revenue = Price * Sold。
2.2 AI 智能结构化(Prompt 工程)
解决“脏数据”的关键。不写死正则规则,而是定义 “归类原则” 让 AI 执行。
Prompt 策略:
-
材质 (Material):物理成分提取。规则:Dri-fit/Microfiber -> Jersey。
-
款式 (Style):佩戴结构提取。规则:Siap/Sarung -> Instant。
-
卖点 (Feature):功能词提取。规则:Tak payah gosok -> Ironless。
通过这种方式,即使标题写得五花八门,统计结果也是标准化的。
2.3 可视化与自动化报告
使用 matplotlib 绘图,python-docx 生成报告。
-
去科学计数法:在绘制 GMV 柱状图时,强制关闭科学计数法,并换算单位为"K"。
-
字体适配:封装
set_chinese_font函数,防止 Word 中文乱码(强制设置为宋体)。
3. 完整代码实现
新建 analyze_shopee.py,填入你的 API Key 和 CSV 路径即可运行。
import pandas as pd
import matplotlib.pyplot as plt
import seaborn as sns
import openai
import json
import re
import os
import numpy as np
import warnings
from docx import Document
from docx.shared import Inches
from docx.oxml.ns import qn
from docx.enum.text import WD_ALIGN_PARAGRAPH
# 忽略绘图库的警告信息
warnings.simplefilter(action='ignore', category=FutureWarning)
# ================= 配置区域 =================
API_KEY = "sk-xxxxxxxxxxxxxxxxxxxxxxxx" # 请替换为你的 Key
BASE_URL = "https://api.deepseek.com"
DATA_FILE = r"C:\Users\Leo\Downloads\blog 1\shopee_list_Tudung_Sport_1.csv"
# ===========================================
# === 1. 设置文档中文字体 ===
def set_chinese_font(run, font_name='宋体'):
"""将文档中的文字格式统一设置为宋体"""
run.font.name = 'Times New Roman'
r = run._element
r.rPr.rFonts.set(qn('w:eastAsia'), font_name)
# === 2. 数据加载与清洗 ===
def load_and_clean(file_path):
print("[1/4] 正在读取并清洗数据...")
try:
df = pd.read_csv(file_path)
except Exception as e:
print(f"读取文件出错: {e}")
return pd.DataFrame()
# 价格处理
df['Price_Clean'] = df['Price'].astype(str).str.replace(r'[RM\n\s]', '', regex=True)
df['Price_Clean'] = pd.to_numeric(df['Price_Clean'], errors='coerce').fillna(0)
# 销量处理
def parse_sold(s):
s = str(s).lower().translate(str.maketrans('', '', '+soldterjual '))
try:
return float(s.replace('k', '')) * 1000 if 'k' in s else float(s)
except: return 0.0
df['Sold_Clean'] = df['Sold'].apply(parse_sold)
# 清除无效数据
df.replace([np.inf, -np.inf], np.nan, inplace=True)
df.dropna(subset=['Price_Clean', 'Sold_Clean'], inplace=True)
# 计算销售额 (Revenue)
df['Revenue'] = df['Price_Clean'] * df['Sold_Clean']
return df.sort_values(by='Sold_Clean', ascending=False).head(50).reset_index(drop=True)
# === 3. AI 结构化提取 (带归一化) ===
def ai_structure_data(df):
print("[2/4] 正在调用 AI 进行字段提取...")
titles = "\n".join([f"ID_{i}: {n}" for i, n in enumerate(df['Name'])])
prompt = f"""
请作为一名专业的电商数据分析师,对以下商品标题进行【标准化分类】。
待分析标题:
{titles}
任务目标:
将营销词汇归纳为标准的行业术语,以便进行客观统计。
1. Material (材质):
- 提取物理面料成分 (如 Jersey, Cotton)。
- 将马来文翻译成对应英文,并对英文进行标准化分类,归一后的词应为单一词,而非组合词。
- 未提及填 "Unknown"。
2. Style (款式):
- 提取佩戴结构 (如 Instant, Sarung)。
- 将马来文翻译成对应英文,并对英文进行标准化分类,归一后的词应为单一词,而非组合词。
- 未提及填 "Unknown"。
3. Feature (卖点):
- 提取主要功能 (如 Ironless, Quick Dry)。
- 将马来文翻译成对应英文,并对英文进行标准化分类,归一后的词应为单一词,而非组合词。
- 未提及填 "Unknown"。
输出格式:仅输出 JSON 列表。
示例:[{{ "id": "ID_0", "Material": "Jersey", "Style": "Instant", "Feature": "Ironless" }}]
"""
try:
client = openai.OpenAI(api_key=API_KEY, base_url=BASE_URL)
response = client.chat.completions.create(
model="deepseek-chat",
messages=[{"role": "user", "content": prompt}],
temperature=0.1
)
content = response.choices[0].message.content
match = re.search(r'\[.*\]', content, re.DOTALL)
if match:
json_data = json.loads(match.group(0))
attr_df = pd.DataFrame(json_data)
attr_df['original_index'] = attr_df['id'].apply(lambda x: int(x.split('_')[1]))
attr_df.set_index('original_index', inplace=True)
merged = df.merge(attr_df[['Material', 'Style', 'Feature']], left_index=True, right_index=True)
# 规范化
for col in ['Material', 'Style', 'Feature']:
merged[col] = merged[col].astype(str).replace(['None', 'nan', 'N/A', 'Other', 'other', ''], 'Unknown')
merged[col] = merged[col].str.title()
return merged
except Exception as e:
print(f"AI 提取过程出错: {e}")
return df
# === 4. AI 分析与绘图 ===
def get_ai_insight(prompt_context, topic_name):
print(f" - 正在生成【{topic_name}】的分析文本...")
prompt = f"""
请扮演一名客观严谨的数据分析师。基于以下统计数据,写一段关于【{topic_name}】的分析。
统计数据:
{prompt_context}
写作要求:
1. **现状描述 (Fact)**:引用具体的数据排名或占比,客观简述市场现状。
2. **数据洞察 (Insight)**:基于数据表现,结合产品、受众人群、地域气候等特性(如运动场景需求、用户痛点),给出一个多元、综合且合理的归因分析。
3. **结论 (Conclusion)**:简要总结该趋势对未来从事该市场选品的启示。
4. **建议 (Suggestion)**:总结未来可落地的运营建议和具体行动指导方案。
5. 字数控制在 200-250 字之间。语言平实、专业。
"""
try:
client = openai.OpenAI(api_key=API_KEY, base_url=BASE_URL)
response = client.chat.completions.create(
model="deepseek-reasoner",
messages=[{"role": "user", "content": prompt}],
temperature=0.3
)
return response.choices[0].message.content
except: return "(无法连接 AI 服务,暂无分析内容)"
def generate_report_section(doc, df, section_type):
# 图表通用设置
sns.set_theme(style="whitegrid", font="Arial")
plt.rcParams['font.sans-serif'] = ['SimHei', 'Arial']
plt.rcParams['axes.unicode_minus'] = False
chart_filename = f"chart_{section_type}.png"
analysis_text = ""
title_text = ""
# === A. 材质分析 (饼图 - 看占比) ===
if section_type == "material":
title_text = '1. 材质分布情况'
valid_df = df[df['Material'] != 'Unknown']
if not valid_df.empty:
stats = valid_df.groupby('Material')['Revenue'].sum().sort_values(ascending=False)
if len(stats) > 6:
top_data = stats[:6]
others = pd.Series([stats[6:].sum()], index=['Others'])
plot_data = pd.concat([top_data, others])
else:
plot_data = stats
plt.figure(figsize=(8, 5))
plt.pie(plot_data, labels=plot_data.index, autopct='%1.1f%%',
startangle=140, colors=sns.color_palette("Paired"))
plt.title("Sales Share by Material (Revenue)", fontsize=12)
plt.savefig(chart_filename, bbox_inches='tight', dpi=150)
plt.close()
top_mat = stats.index[0]
top_share = stats.values[0] / stats.sum()
context = f"在已知材质的商品中,{top_mat} 排名第一,销售额占比 {top_share:.1%}。排名第二的是 {stats.index[1] if len(stats)>1 else '无'}。"
analysis_text = get_ai_insight(context, "材质偏好")
else:
analysis_text = "数据中未发现明确的材质标注。"
# === B. 款式分析 (柱状图 - 使用销售额,单位显示为 K) ===
elif section_type == "style":
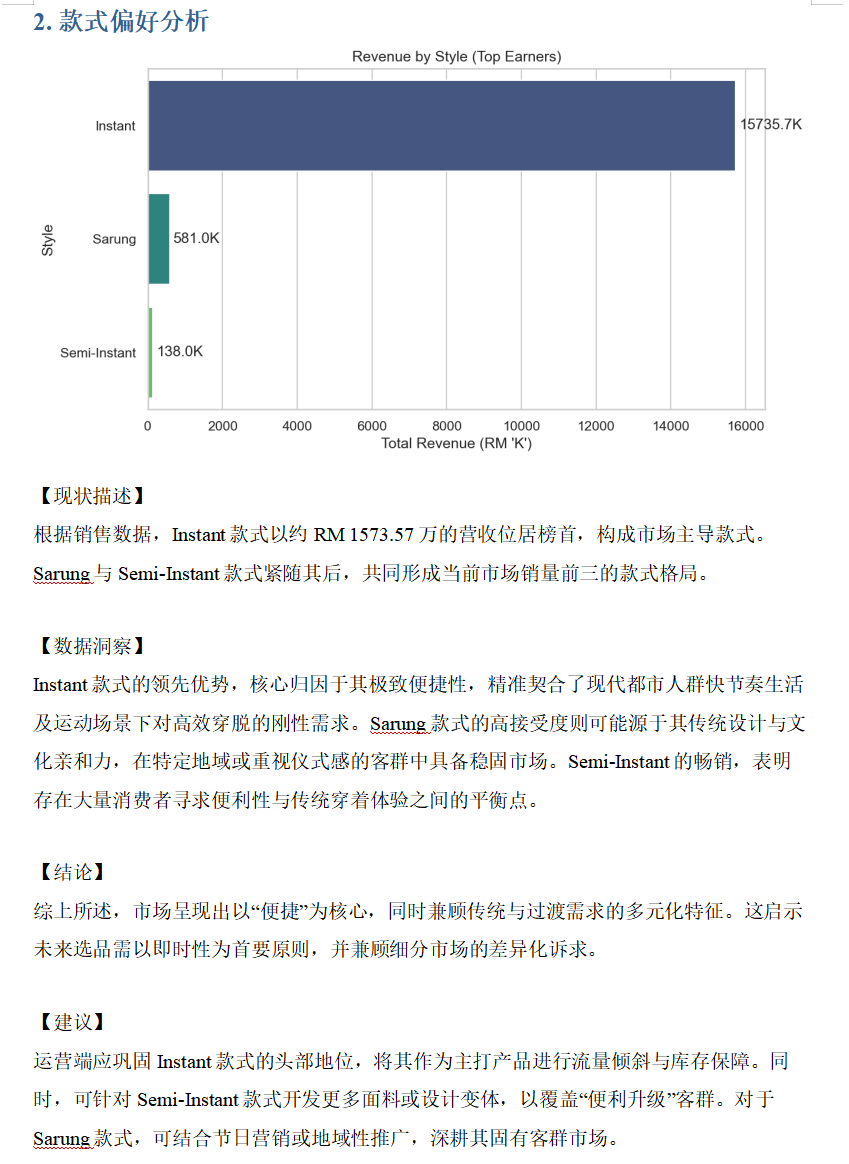
title_text = '2. 款式偏好分析'
valid_df = df[df['Style'] != 'Unknown']
if not valid_df.empty:
stats = valid_df.groupby('Style')['Revenue'].sum().sort_values(ascending=False)
stats_k = stats / 1000
plt.figure(figsize=(9, 5))
ax = sns.barplot(x=stats_k.values, y=stats_k.index, palette="viridis")
plt.title("Revenue by Style (Top Earners)", fontsize=12)
plt.xlabel("Total Revenue (RM 'K')")
ax.bar_label(ax.containers[0], fmt='%.1fK', padding=3)
plt.savefig(chart_filename, bbox_inches='tight', dpi=150)
plt.close()
top_style = stats.index[0]
top_val_k = stats_k.values[0]
context = f"销售额最高的款式是 {top_style},总营收约 RM {top_val_k:.1f}K。前三名款式为: {', '.join(stats.index[:3].tolist())}。"
analysis_text = get_ai_insight(context, "款式选择")
else:
analysis_text = "数据中未发现明确的款式标注。"
# === C. 卖点分析 (柱状图 - 使用频次) ===
elif section_type == "feature":
title_text = '3. 产品卖点词频'
valid_df = df[df['Feature'] != 'Unknown']
if not valid_df.empty:
stats = valid_df['Feature'].value_counts().head(8)
plt.figure(figsize=(9, 5))
ax = sns.barplot(x=stats.values, y=stats.index, palette="mako")
plt.title("Top Product Features by Listing Count", fontsize=12)
plt.xlabel("Frequency (Number of Listings)")
# 显示整数频次
ax.bar_label(ax.containers[0], fmt='%d', padding=3)
plt.savefig(chart_filename, bbox_inches='tight', dpi=150)
plt.close()
context = f"在显性标注卖点的商品中,出现频率最高的是 {stats.index[0]} ({stats.values[0]} 次)。前三名分别是: {', '.join(stats.index[:3].tolist())}。"
analysis_text = get_ai_insight(context, "热门卖点")
else:
context = "数据表明,绝大多数爆款标题未突出具体的功能性卖点。"
analysis_text = get_ai_insight(context, "卖点缺失情况")
# === D. 价格分析 ===
elif section_type == "price":
title_text = '4. 价格区间分布'
plt.figure(figsize=(8, 5))
sns.histplot(df['Price_Clean'], bins=15, kde=True, color='#4c72b0', alpha=0.6)
mean_val = df['Price_Clean'].mean()
median_val = df['Price_Clean'].median()
plt.axvline(mean_val, color='red', linestyle='--', label=f'Mean: RM{mean_val:.2f}')
plt.axvline(median_val, color='green', linestyle='-', label=f'Median: RM{median_val:.2f}')
plt.legend()
plt.title("Price Distribution", fontsize=12)
plt.savefig(chart_filename, bbox_inches='tight', dpi=150)
plt.close()
context = f"平均价格为 RM{mean_val:.2f},中位数为 RM{median_val:.2f}。主要价格区间在 RM{df['Price_Clean'].quantile(0.25):.2f} 到 RM{df['Price_Clean'].quantile(0.75):.2f} 之间。"
analysis_text = get_ai_insight(context, "价格定位")
# === 写入 Word ===
if title_text:
h = doc.add_heading(title_text, level=1)
for run in h.runs: set_chinese_font(run)
if os.path.exists(chart_filename):
doc.add_picture(chart_filename, width=Inches(6.0))
os.remove(chart_filename)
if analysis_text:
p = doc.add_paragraph()
run = p.add_run(analysis_text)
set_chinese_font(run)
p.paragraph_format.line_spacing = 1.5
doc.add_paragraph("")
# === 5. 主程序 ===
def create_full_report(df):
print("[3/4] 正在生成 Word 分析报告...")
doc = Document()
title = doc.add_heading('Shopee 商品数据分析报告', 0)
title.alignment = WD_ALIGN_PARAGRAPH.CENTER
for run in title.runs: set_chinese_font(run)
p = doc.add_paragraph(f"报告日期: {pd.Timestamp.now().strftime('%Y-%m-%d')}")
p.alignment = WD_ALIGN_PARAGRAPH.CENTER
set_chinese_font(p.runs[0])
if 'Material' in df.columns:
generate_report_section(doc, df, "material")
generate_report_section(doc, df, "style")
generate_report_section(doc, df, "feature")
generate_report_section(doc, df, "price")
output_file = 'Shopee_Analysis_Report.docx'
doc.save(output_file)
print(f"[4/4] 报告已保存: {output_file}")
if __name__ == "__main__":
df = load_and_clean(DATA_FILE)
if not df.empty:
df_struct = ai_structure_data(df)
df_struct.to_excel("shopee_structured_data.xlsx", index=False)
create_full_report(df_struct)4. 运行效果
运行脚本后,目录下会生成:
-
shopee_structured_data.xlsx:清洗并打好标签的结构化数据(含 Material, Style, Feature 列)。
-
Shopee_Analysis_Report.docx:一份排版整洁的 Word 报告,包含四个维度的图表和 AI 撰写的分析建议。
最终样例参考:

有“AI”的1024 = 2048,欢迎大家加入2048 AI社区
更多推荐


 24
24 0
0- 0


 已为社区贡献1条内容

所有评论(0)