【Operator prometheus监控系列二-----部署Operator-Prometheus】
参考链接:https://github.com/prometheus-operator/prometheus-operator版本要求参考链接:https://github.com/prometheus-operator/kube-prometheusCRD参考链接:https://github.com/prometheus-operator/prometheus-operator/tree/ma
2. 部署Operator-Prometheus
参考链接:https://github.com/prometheus-operator/prometheus-operator
版本要求参考链接:https://github.com/prometheus-operator/kube-prometheus
CRD参考链接:https://github.com/prometheus-operator/prometheus-operator/tree/main/Documentation/api-reference
2.1 部署Prometheus
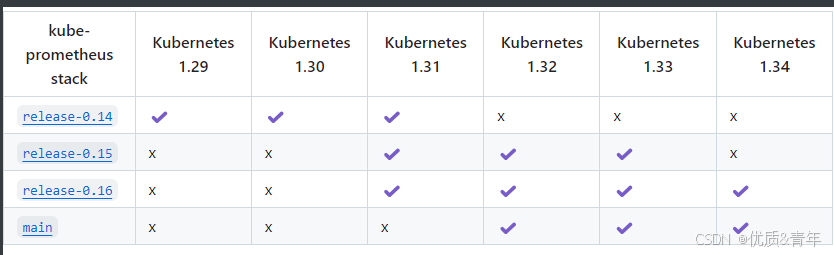
2.1.1.查看kubernetes和kube-prometheus-satck的兼容
2.1.2.部署Prometheus监控体系
注意事项:默认镜像都是从k8s.gcr.io拉取的,如果不能正常拉取把镜像地址替换成私有仓库
- 修改alertmanager-alertmanager.yaml镜像
sed -i s#quay.io/prometheus/alertmanager:v0.28.1#registry.cn-hangzhou.aliyuncs.com/qiange/alertmanager:v0.28.1#g alertmanager-alertmanager.yaml
cat alertmanager-alertmanager.yaml |grep image:
  image: registry.cn-hangzhou.aliyuncs.com/qiange/alertmanager:v0.28.1
- 修改blackboxExporter-deployment.yaml镜像
sed -i s#quay.io/prometheus/blackbox-exporter:v0.27.0#registry.cn-hangzhou.aliyuncs.com/qiange/blackbox-exporter:v0.27.0#g blackboxExporter-deployment.yaml
sed -i s#ghcr.io/jimmidyson/configmap-reload:v0.15.0#registry.cn-hangzhou.aliyuncs.com/qiange/configmap-reload:v0.15.0#g blackboxExporter-deployment.yaml
sed -i s#quay.io/brancz/kube-rbac-proxy:v0.19.1#registry.cn-hangzhou.aliyuncs.com/qiange/kube-rbac-proxy:v0.19.1#g blackboxExporter-deployment.yaml
cat blackboxExporter-deployment.yaml|grep image:
        image: registry.cn-hangzhou.aliyuncs.com/qiange/blackbox-exporter:v0.27.0
        image: registry.cn-hangzhou.aliyuncs.com/qiange/configmap-reload:v0.15.0
        image: registry.cn-hangzhou.aliyuncs.com/qiange/kube-rbac-proxy:v0.19.1
- 修改kubeStateMetrics-deployment.yaml镜像
sed -i s#registry.k8s.io/kube-state-metrics/kube-state-metrics:v2.16.0#registry.cn-hangzhou.aliyuncs.com/qiange/kube-state-metrics:v2.16.0#g kubeStateMetrics-deployment.yaml
sed -i s#quay.io/brancz/kube-rbac-proxy:v0.19.1#registry.cn-hangzhou.aliyuncs.com/qiange/kube-rbac-proxy:v0.19.1#g kubeStateMetrics-deployment.yaml
cat kubeStateMetrics-deployment.yaml|grep image:
        image: registry.cn-hangzhou.aliyuncs.com/qiange/kube-state-metrics:v2.16.0
        image: registry.cn-hangzhou.aliyuncs.com/qiange/kube-rbac-proxy:v0.19.1
        image: registry.cn-hangzhou.aliyuncs.com/qiange/kube-rbac-proxy:v0.19.1
- 修改grafana-deployment.yaml镜像
sed -i  s#grafana/grafana:12.1.0#registry.cn-hangzhou.aliyuncs.com/qiange/grafana:12.1.0#g  grafana-deployment.yaml
cat grafana-deployment.yaml|grep image:
        image: registry.cn-hangzhou.aliyuncs.com/qiange/grafana:12.1.0
- 修改 nodeExporter-daemonset.yaml镜像
sed -i s#quay.io/prometheus/node-exporter:v1.9.1#registry.cn-hangzhou.aliyuncs.com/qiange/node-exporter:v1.9.1#g nodeExporter-daemonset.yaml
sed -i  s#quay.io/brancz/kube-rbac-proxy:v0.19.1#registry.cn-hangzhou.aliyuncs.com/qiange/kube-rbac-proxy:v0.19.1#g  nodeExporter-daemonset.yaml
cat nodeExporter-daemonset.yaml|grep image:
        image: registry.cn-hangzhou.aliyuncs.com/qiange/node-exporter:v1.9.1
        image: registry.cn-hangzhou.aliyuncs.com/qiange/kube-rbac-proxy:v0.19.1
- 修改prometheus-prometheus.yaml镜像
sed -i s#quay.io/prometheus/prometheus:v3.5.0#registry.cn-hangzhou.aliyuncs.com/qiange/prometheus:v3.5.0#g prometheus-prometheus.yaml
cat prometheus-prometheus.yaml|grep image:
  image: registry.cn-hangzhou.aliyuncs.com/qiange/prometheus:v3.5.0
- 修改prometheusAdapter-deployment.yaml 镜像
sed -i s#registry.k8s.io/prometheus-adapter/prometheus-adapter:v0.12.0#registry.cn-hangzhou.aliyuncs.com/qiange/prometheus-adapter:v0.12.0#g prometheusAdapter-deployment.yaml
cat prometheusAdapter-deployment.yaml|grep image:
     image: registry.cn-hangzhou.aliyuncs.com/qiange/prometheus-adapter:v0.12.0
- 修改prometheusOperator-deployment.yaml镜像
sed -i s#quay.io/prometheus-operator/prometheus-operator:v0.85.0#registry.cn-hangzhou.aliyuncs.com/qiange/prometheus-operator:v0.85.0#g prometheusOperator-deployment.yaml
sed -i s#quay.io/brancz/kube-rbac-proxy:v0.19.1#registry.cn-hangzhou.aliyuncs.com/qiange/kube-rbac-proxy:v0.19.1#g  prometheusOperator-deployment.yaml
cat prometheusOperator-deployment.yaml|grep image:
image: registry.cn-hangzhou.aliyuncs.com/qiange/prometheus-operator:v0.85.0
image: registry.cn-hangzhou.aliyuncs.com/qiange/kube-rbac-proxy:v0.19.1
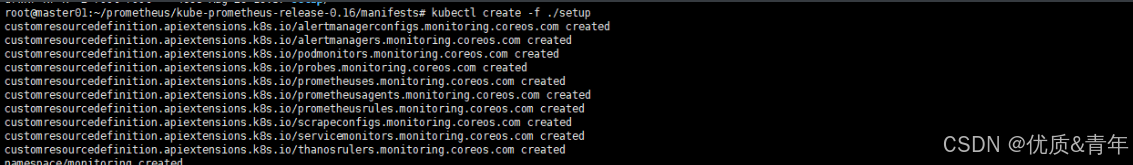
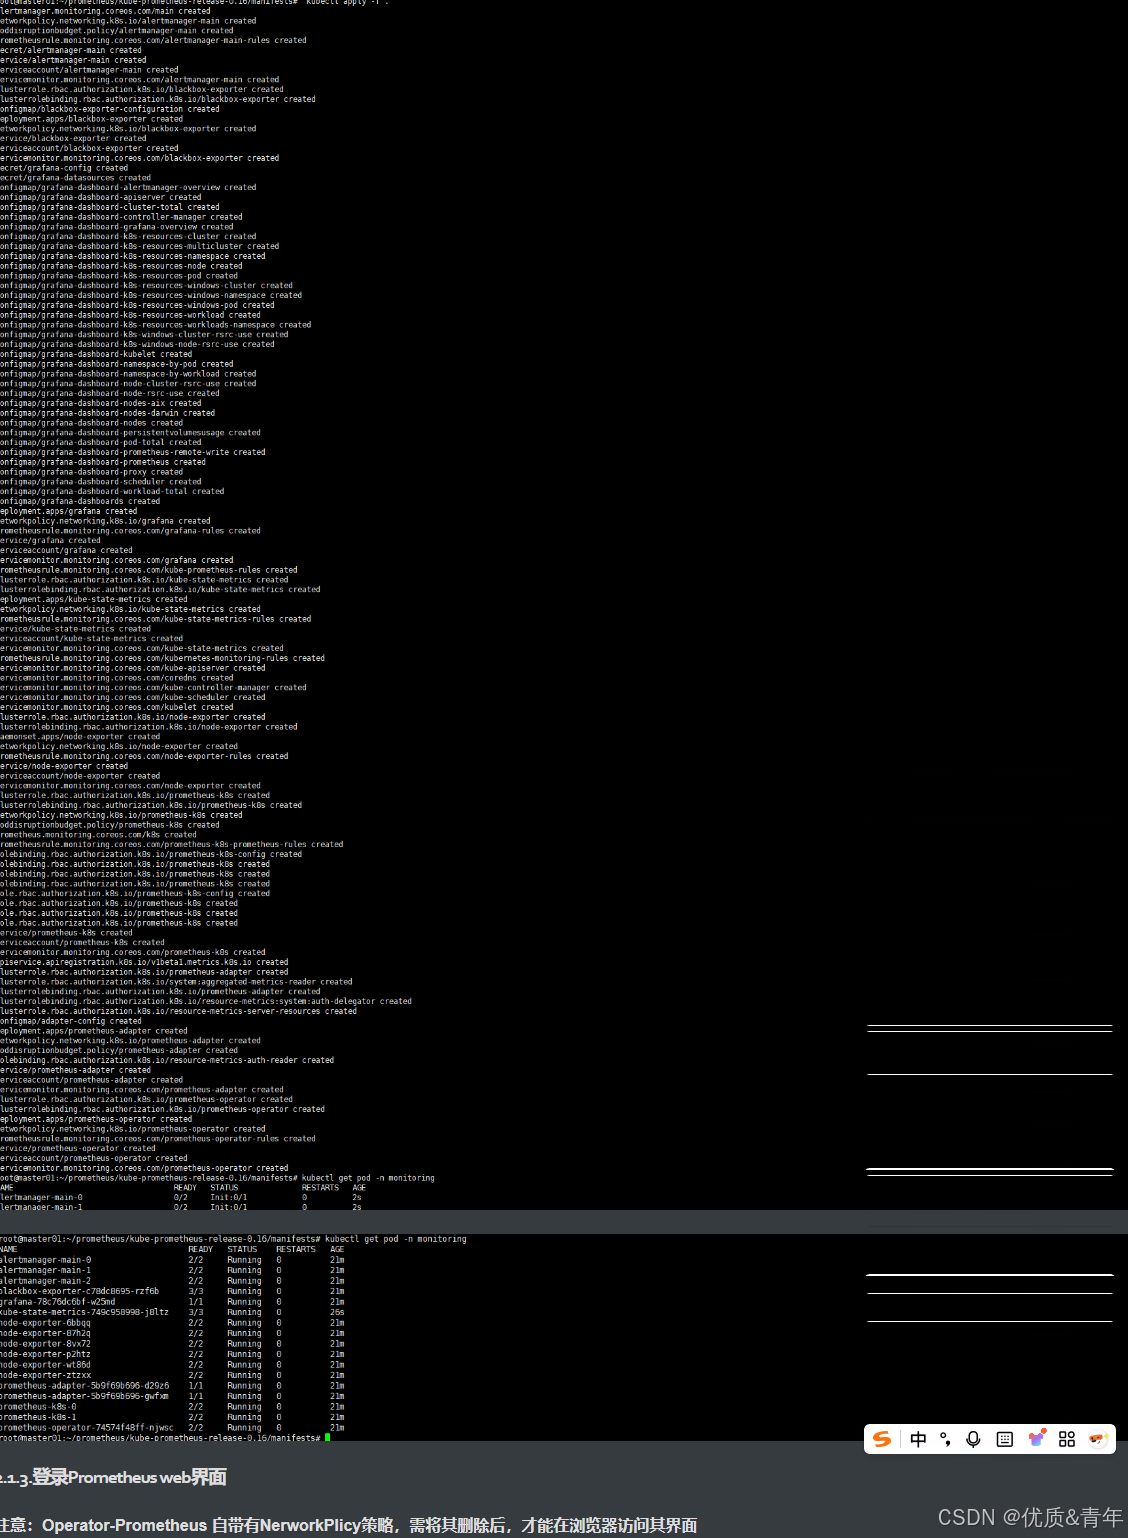
- 执行部署命令
root@kcsworker1:~# cd /apprun/
root@kcsmaster1:/apprun# git clone https://github.com/prometheus-operator/kube-prometheus.git
root@kcsmaster1:/apprun/kube-prometheus-release-0.13/manifests# kubectl create -f ./setup
root@kcsmaster1:/apprun/kube-prometheus-release-0.13/manifests# kubectl apply -f .
root@kcsmaster1:/apprun# kubectl get crd -A
NAME                                        CREATED AT
alertmanagerconfigs.monitoring.coreos.com   2024-09-27T07:36:14Z
alertmanagers.monitoring.coreos.com         2024-09-27T07:36:14Z
podmonitors.monitoring.coreos.com           2024-09-27T07:36:14Z
probes.monitoring.coreos.com                2024-09-27T07:36:14Z
prometheusagents.monitoring.coreos.com      2025-08-21T03:21:24Z
prometheuses.monitoring.coreos.com          2024-09-27T07:36:15Z
prometheusrules.monitoring.coreos.com       2024-09-27T07:36:15Z
scrapeconfigs.monitoring.coreos.com         2025-08-20T06:31:52Z
servicemonitors.monitoring.coreos.com       2024-09-27T07:36:15Z
thanosrulers.monitoring.coreos.com          2024-09-27T07:36:15Z

root@kcsmaster1:/apprun# kubectl get pod -n monitoring
NAME                                       READY   STATUS    RESTARTS       AGE
alertmanager-main-0                        2/2     Running   0              22d
alertmanager-main-1                        2/2     Running   0              3d11h
alertmanager-main-2                        2/2     Running   0              4d20h
blackbox-exporter-fb7675664-lvsbk          3/3     Running   0              38h
grafana-58d468ccc9-z6dj4                   1/1     Running   0              26h
kube-state-metrics-c7b84b46d-2qgmx         3/3     Running   0              38h
mongodb-exporter-6c9f75888f-rlbpg          1/1     Running   0              38h
mongodb-exporter-tongji-86b8b58954-gsb89   1/1     Running   0              38h
node-exporter-4lxdc                        2/2     Running   0              26d
node-exporter-57rdf                        2/2     Running   0              60d
node-exporter-7dtc5                        2/2     Running   0              60d
node-exporter-7m4xw                        2/2     Running   0              60d
prometheus-adapter-84c98465fc-2vsmz        1/1     Running   0              22d    #将Prometheus指标转换为KubernetesCustomMetrics供HPA使用
prometheus-adapter-84c98465fc-sbxr5        1/1     Running   0              38h
prometheus-alert-center-7fbc5fccfd-nwzfn   1/1     Running   5 (3d1h ago)   3d1h
prometheus-k8s-0                           2/2     Running   0              2d18h     #Prometheus server服务
prometheus-k8s-1                           2/2     Running   0              2d18h
prometheus-operator-6f5c694c97-qc6dw       2/2     Running   0              38h
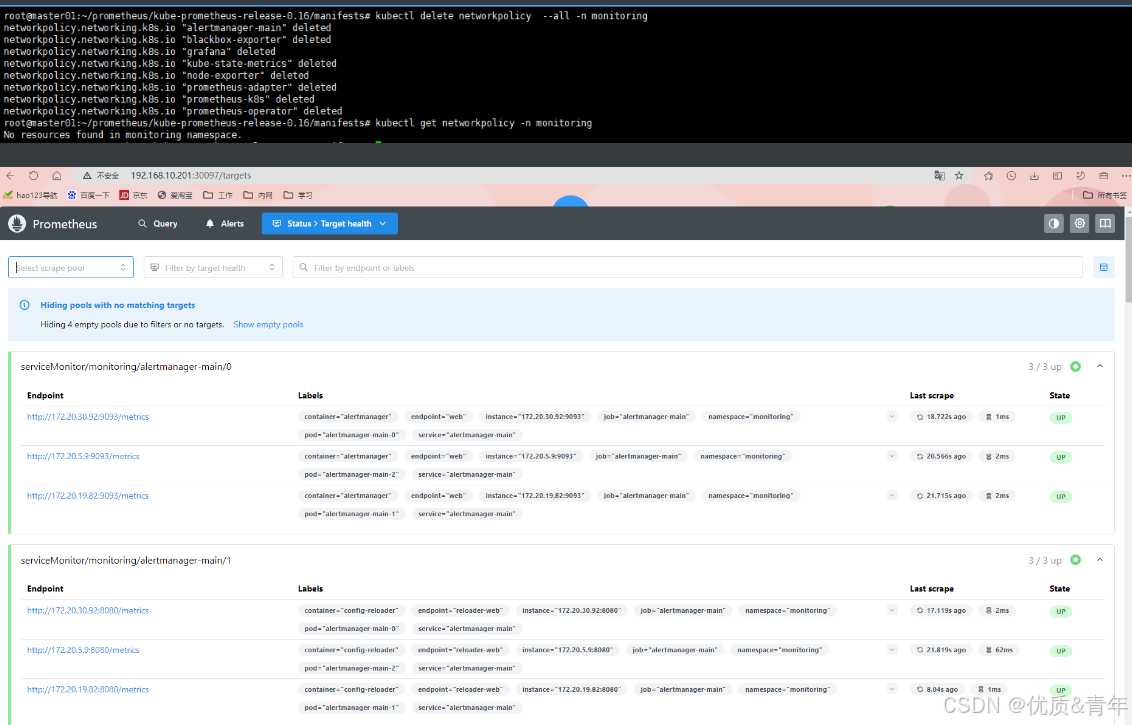
2.1.3.登录Prometheus web界面
注意:Operator-Prometheus 自带有NerworkPlicy策略,需将其删除后,才能在浏览器访问其界面
root@kcsmaster1:/apprun/kube-prometheus-release-0.13/manifests# kubectl delete networkpolicy  --all -n monitoring
#查看是否还有NetworkPolicy策略
root@kcsmaster1:/apprun/kube-prometheus-release-0.13/manifests# kubectl get networkpolicy -n monitoring
root@kcsmaster1:/apprun/kube-prometheus-release-0.13/manifests# kubectl get svc -n monitoring
NAME                      TYPE        CLUSTER-IP      EXTERNAL-IP   PORT(S)                         AGE
alertmanager-main         NodePort    10.10.115.146   <none>        9093:36382/TCP,8080:33658/TCP   60d   #alertmanager访问端口
alertmanager-operated     ClusterIP   None            <none>        9093/TCP,9094/TCP,9094/UDP      60d
blackbox-exporter         ClusterIP   10.10.245.65    <none>        9115/TCP,19115/TCP              60d
grafana                   NodePort    10.10.152.199   <none>        3000:32222/TCP                  60d    #grafana访问端口
kube-state-metrics        ClusterIP   None            <none>        8443/TCP,9443/TCP               60d
mongodb-exporter          ClusterIP   10.10.77.26     <none>        9216/TCP                        59d
mongodb-exporter-tongji   ClusterIP   10.10.16.89     <none>        9216/TCP                        56d
node-exporter             ClusterIP   None            <none>        9100/TCP                        60d
prometheus-adapter        ClusterIP   10.10.24.37     <none>        443/TCP                         60d
prometheus-alert-center   NodePort    10.10.234.241   <none>        8080:30382/TCP                  53d
prometheus-k8s            NodePort    10.10.165.214   <none>        9090:30097/TCP,8080:34649/TCP   60d     #prometheus-server访问端口
prometheus-operated       ClusterIP   None            <none>        9090/TCP                        56d
prometheus-operator       ClusterIP   None            <none>        8443/TCP                        60d
2.2.Prometheus数据持久化
从下面截图可以看到 Prometheus 的数据目录 /prometheus 实际上是通过 emptyDir 进行挂载的,我们知道 emptyDir 挂载的数据的生命周期和 Pod 生命周期一致的,所以如果 Pod 挂掉了,数据也就丢失了,这也就是为什么我们重建 Pod 后之前的数据就没有了的原因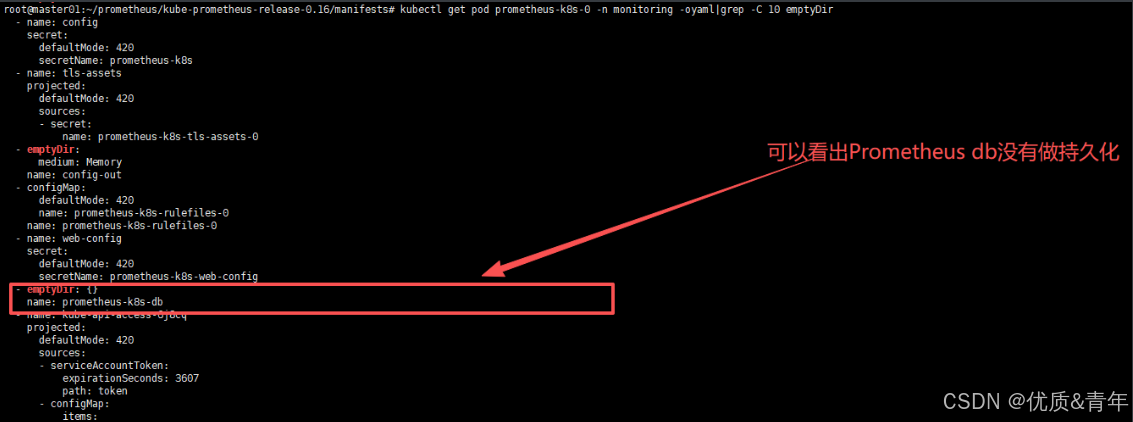
#参考链接:https://github.com/prometheus-operator/prometheus-operator/blob/main/Documentation/api-reference/api.md#monitoring.coreos.com/v1.Prometheus
因为Prometheus是个CRD资源也可以通过kubectl explain prometheus.spec来查看持久化参数怎么配置
root@kcsmaster1:~# kubectl explain prometheus.spec.storage
GROUP: monitoring.coreos.com
KIND: Prometheus
VERSION: v1
FIELD: storage <Object>
DESCRIPTION:
Storage spec to specify how storage shall be used.
FIELDS:
disableMountSubPath <boolean>
Deprecated: subPath usage will be disabled by default in a future release,
this option will become unnecessary. DisableMountSubPath allows to remove
any subPath usage in volume mounts.
emptyDir <Object>
EmptyDirVolumeSource to be used by the StatefulSet. If specified, used in
place of any volumeClaimTemplate. More info:
https://kubernetes.io/docs/concepts/storage/volumes/#emptydir
ephemeral <Object>
EphemeralVolumeSource to be used by the StatefulSet. This is a beta field in
k8s 1.21, for lower versions, starting with k8s 1.19, it requires enabling
the GenericEphemeralVolume feature gate. More info:
https://kubernetes.io/docs/concepts/storage/ephemeral-volumes/#generic-ephemeral-volumes
volumeClaimTemplate <Object> #这个就是持久化的相关配置
A PVC spec to be used by the StatefulSet. The easiest way to use a volume
that cannot be automatically provisioned (for whatever reason) is to use a
label selector alongside manually created PersistentVolumes.
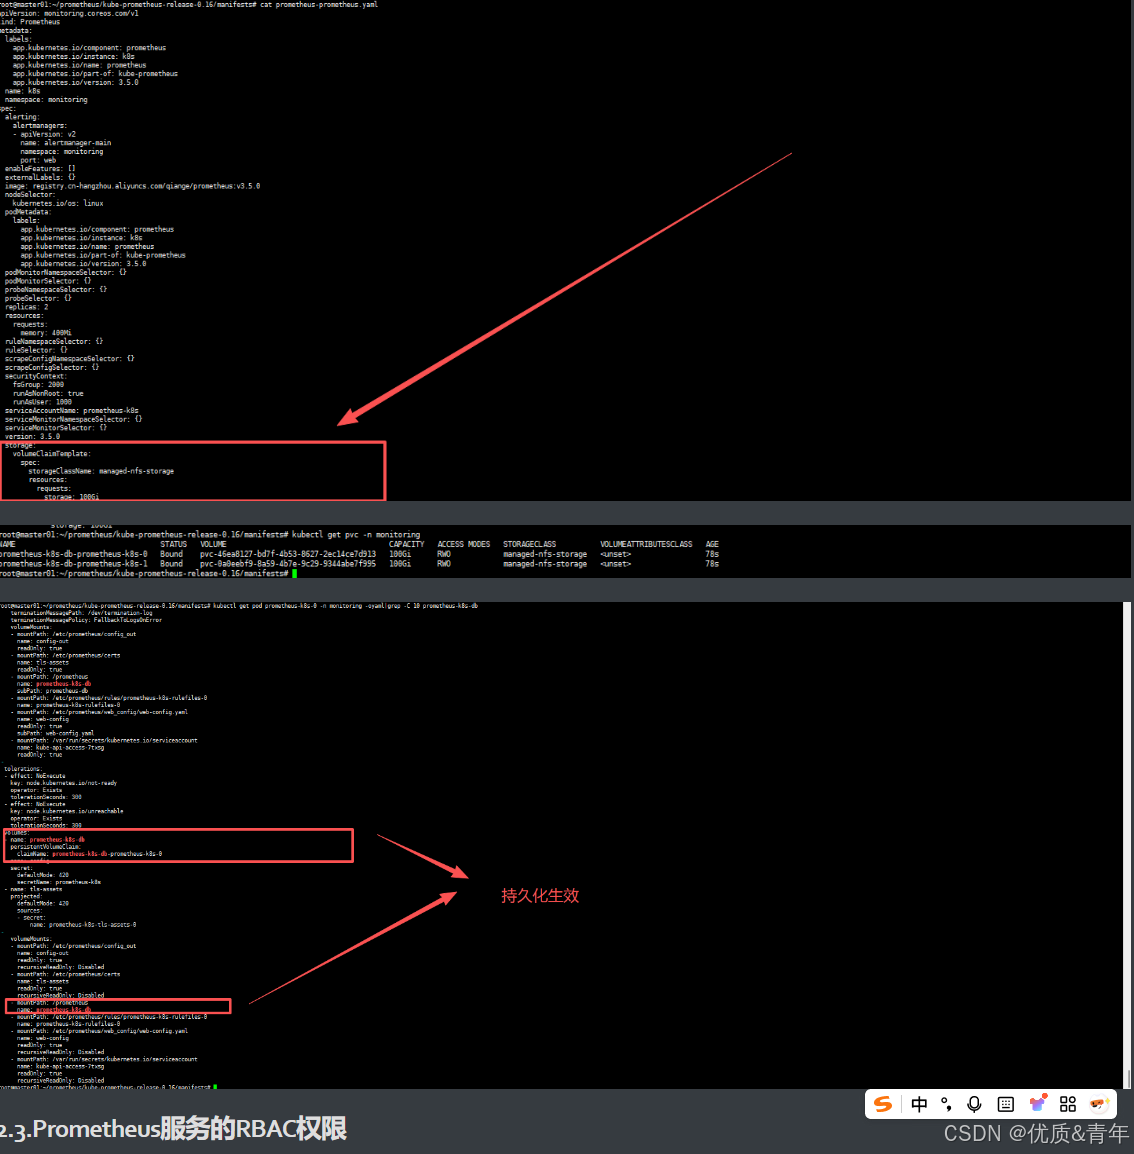
root@kcsmaster1:~# vim /apprun/kube-prometheus-release-0.13/manifests/prometheus-prometheus.yaml
............................................
storage:
volumeClaimTemplate:
spec:
storageClassName: nfs-prometheus
resources:
requests:
storage: 300Gi
配置后重新apply prometheus-prometheus.yaml然后删除重建prometheus-k8s-0 和Prometheus-k8s-1这两个pod
至此Prometheus的数据持久化就完成了
2.3.Prometheus服务的RBAC权限
Operator Prometheus默认给prometheus-k8s这个sa的权限只有get的权限
#从下面的yaml文件可以看到Prometheus server使用的是prometheus-k8s这个sa账号
root@kcsmaster1:~# kubectl get pod prometheus-k8s-0 -n monitoring -oyaml|grep prometheus-k8s
  serviceAccount: prometheus-k8s
  serviceAccountName: prometheus-k8s

#从以下两个yaml文件可以看出Prometheus-k8s这个用户的权限只有get权限
root@kcsmaster1:/apprun/kube-prometheus-release-0.13/manifests# cat manifests/prometheus-clusterRole.yaml
apiVersion: rbac.authorization.k8s.io/v1
kind: ClusterRole
metadata:
  labels:
    app.kubernetes.io/component: prometheus
    app.kubernetes.io/instance: k8s
    app.kubernetes.io/name: prometheus
    app.kubernetes.io/part-of: kube-prometheus
    app.kubernetes.io/version: 3.6.0
  name: prometheus-k8s
rules:
- apiGroups:
  - ""
  resources:
  - nodes/metrics
  verbs:
  - get
- nonResourceURLs:
  - /metrics
  - /metrics/slis
  verbs:
  - get
root@kcsmaster1:/apprun/kube-prometheus-release-0.13/manifests# cat prometheus-clusterRoleBinding.yaml
apiVersion: rbac.authorization.k8s.io/v1
kind: ClusterRoleBinding
metadata:
  labels:
    app.kubernetes.io/component: prometheus
    app.kubernetes.io/instance: k8s
    app.kubernetes.io/name: prometheus
    app.kubernetes.io/part-of: kube-prometheus
    app.kubernetes.io/version: 3.6.0
  name: prometheus-k8s
roleRef:
  apiGroup: rbac.authorization.k8s.io
  kind: ClusterRole
  name: prometheus-k8s
subjects:
- kind: ServiceAccount
  name: prometheus-k8s
  namespace: monitoring


#给pormetheus-k8s这个sa账号增加lsit权限
cat  prometheus-clusterRole.yaml
apiVersion: rbac.authorization.k8s.io/v1
kind: ClusterRole
metadata:
  labels:
    app.kubernetes.io/component: prometheus
    app.kubernetes.io/instance: k8s
    app.kubernetes.io/name: prometheus
    app.kubernetes.io/part-of: kube-prometheus
    app.kubernetes.io/version: 2.35.0
  name: prometheus-k8s
rules:
  - apiGroups:
      - ''
    resources:
      - nodes
      - services
      - endpoints
      - pods
      - nodes/proxy
    verbs:
      - get
      - list       #添加
      - watch
  - apiGroups:
      - ''
    resources:
      - configmaps
      - nodes/metrics
    verbs:
      - get
  - nonResourceURLs:
      - /metrics
    verbs:
      - get


kubectl apply -f  prometheus-clusterRole.yaml
2.4.Prometheus Server组件的配置
修改完Prometheus server的配置后需要热加载几次服务配置才有可能生效
curl -X POST http://10.10.165.214:9090/-/reload
#####
参考链接:https://github.com/prometheus-operator/prometheus-operator/blob/main/Documentation/additional-scrape-config.md
参考链接:https://prometheus.io/docs/prometheus/latest/configuration/configuration/#scrape_config
一个scrape_config部分指定一组目标及其参数,用于描述如何抓取这些目标。通常情况下,一个抓取配置指定一个作业。在高级配置中,这种情况可能会发生变化。

root@kcsmaster1:~# kubectl explain prometheus.spec.additionalScrapeConfigs
GROUP:      monitoring.coreos.com
KIND:       Prometheus
VERSION:    v1

FIELD: additionalScrapeConfigs <Object>

DESCRIPTION:
    AdditionalScrapeConfigs allows specifying a key of a Secret containing
    additional Prometheus scrape configurations. Scrape configurations specified
    are appended to the configurations generated by the Prometheus Operator. Job
    configurations specified must have the form as specified in the official
    Prometheus documentation:
    https://prometheus.io/docs/prometheus/latest/configuration/configuration/#scrape_config.
    As scrape configs are appended, the user is responsible to make sure it is
    valid. Note that using this feature may expose the possibility to break
    upgrades of Prometheus. It is advised to review Prometheus release notes to
    ensure that no incompatible scrape configs are going to break Prometheus
    after the upgrade.

FIELDS:
  key   <string> -required-
    The key of the secret to select from.  Must be a valid secret key.

  name  <string>
    Name of the referent. More info:
    https://kubernetes.io/docs/concepts/overview/working-with-objects/names/#names
    TODO: Add other useful fields. apiVersion, kind, uid?

  optional      <boolean>
    Specify whether the Secret or its key must be defined
2.5.Prometheus Rule组件的配置
#可以看到rulefiles存放在什么位置
root@kcsmaster1:~/operator-prometheus# kubectl get pod prometheus-k8s-0 -n monitoring -oyaml |grep rulefiles
#进入pormetheus-k8s-0pod中查看rulefile文件
/etc/prometheus/rules/prometheus-k8s-rulefiles-0 $ ls
monitoring-alertmanager-main-rules-b8c5ad60-bfcf-44a4-a323-0c69a80344d0.yaml          monitoring-kube-state-metrics-rules-e06a46f6-813e-49e3-b9a3-a3a0298ccb0c.yaml
monitoring-etcd-rules-eaf0aec6-ad69-40b2-979d-fc389e50a29f.yaml                       monitoring-kubernetes-monitoring-rules-0f3274f3-3302-463a-920b-88ca3f4a8c01.yaml
monitoring-grafana-rules-4df813fd-dfc4-4e01-86ed-3b965f6135e1.yaml                    monitoring-prometheus-k8s-prometheus-rules-697b0fc5-1792-4b8d-ac58-5fe88f1d052a.yaml
monitoring-kube-prometheus-rules-05c30a12-47d7-4f0b-8c34-d8b1920f6209.yaml            monitoring-prometheus-operator-rules-773650e9-fc6d-44bb-afc9-e5623c6262f8.yaml
/etc/prometheus/rules/prometheus-k8s-rulefiles-0 $ pwd
/etc/prometheus/rules/prometheus-k8s-rulefiles-0

#我们自定义一个Etcd Rule
(1)参考Operator Prometheus自带的Rule CRD的规则
  ruleSelector:
    matchLabels:
      prometheus: k8s
      role: alert-rules

#实例:
root@kcsmaster1:/apprun/kube-prometheus-release-0.13/manifests# cp alertmanager-prometheusRule.yaml etcd-Ruleprometheus.yaml
root@kcsmaster1:/apprun/kube-prometheus-release-0.13/manifests# cat  etcd-Ruleprometheus.yaml
apiVersion: monitoring.coreos.com/v1
kind: PrometheusRule       #CRD资源类型
metadata:
  labels:  #prometheus-prometheus.yaml文件里面的ruleselect的标签选择是{},在生产环境这样配置就意味所有的rule都会采集对Prometheus server服务本身产生很大的数据压力,故需要把rometheus-prometheus.yaml里面的ruleselect的标签选择配置需和Rule CRDyaml文件里面的保持一致
    prometheus: k8s
    role: alert-rules
  name: etcd-rules           #rule的名称
  namespace: monitoring      #命名空间必须是这个
spec:
  groups:
  - name: etcd.rules    #组名
    rules:
    - alert: EtcdClusterUnavailable
      annotations:    #注释
        description: Configuration has failed to load for {{ $labels.namespace }}/{{ $labels.pod}}.
        summary: Reloading an Alertmanager configuration has failed.
      expr: |
        count(up{job="etcd"} == 0 ) > (count(up{job="etcd"}) / 2 -1)    #触发告警的pro Sql语句
      for: 10m
      labels:
        severity: critical           #告警等级
2.6.AlertManager组件的配置
- 编写编写AlertmanagerConfig CRD资源对象文件
root@kcsmaster1:~/operator-prometheus# cat alertmanager-config.yaml
apiVersion: monitoring.coreos.com/v1alpha1
kind: AlertmanagerConfig
metadata:
  name: feishu
  namespace: monitoring
  labels:
    alertmanagerConfig: alertmanager-server    #这个标签需要alertmanager-alertmanager.yaml 里面的alertmanagerConfigSelector保持一致,如果不一致alertmanager服务读取不到AlertmanagerConfig CRD资源配置文件

root@kcsmaster1:~/operator-prometheus#   vim alertmanager-alertmanager.yaml
...............................................................
alertmanagerConfigSelector:
    matchLabels:
      alertmanagerConfig: alertmanager-server   #用来匹配alertmanager-config文件的

#修改完配置需要热加载alertmanager服务几次,否则配置可能没有生效
curl -X POST http://10.10.115.146:9093/-/reload
- 修改 alertmanager-alertmanager.yaml 文件
root@kcsmaster1:~/operator-prometheus#   vim alertmanager-alertmanager.yaml
...............................................................
alertmanagerConfigSelector:
    matchLabels:
      alertmanagerConfig: example   #用来匹配alertmanager-config文件的


#检查是否配置成功
root@kcsmaster1:/apprun/kube-prometheus-release-0.13/manifests# kubectl get secret alertmanager-main-generated -n monitoring -o jsonpath='{.data.alertmanager\.yaml\.gz}' | base64 -d | gunzip

注意:也可以进入alertmanager-main-0pod里面的alertmanager.env.yaml有没有加载你的配置
root@kcsmaster1:~# kubectl exec -it alertmanager-main-0 -n monitoring -- cat /etc/alertmanager/config_out/alertmanager.env.yaml

有“AI”的1024 = 2048,欢迎大家加入2048 AI社区
更多推荐


 13
13 0
0- 0


 已为社区贡献1条内容

所有评论(0)