3、prometheus-服务发现-1
promethes服务发现
本章要点:自动发现原理、基于文件,基于DNS
自动发现原理详解
Prometheus的自动发现(Service Discovery,简称SD)机制,是为解决静态配置在动态环境中的局限性而设计的核心功能。在容器化、微服务等场景中,监控目标(如Pod、节点)频繁创建与销毁,静态配置需手动维护目标列表,效率低下且易出错,而自动发现可实现目标的动态识别、更新与管理,无需人工干预。
-
核心逻辑:注册中心驱动的动态联动
自动发现的核心是引入“注册中心”作为中介,建立监控目标与Prometheus的联动桥梁,核心逻辑可概括为“目标主动注册+Prometheus定期拉取”:
- 目标注册:所有待监控的目标(如部署Node Exporter的节点、运行业务的容器)启动后,会主动将自身关键信息(IP地址、监控端口、所属服务、环境标签等)注册到指定的注册中心(即SD组件)。
- 定期拉取:Prometheus根据配置的刷新间隔(默认5分钟,可通过
refresh_interval自定义),定期从注册中心拉取最新的目标列表,对比本地缓存的旧列表。 - 动态更新:Prometheus自动添加新注册的目标、移除已离线的目标,整个过程无需修改配置文件或重启服务,实现监控目标的实时同步。
-
关键流程:从发现到抓取的完整链路
自动发现并非孤立环节,而是与Prometheus的指标抓取流程深度融合,完整链路包含4个关键步骤:
-
目标发现:Prometheus通过配置的服务发现类型(如文件、DNS、K8s API)对接注册中心,获取原始目标列表及元数据。
-
元标签生成:发现目标后,Prometheus会为每个目标自动添加前缀为
__的元标签(内置标签),用于标识目标的核心属性,例如:__address__:目标的IP:端口(如10.4.50.130:9100);__scheme__:访问协议(默认http);__meta_*:注册中心提供的元数据(如K8s场景的__meta_kubernetes_pod_name)。
-
标签重写(Relabeling):通过配置
relabel_configs对元标签进行加工,例如过滤无效目标、修改标签名称、添加业务标签等,最终生成可供抓取使用的标准标签(如instance、env)。 -
指标抓取:加工后的目标进入抓取队列,Prometheus按
scrape_interval(默认15秒)定期发起HTTP请求,从目标的/metrics路径获取指标数据,完成采集。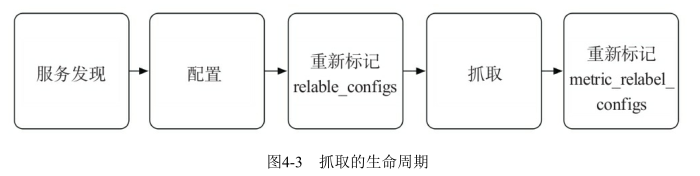
-
适配不同场景的注册中心类型
基于文件的服务发现
-
说明:以JSON/YAML文件作为注册中心,文件中定义目标列表及标签。Prometheus定期读取文件内容,修改文件即可完成目标增删,无需重启服务,适合中小规模静态或半动态环境
-
示例
-
目标定义文件(如
/data/prometheus/targets/node_targets.yml)- targets: ["10.4.50.130:9100", "10.4.50.139:9100"] # 两个Node Exporter节点 labels: env: "production" # 业务标签:生产环境 job: "node-exporter" - targets: ["10.4.50.130:9090"] # Prometheus自身 labels: env: "production" job: "prometheus" -
Prometheus主配置(prometheus.yml)中引用
global: scrape_interval: 15s # 全局数据抓取间隔,控制 Prometheus 多久采集一次监控目标指标 evaluation_interval: 15s # 全局规则评估间隔,多久检查一次告警规则或记录规则 scrape_timeout: 10s # 单次数据抓取超时时间,超时未完成则本次采集失败 scrape_configs: - job_name: 'file-sd-job' file_sd_configs: - files: - "/data/prometheus/targets/*.yml" # 通配符匹配所有YAML目标文件 refresh_interval: 1m # 每1分钟刷新一次文件内容(默认5分钟) - job_name: 'other' .... -
查看
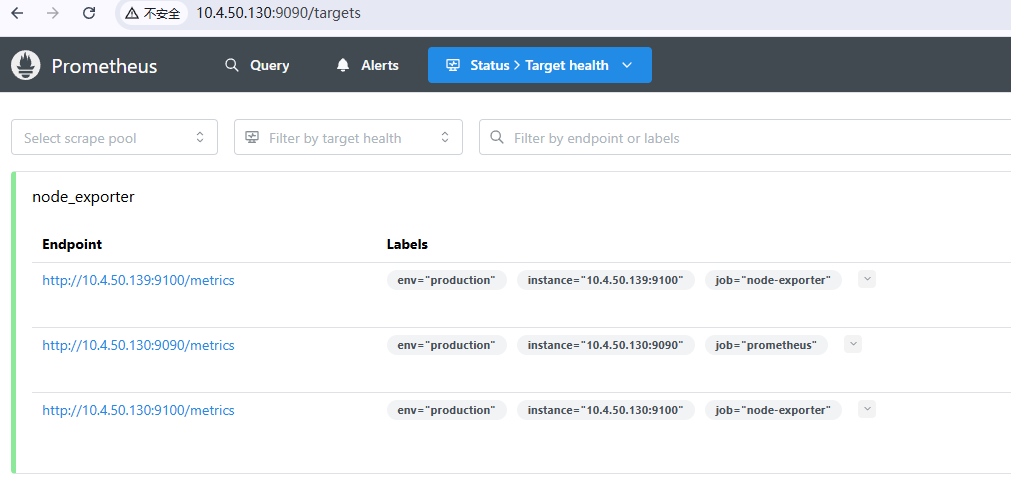
-
基于DNS服务发现
Prometheus DNS服务发现支持多种DNS记录类型,不同类型适配不同场景,核心类型如下:
-
完整配置示例: 安装请参考Linux BIND9服务器搭建文档
-
DNS服务器
-
本机修改DNS
本机]# /etc/sysconfig/network-scripts/ifcfg-ens192 # 加上 DNS1: "地址" # 重启网卡 -
添加目标记录、以Bind9 DNS服务器为例,添加SRV记录和A记录
[root@localhost named]# cat example.com.zone $TTL 1D @ IN SOA dns-master.example.com. admin.example.com. ( 0 ; serial 1D ; refresh 1H ; retry 1W ; expire 3H ) ; minimum IN NS dns-master.example.com. dns-master.example.com. IN A 10.4.50.167 _node1._tcp.example.com IN SRV 10 80 9100 node1.example.com. _node2._tcp.example.com IN SRV 20 50 9100 node2.example.com. _node3._tcp.example.com IN SRV 20 50 9100 node3.example.com. node1.example.com. IN A 10.4.50.130 node2.example.com. IN A 10.4.50.139 node3.example.com. IN A 10.4.50.167 130 --> promethes 130,139,167 --> 三个node 167 --> dns -
配置完成后重启DNS服务,验证解析结果:
# 如果查询为空, nslookup也异常
[root@localhost named]# dig @10.4.50.167  _node2._tcp.example.com SRV +short

# 修改一下dns主机内容
DNS主机] # vim /etc/named.conf
options {
    ...
    allow-query { any; };  # 允许所有主机查询(生产环境建议限制网段)
    # 或更安全的配置:allow-query { 10.4.50.0/24; };
    ...
};

zone "example.com" IN {
    type master;  // 角色为主服务器
    file "example.com.zone";  // 正向解析文件名称(存储在/var/named/目录下)
    allow-transfer { any; };  # 临时允许所有主机同步(测试用)
};

# 在查
[root@localhost prometheus]# dig @10.4.50.167  _node1._tcp.example.com SRV +short
10 80 9100 node1.example.com.

[root@localhost prometheus]# nslookup node1.example.com 10.4.50.167
Server:		10.4.50.167
Address:	10.4.50.167#53

Name:	node1.example.com
Address: 10.4.50.130
-
-
Prometheus主配置(prometheus.yml)
-
场景1:基于SRV记录的服务发现(Node Exporter监控),
# 分别配置SRV记录解析和A记录解析的服务发现规则,适配不同场景。 global: scrape_interval: 15s # 全局抓取间隔 evaluation_interval: 15s # 规则评估间隔 scrape_configs: - job_name: 'node-exporter-node1' dns_sd_configs: - names: ['_node1._tcp.example.com','_node2._tcp.example.com'] type: SRV refresh_interval: 10s -
场景2:基于A记录的服务发现 - 直接写port
  - job_name: 'node-exporter-node1'
    ....
  - job_name: 'node-exporter-node2'
    dns_sd_configs:
      - names: ['node2.example.com']  # 仅写纯域名(A记录域名)
        type: A                       # 记录类型A
        refresh_interval: 10s
        port: 9100                    # 关键:指定node-exporter的端口(A记录无端口,需手动加)
    metrics_path: '/metrics'
    scheme: 'http'
    # 如需添加标签,可加relabel_configs(可选)
    relabel_configs:
      - source_labels: []
        target_label: 'env'
        replacement: 'production'

# 每次配置完,多用check检查一下配置是否正常
[root@localhost prometheus]# ./promtool check config prometheus.yml
Checking prometheus.yml
 SUCCESS: prometheus.yml is valid prometheus config file syntax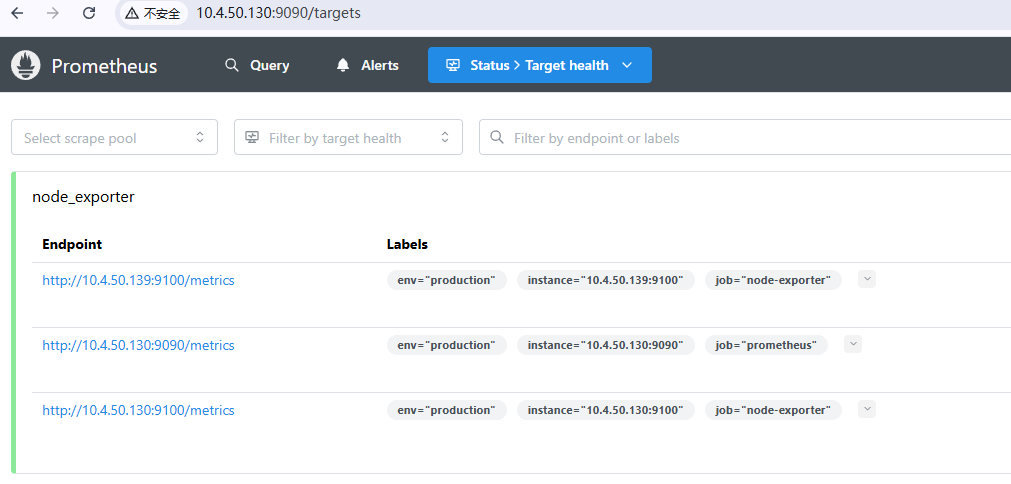
-
-
-
验证服务发现效果
配置完成后重启Prometheus,通过以下方式验证服务发现是否生效:
- WebUI验证:访问Prometheus WebUI(http://IP:9090),进入“Status → Targets”页面,可看到“node-exporter-srv”和“prometheus-a”两个Job下的目标,状态为“UP”表示发现成功。
- 新增目标测试:在DNS服务器中新增一条SRV记录(如添加node3.prod.example.com的9100端口),等待1分钟(配置的refresh_interval)后,WebUI中会自动出现新目标,无需修改Prometheus配置。
- 离线目标测试:删除DNS服务器中的某条SRV记录,等待刷新间隔后,该目标会从Prometheus的Target列表中消失。
-
关键注意事项
- DNS服务器可靠性:DNS服务是核心依赖,需确保DNS服务器高可用(如主从架构),避免DNS故障导致服务发现失效。
- 刷新间隔合理设置:refresh_interval过短会增加DNS服务器压力,过长会导致目标更新延迟,建议根据业务变动频率设置(如1-5分钟)。
- 标签管理优化:可通过
relabel_configs对解析到的目标添加自定义标签(如环境、业务线),便于后续指标过滤和聚合。 - 端口处理逻辑:SRV记录可自动获取端口,A/AAAA记录需通过relabel_configs手动拼接端口,避免端口错误导致抓取失败。
- 权限控制:确保Prometheus服务器有权限访问DNS服务器的53端口(UDP/TCP),避免防火墙或安全组拦截。
-
适用场景:
- 基于DNS管理服务地址的传统微服务架构;
- 监控目标端口不固定,需动态传递端口信息的场景;
- 不想额外部署注册中心(如Consul、Etcd)的轻量化场景。
-
局限性:
- 不支持复杂元数据(如服务健康状态、业务标签)的传递,仅能获取地址和端口;
- 大规模集群(千级以上目标)场景下,DNS解析效率可能下降,建议改用API型服务发现(如K8s SD)。
问题记录
-
一直无法获取target
# 查看 [root@127 named]# cat /etc/resolv.conf  <-- 需要指定本机的DNS
nameserver 10.4.50.167

# 启动文件中指定对应的本机DNS服务器地址
[root@localhost prometheus]# cat /usr/lib/systemd/system/prometheus.service
[Service]
Environment="DNS_SERVERS=10.4.50.167:53"

[root@localhost prometheus]# pgrep prometheus
4529    <--- 获取对应的Pid号
[root@localhost prometheus]# cat /proc/4529/environ | tr '\0' '\n' | grep DNS_SERVERS
DNS_SERVERS=10.4.50.167:53

# 查看能否打印出对应的记录
[root@localhost prometheus]# dig SRV _node1._tcp.example.com @10.4.50.167
;; ANSWER SECTION:
_node1._tcp.example.com. 86400	IN	SRV	10 80 9100 node1.example.com.

;; AUTHORITY SECTION:
example.com.		86400	IN	NS	dns-master.example.com.

;; ADDITIONAL SECTION:
node1.example.com.	86400	IN	A	10.4.50.130
dns-master.example.com.	86400	IN	A	10.4.50.167

# 修改配置文件,刷新的频率快一点,用于测试..
[root@localhost prometheus]# vi prometheus.yml
  - job_name: 'node-exporter-node1'
    dns_sd_configs:
      - names: ['_node1._tcp.example.com']
        type: SRV
        refresh_interval: 10s

有“AI”的1024 = 2048,欢迎大家加入2048 AI社区
更多推荐

 8
8 0
0- 0


 已为社区贡献11条内容

所有评论(0)