c++ 画数学函数图
本文总结了在C++中绘制数学函数图的3种方法:1.调用Python API使用matplotlib画图,需配置Python.h路径并初始化解释器;2.使用matplotlib-cpp库,需修改源码并正确配置路径;3.使用Qt的QPainter绘制,但功能较简单。前两种方法推荐使用TkAgg后端避免卡死,并提供了正弦函数和动画的示例代码。第三种方法因配置复杂未成功使用。文章比较了各方法的优缺点,为C
·
c++ 画数学函数图并不像 python 方便,经过我半年多的探索,总结了以下几种方式:
1. 调用 python API 使用 matplotlib 画图
这种方法是最直接,需要的设置最少:
- 调用Python 提供的 C API 头文件 Python.h,可以在 cmake 中设置 Python.h 文件的路径;
- 通过
PyRun_SimpleString("import matplotlib; matplotlib.use('TkAgg')");设置使用 TkAgg 后端,避免 Qt6Agg 卡死; - 通过
Py_Initialize();初始化 Python 解释器; - 通过
PyRun_SimpleString将 Python的代码用字符串形式传递给它; - 通过
Py_Finalize();结束 Python 解释器.
下面的代码画了一个正弦函数:
#include <Python.h>

int main() {
  // 初始化 Python 解释器
  Py_Initialize();

  // 导入 Python 模块
  // TkAgg 通常更稳定,不容易阻塞
  PyRun_SimpleString("import matplotlib; matplotlib.use('TkAgg')");
  PyRun_SimpleString("import matplotlib.pyplot as plt");
  PyRun_SimpleString("import numpy as np");

  // 定义 x 和 y 数据
  PyRun_SimpleString("x = np.linspace(0, 2*np.pi, 100)\n"
                     "y = np.sin(x)");

  // 绘制图形
  PyRun_SimpleString("plt.plot(x, y)\n"
                     "plt.title('y = sin(x)')\n"
                     "plt.xlabel('x')\n"
                     "plt.ylabel('y')\n"
                     "plt.grid(True)\n"
                     "plt.show()");

  // 结束 Python 解释器
  Py_Finalize();

  return 0;
}

下面的代码画了一个动画:
#include <Python.h>
#include <string>

int main() {
  // 初始化 Python
  Py_Initialize();

  // 强制使用 TkAgg 后端,避免 Qt6Agg 卡死
  PyRun_SimpleString("import matplotlib; matplotlib.use('TkAgg')");
  PyRun_SimpleString("import matplotlib.pyplot as plt");
  PyRun_SimpleString("import numpy as np");
  PyRun_SimpleString("import time");

  // 初始化图形
  // PyRun_SimpleString("plt.ion()"); // 开启交互模式
  PyRun_SimpleString("fig, ax = plt.subplots()");
  PyRun_SimpleString("x = np.linspace(0, 2*np.pi, 200)");
  PyRun_SimpleString("line, = ax.plot(x, np.sin(x))");
  PyRun_SimpleString("ax.set_ylim(-1.5, 1.5)");

  // 在 C++ 循环里调用 Python 更新数据
  for (int i = 0; i < 200; i++) {
    std::string cmd = "line.set_ydata(np.sin(x + " + std::to_string(i * 0.1) +
                      "))\n"
                      "plt.draw()\n" // plt.draw() 刷新图形
                      "plt.pause(0.05)";
    PyRun_SimpleString(cmd.c_str()); // PyRun_SimpleString 需要一个 C 风格字符串 (const char*)
                                     // 作为输入,因此需要c_str()函数转化
  }

  PyRun_SimpleString("plt.savefig('pic.png')");
  // 等待用户关闭窗口
  PyRun_SimpleString("plt.show()");
  // PyRun_SimpleString("plt.ioff()\nplt.show()");

  // 关闭 Python
  Py_Finalize();
  return 0;
}
2. 下载调用一个库 matplotlib-cpp
这个库可以在 github 中克隆,但好几年没更新了,随着相关库的更新,这个画图库可能会有一些小 bug,需要修改一些配置才能正确运行。例如:
- 要注释或删除 matplotlib-cpp.h 文件中下面的两行代码:
template <> struct select_npy_type<long long> { const static NPY_TYPES type = NPY_INT64; };

template <> struct select_npy_type<unsigned long long> { const static NPY_TYPES type = NPY_UINT64; };
因为这两行代码重复定义了模板结构,导致出错。
- 必须找到所安装 python 的头文件路径,numpy 的头文件路径,python 链接库的路径,在 cmake 中设置好
- 调用头文件
matplotlibcpp.h; - 通过
plt::backend("TkAgg");设置使用 TkAgg 后端,避免 Qt6Agg 卡死.
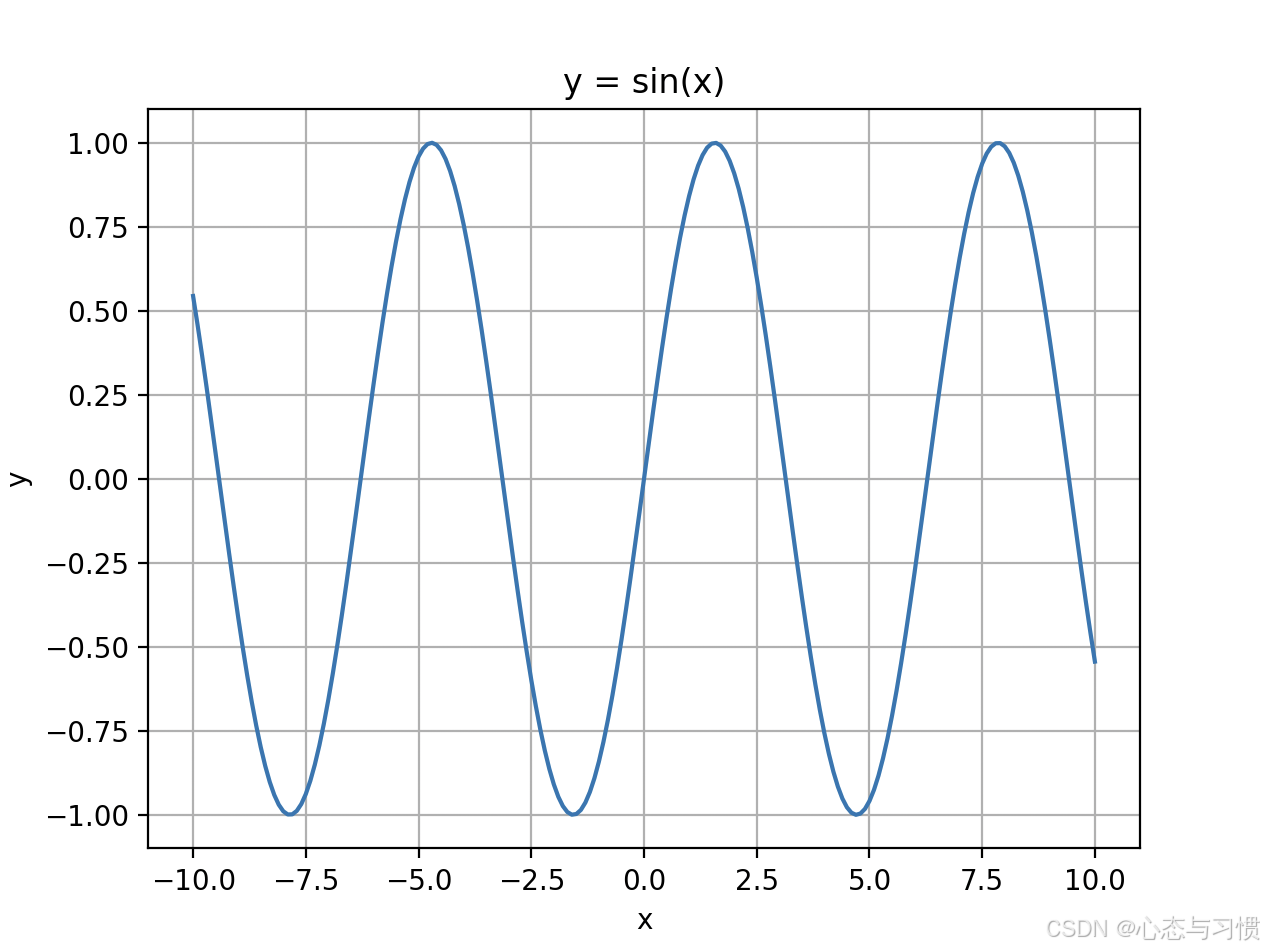
与第一种方法相比,代码方便,但是需要的设置较多。下面是我用这个库画的函数图形。
#include "../utils/matplotlibcpp.h"
#include <vector>


namespace plt = matplotlibcpp;

int main() {
  std::vector<double> x, y;

  // 强制使用 TkAgg 后端,避免 Qt6Agg 卡死
  plt::backend("TkAgg");  // 等价于 python 中的命令 matplotlib.use("TkAgg")

  for (double i = -10; i <= 10; i += 0.1) {
    x.push_back(i);
    // y.push_back(i * i);  // y = x^2
    y.push_back(std::sin(i)); // y = sin(x)
  }
  plt::plot(x, y);
  plt::title("y = sin(x)");
  plt::xlabel("x");
  plt::ylabel("y");
  plt::grid(true);
  plt::show();

  return 0;
}
画一个动画:
#include "../utils/matplotlibcpp.h"
#include <vector>

namespace plt = matplotlibcpp;

int main() {
  std::vector<double> x, y;
  // 强制使用 TkAgg 后端,避免 Qt6Agg 卡死
  plt::backend("TkAgg");  // 等价于 python 中的命令 matplotlib.use("TkAgg")

  for (int i = 0; i < 100; ++i) {
    x.push_back(i);
    y.push_back(std::sin(i * 0.1));

    plt::clf(); // 清除上一帧
    plt::plot(x, y);
    plt::pause(0.05); // 暂停一会用于刷新图像
  }

  plt::show(); // 最后显示
  return 0;
}
3. 画图库 JKQtPlotter
这个基于 Qt,但是安装库各种错误,始终没有成功。github 主页的介绍非常晦涩,我始终没看明白这个库的 cmake 到底要怎么配置。但是,若将这个库下载下来,直接以项目的形式打开,里面的例子能够正确运行。但还是不方便,我只想调用这个库,并不想每次都在你这个库里新建项目。
- 最后找到了 qt 自带的 QPainter,这个就方便多了。qt 是 c++ 使用非常广的开发图形库,非常容易配置 cmake。而且,对于画一些数学函数图,基本够用了。初步使用起来类似 java 的 JFrame。不过用了几次发现这个库的坐标系太简单了,很多设置都没有。
下面是 QPinter 生成的一个简单的正弦函数线图:
#include <QApplication>
#include <QWidget>
#include <QPainter>
#include <cmath>

class FunctionPlotter : public QWidget {
protected:
    void paintEvent(QPaintEvent *) override {
        QPainter painter(this);
        painter.setRenderHint(QPainter::Antialiasing);

        // 坐标轴
        painter.setPen(Qt::black);
        // 两个点坐标之间的连线
        painter.drawLine(20, height() / 2, width() - 20, height() / 2); // X轴
        painter.drawLine(width() / 2, 20, width() / 2, height() - 20); // Y轴

        // 画函数 y = sin(x)
        painter.setPen(Qt::red);
        for (int x = -width() / 2; x < width() / 2; x++) {
            int y1 = -std::sin(x / 50.0) * 100; // 归一化
            int y2 = -std::sin((x + 1) / 50.0) * 100;
            painter.drawLine(width() / 2 + x, height() / 2 + y1,
                             width() / 2 + x + 1, height() / 2 + y2);
        }
    }
};

int main(int argc, char *argv[]) {
    QApplication app(argc, argv);
    FunctionPlotter plotter;
    plotter.resize(600, 400);
    plotter.setWindowTitle("数学函数绘制");
    plotter.show();

    return app.exec();
}
没有保存图片的功能,但可以直接用电脑截图保存,也可以用 QPainter 里面一些保存图片的函数。
4. Gnuplot
这个本质上是调用 gnuplot 这个画图软件。需要知道一些 gnuplot 的画图命令,不过支持的图形挺多的。

有“AI”的1024 = 2048,欢迎大家加入2048 AI社区
更多推荐
 3
3 0
0- 0


 已为社区贡献12条内容

所有评论(0)