云计算学习100天-第38天 -zabbix监控6
242 RefreshActiveChecks=120#主动检查模式(Active Check) 下 Agent 向 Server 请求监控项配置列表的频率,单位秒。# handled:自nginx启动之后,处理过的客户端连接总数,通常等于accepts的值。默认zabbix使用的是被动监控,主被动监控都是针对被监控主机而言的。# requests:自nginx启动之后,处理过的客户端请求总数。
八、配置web2使用主动监控
当监控主机达到一定量级后,zabbix服务器会越来越慢
此时就可以考虑使用主动监控,释放服务器压力
另外,zabbix也支持分布式监控
默认zabbix使用的是被动监控,主被动监控都是针对被监控主机而言的。
被动监控:Server向Agent发起请求,索取监控数据。此种模式常用
主动监控:Agent向Server发起连接,向Server汇报
1、修改配置文件,只使用主动监控
[root@web2 ~]# vim /etc/zabbix/zabbix_agentd.conf
117 # Server=127.0.0.1,192.168.88.5
142 StartAgents=0 #初始zabbix客户端数量
171 ServerActive=192.168.88.5 #zabbix服务端地址
242 RefreshActiveChecks=120 #主动检查模式(Active Check) 下 Agent 向 Server 请求监控项配置列表的频率,单位秒
# 重启服务
[root@web2 ~]# systemctl restart zabbix-agent.service
[root@web2 ~]# ss -tlnp | grep :10050 # 端口号消失
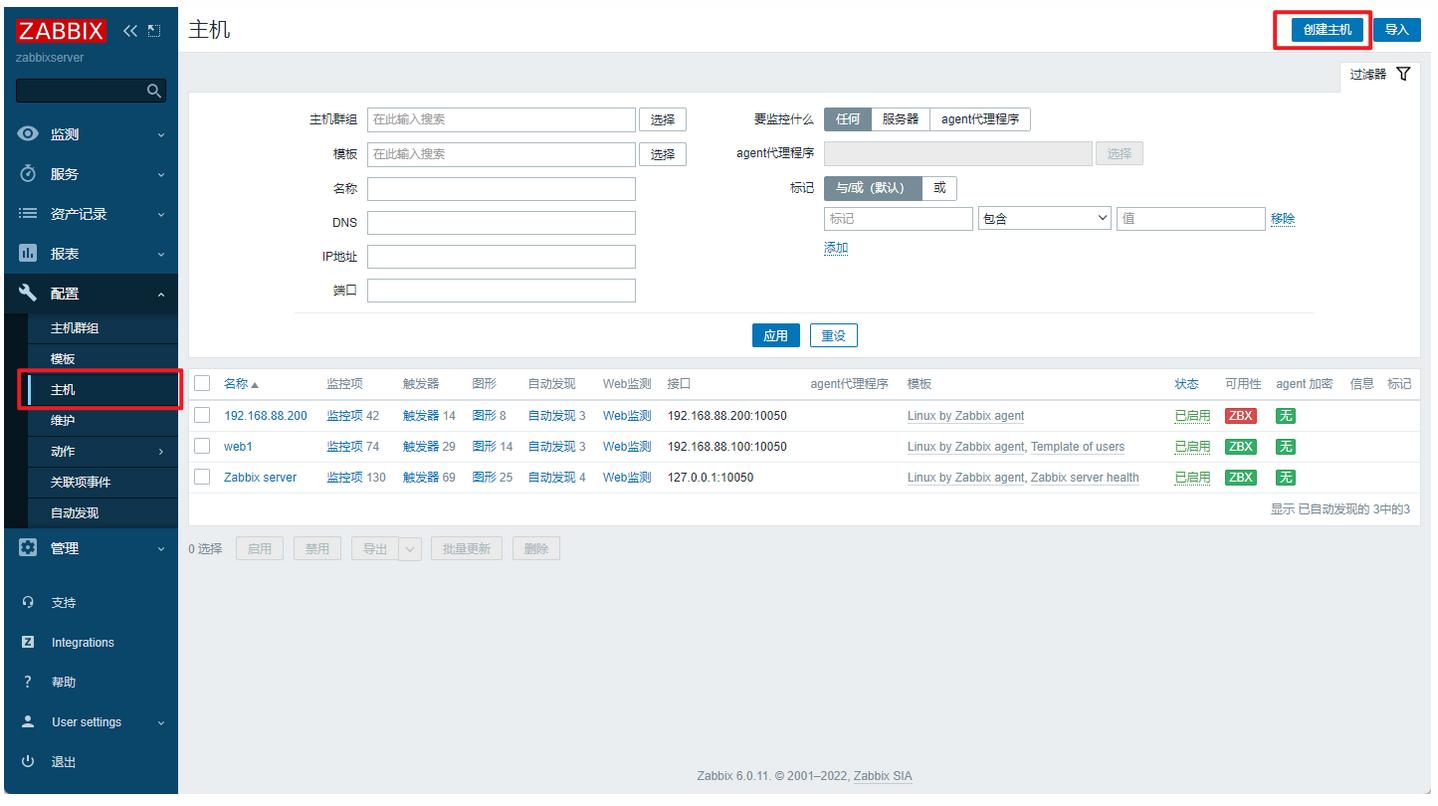
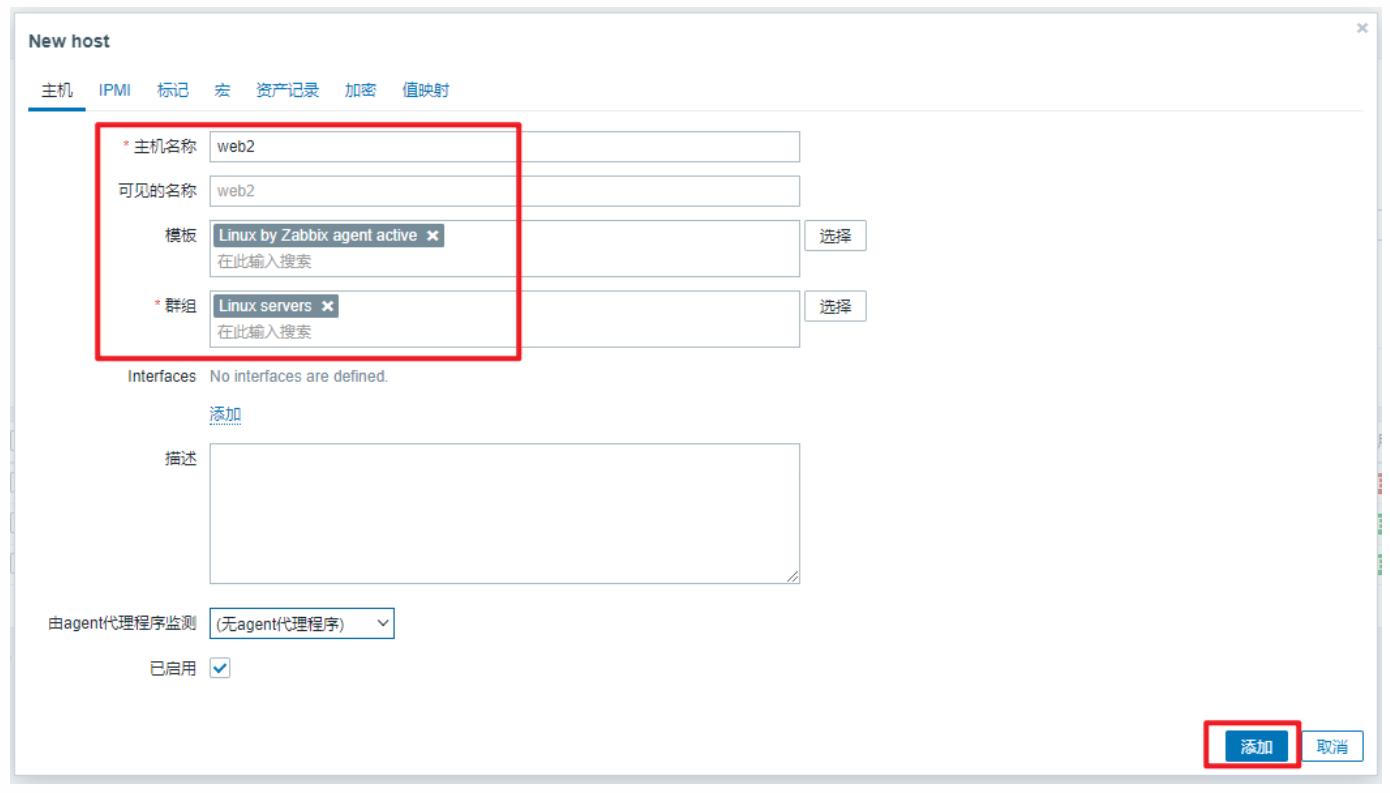
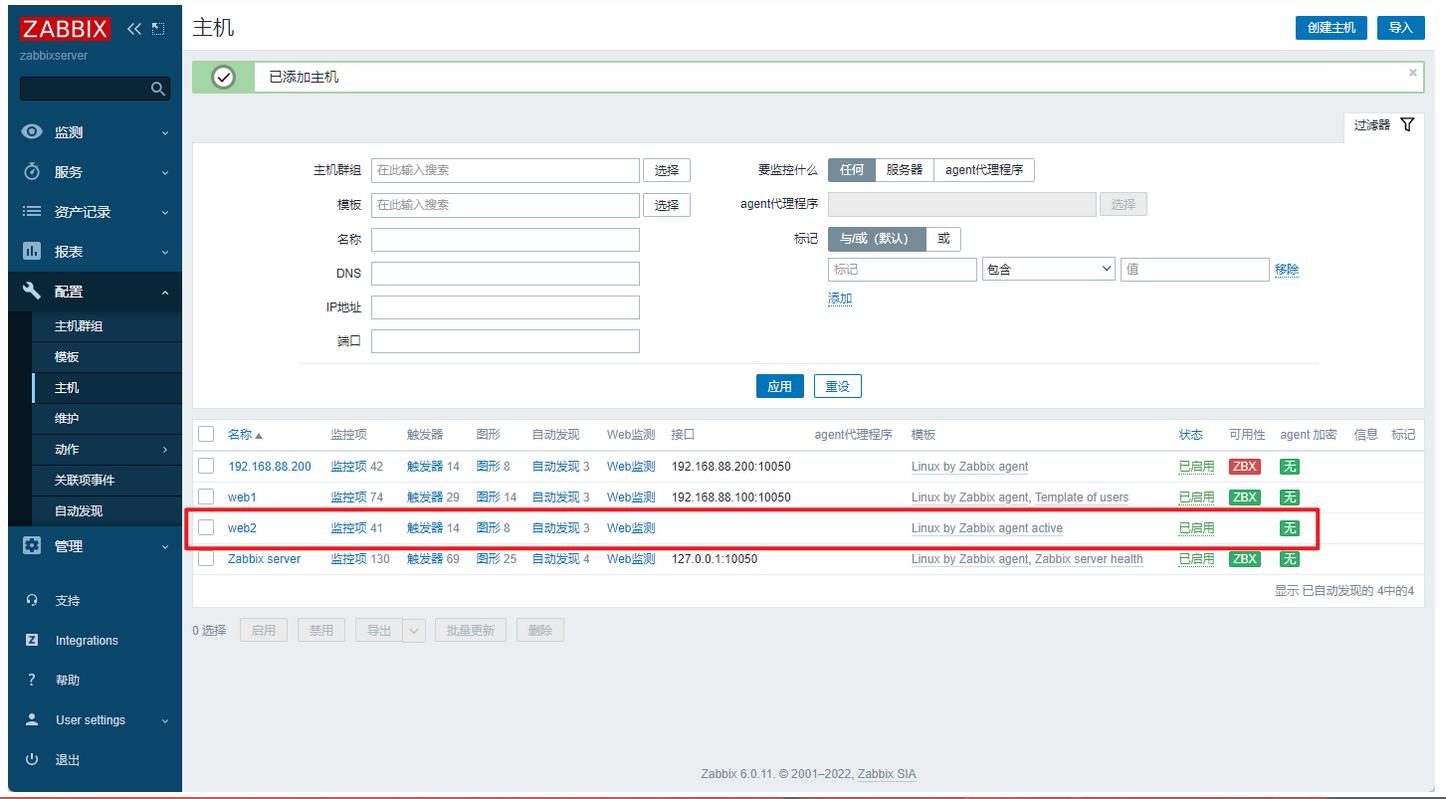
2、创建用于主动监控的主机
配置——主机——创建主机——添加
九、监控Nginx
stub_status模块——
用于实时监控nginx的网络连接,这个模块是nginx官方提供的一个模块。
1、配置nginx
[root@pubserver zabbix]# vim 07_config_nginx.yml
---
- name: config nginx
hosts: webservers
tasks:
- name: install nginx # 安装nginx
yum:
name: nginx
state: present
- name: start nginx # 启动nginx
service:
name: nginx
state: started
enabled: yes
[root@pubserver zabbix]# ansible-playbook 07_config_nginx.yml
# 修改配置文件,启用stub_status功能
[root@web1 ~]# vim /etc/nginx/nginx.conf
...略...
47 location / {
48 }
49
50 location /status { # 在此处添加3行
51 stub_status on;
52 }
53
54 error_page 404 /404.html;
55 location = /40x.html {
56 }
...略...
[root@web1 ~]# systemctl restart nginx
2、访问监控页面
[root@zabbixserver ~]# curl http://192.168.88.100/status
Active connections: 1
server accepts handled requests
2 2 2
Reading: 0 Writing: 1 Waiting: 0
# Active connections:当前客户端与nginx之间的连接数。它等于下面Reading / Writing / Waiting之和
# accepts:自nginx启动之后,客户端访问的总量
# handled:自nginx启动之后,处理过的客户端连接总数,通常等于accepts的值。
# requests:自nginx启动之后,处理过的客户端请求总数。
# Reading:正在读取客户端的连接总数。
# Writing:正在向客户端发送响应的连接总数。
# Waiting:空闲连接。
# 使用工具向服务器发起多个请求
[root@zabbixserver ~]# yum install -y httpd-tools
# 一共发1000个请求,每次并发数200
[root@zabbixserver ~]# ab -n1000 -c200 http://192.168.88.100/
[root@zabbixserver ~]# curl http://192.168.88.100/status
Active connections: 1
server accepts handled requests
1097 1097 1003
Reading: 0 Writing: 1 Waiting: 0
3、编写脚本,用于获取各项数据
[root@web1 ~]# vim /usr/local/bin/nginx_status.sh
#!/bin/bash
case $1 in
active)
curl -s http://192.168.88.100/status | awk '/Active/{print $NF}';;
waiting)
curl -s http://192.168.88.100/status | awk '/Waiting/{print $NF}';;
accepts)
curl -s http://192.168.88.100/status | awk 'NR==3{print $1}';;
esac
[root@web1 ~]# chmod +x /usr/local/bin/nginx_status.sh
[root@web1 ~]# nginx_status.sh active
1
[root@web1 ~]# nginx_status.sh accepts
1099
[root@web1 ~]# nginx_status.sh waiting
0
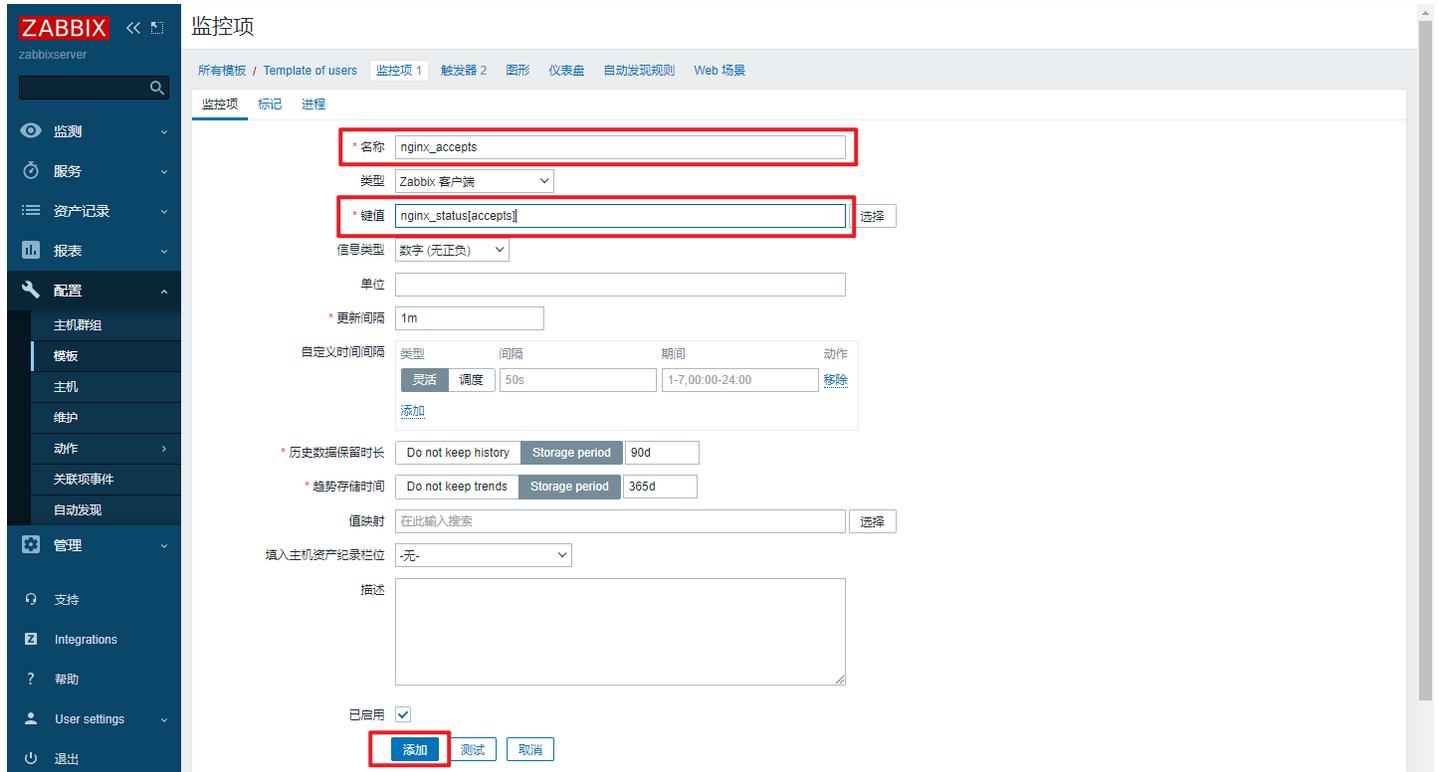
4、创建zabbix用到的key,获取各项数据
# key的语法格式
UserParameter=key[*],<command> $1
# key[*]中的*是参数,将会传给后面的位置变量$1
# 创建声明key的文件
[root@web1 ~]# vim /etc/zabbix/zabbix_agentd.d/nginx_status.conf
UserParameter=nginx_status[*],/usr/local/bin/nginx_status.sh $1
# 测试
[root@web1 ~]# systemctl restart zabbix-agent.service
[root@web1 ~]# zabbix_get -s 127.0.0.1 -k nginx_status[active]
1
[root@web1 ~]# zabbix_get -s 127.0.0.1 -k nginx_status[waiting]
0
[root@web1 ~]# zabbix_get -s 127.0.0.1 -k nginx_status[accepts]
1103
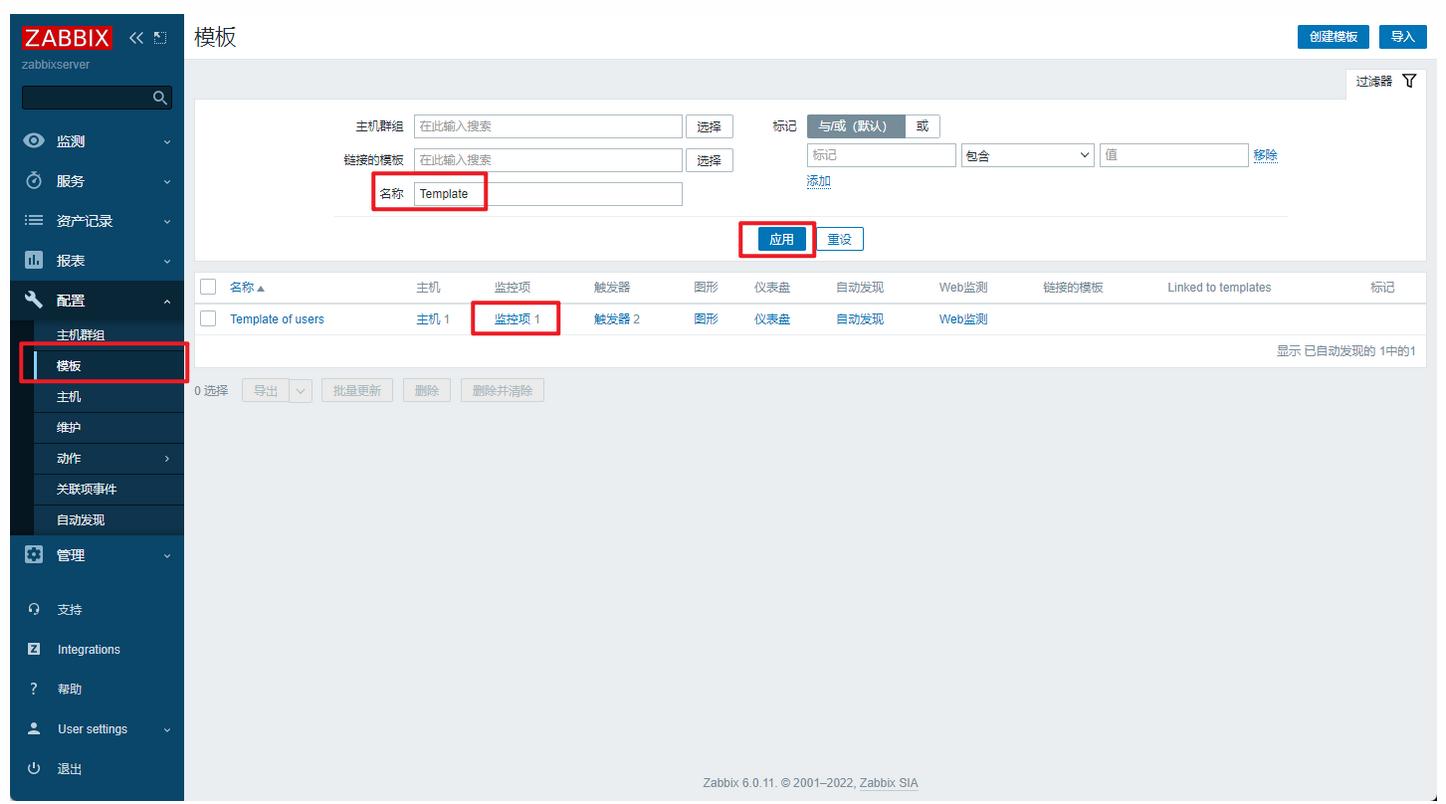
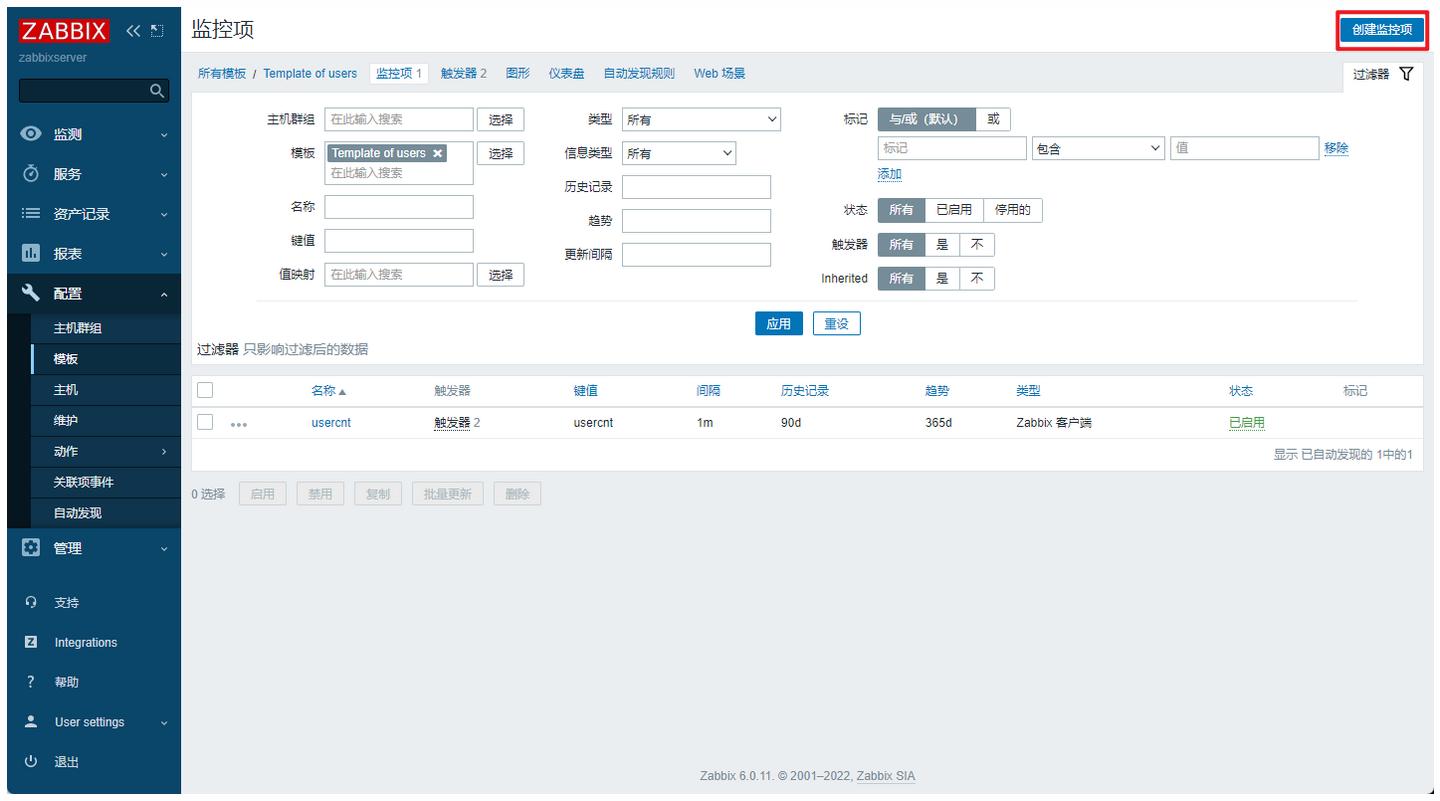
5、在zabbix上创建监控项
配置——模板——Template——监控项——创建监控项——添加
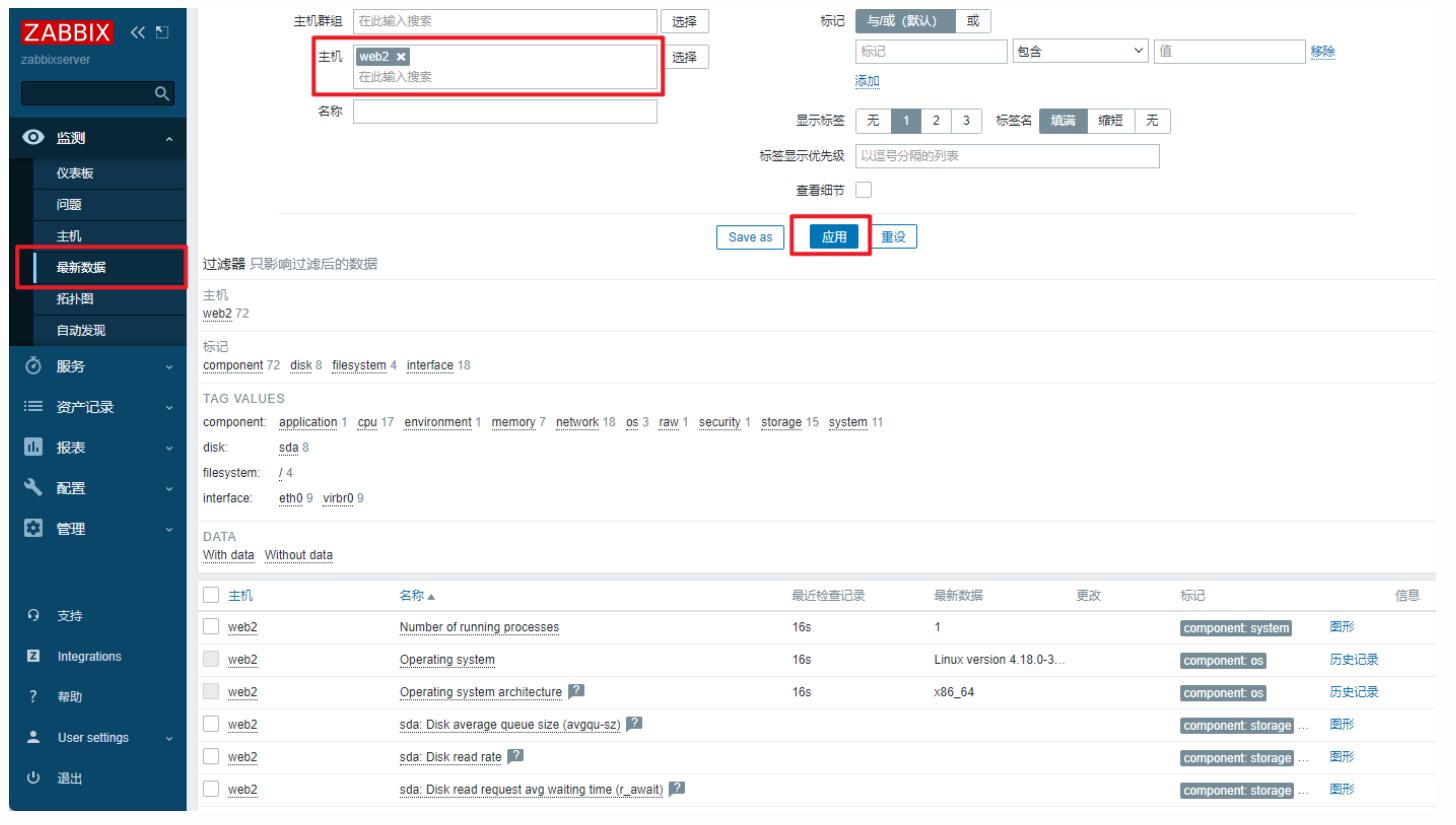
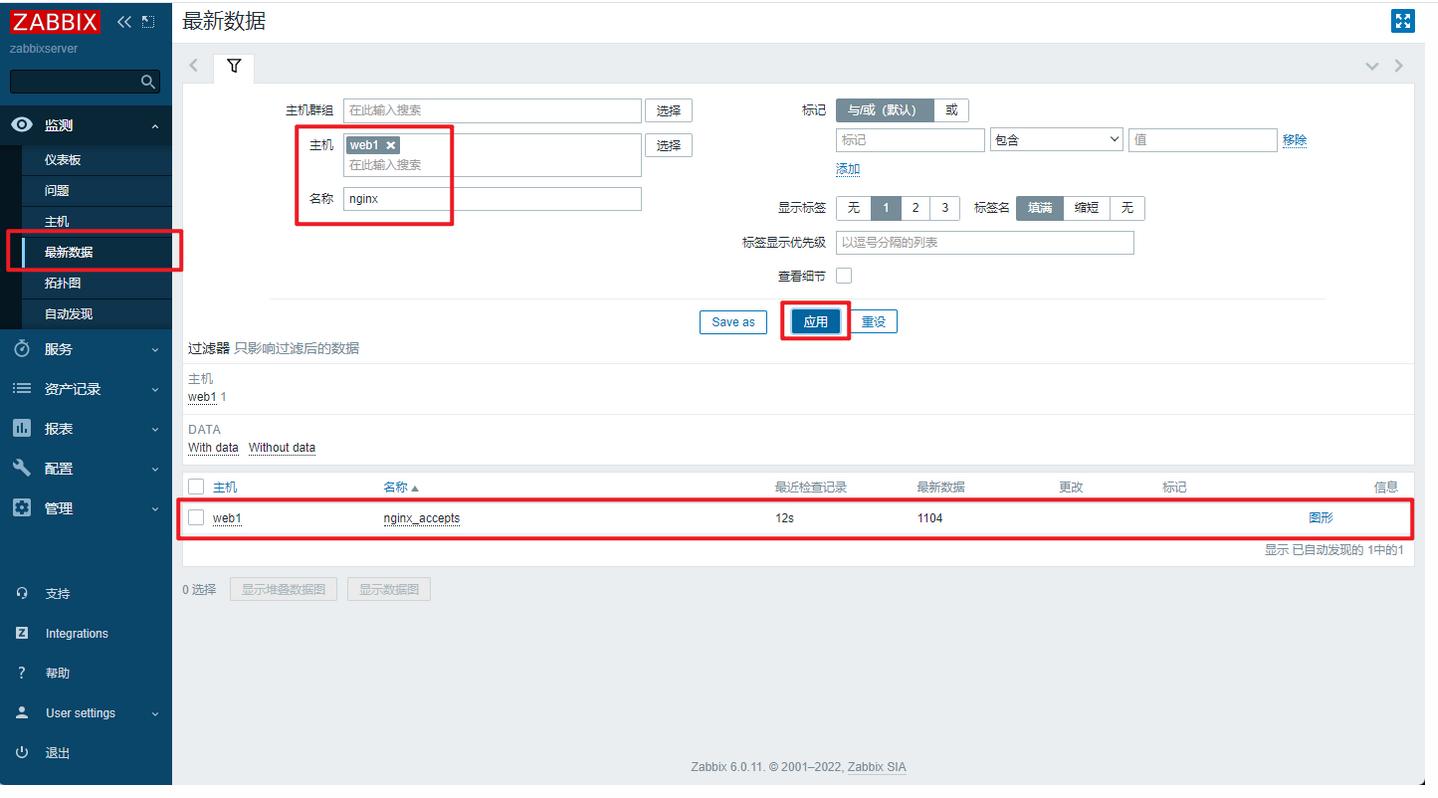
监测——最新数据——web1——nginx
执行测试的三条语句,等2秒钟就能看到数据了

有“AI”的1024 = 2048,欢迎大家加入2048 AI社区
更多推荐


 17
17 0
0- 0


 已为社区贡献8条内容

所有评论(0)