Qt3.9.1接入python显示热力球
原本应该直接使用qt的C++语言直接画热力球的,但是我遇到着色器使用失败的问题,在网上找相关问题也比较少,就决定直接用python写。直接修改python文件的路径就可以执行你的python代码,在main函数里面调用py_test()函数即可。代码也很简单,将json文件提取出来,然后差值,转化笛卡尔坐标,绘图,使用power,生成球面,归一上色。主要的配置python环境,如果你是用qmake
首先先说我想要实现的功能,我需要将三个坐标转化为一个球面(theta,phi,power),通过笛卡尔坐标转换将theta,phi作为坐标,power作为半径,实现一个热力球最终实现效果如下: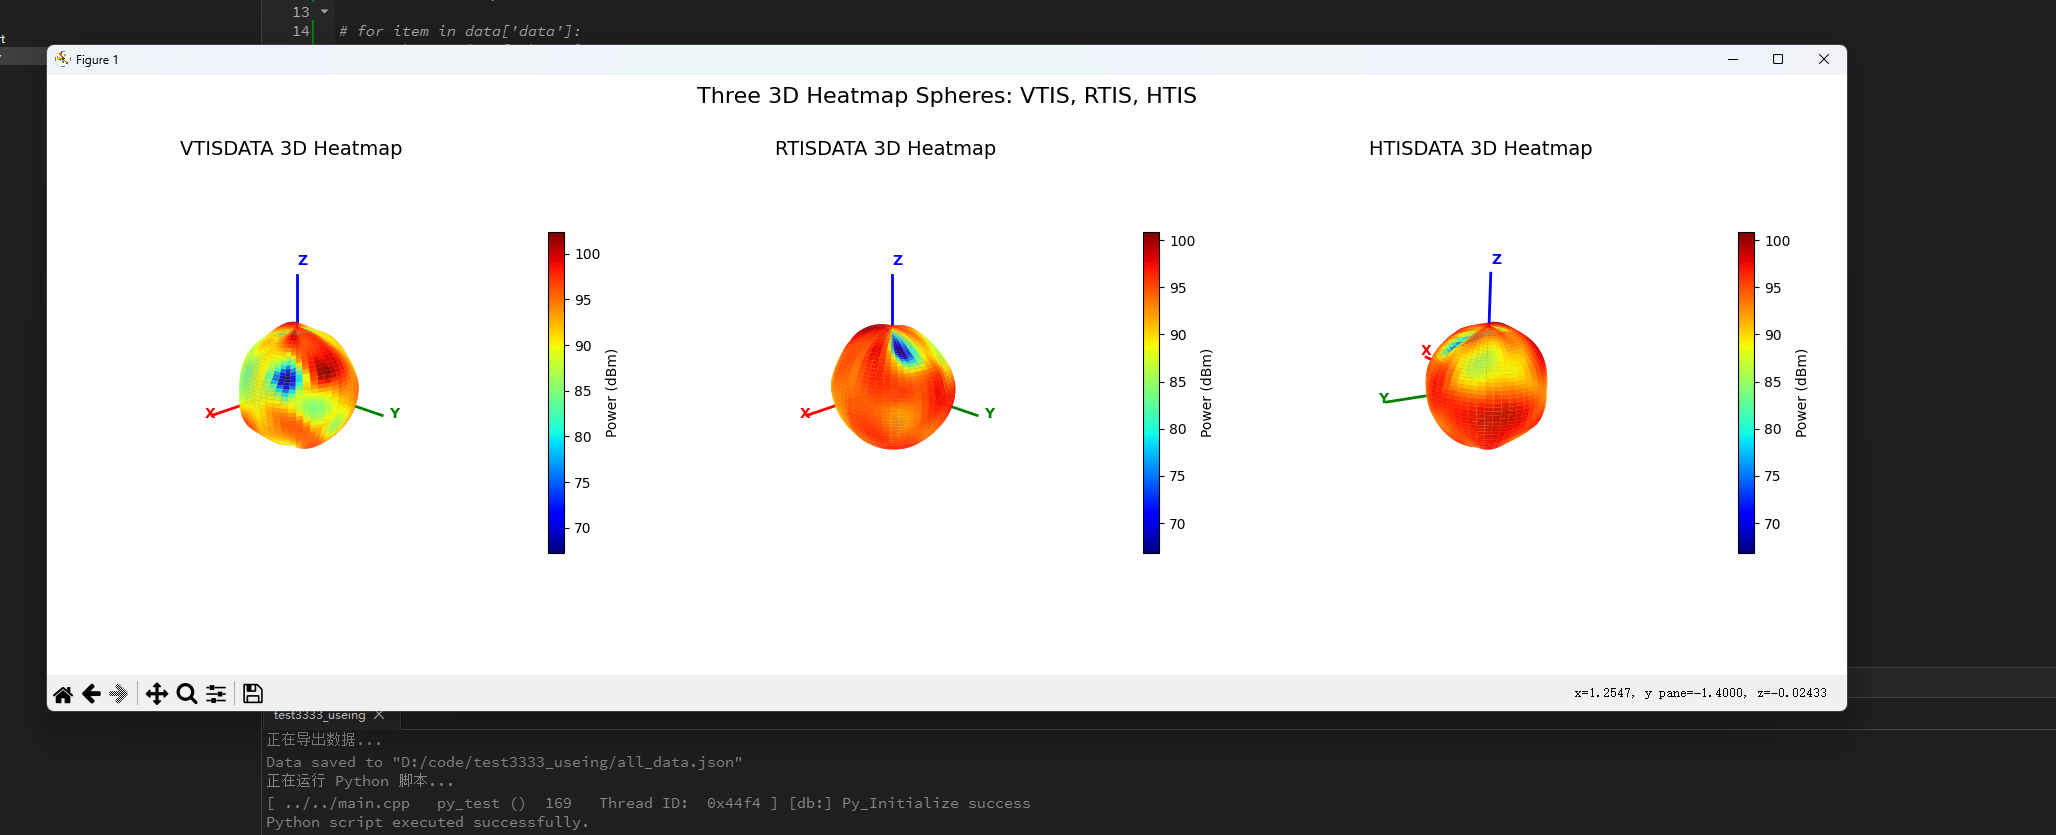
因为我有3组数据,需要实现3个3d热力球。原本应该直接使用qt的C++语言直接画热力球的,但是我遇到着色器使用失败的问题,在网上找相关问题也比较少,就决定直接用python写。
一.qt接入python的步骤
这一步我是参考了Qt/C++ 中调用 Python,并将软件打包发布、Python 含第三方依赖 - RioTian - 博客园
Qt调用Python详细过程_qt python-CSDN博客
python3.8以上,安装matplotlib,numpy, json, scipy文件
创建python File文件
主要的配置python环境,如果你是用qmake就是pro文件,你需要将python路径引入
LIBS += -LD:\study0\4.Programming_Tools\2.Python\2.python_3.11.4\libs -lpython311

INCLUDEPATH += D:\study0\4.Programming_Tools\2.Python\2.python_3.11.4\include
DEPENDPATH += D:\study0\4.Programming_Tools\2.Python\2.python_3.11.4\include
找到你python的安装路径,将他改为你的路径即可。
如果是cmake就是text文件应该
 设置 Python 路径(根据你的实际路径修改)
set(PYTHON_ROOT "D:/study0/4.Programming_Tools/2.Python/2.python_3.11.4")
set(PYTHON_INCLUDE_DIR "${PYTHON_ROOT}/include")
set(PYTHON_LIBRARY "${PYTHON_ROOT}/libs/python311.lib")

# 检查 Python 库是否存在
if(NOT EXISTS "${PYTHON_LIBRARY}")
    message(FATAL_ERROR "Python library not found: ${PYTHON_LIBRARY}\nMake sure Python is installed and path is correct.")
endif()

# 包含 Python 头文件
include_directories(${PYTHON_INCLUDE_DIR})
这样引入python路径注意是/。这样就将路径引好了。
然后需要将python库引入,在main函数里面需要引入库有以下
#include <QApplication>
#include <Python.h>
#include <QThread>
#include <QDebug>
#include <iostream>
#include <string>
#include <QJsonArray>
#include <QJsonObject>
#include <QFile>
#include <QJsonDocument>
#include <QtConcurrent>
#include <QVBoxLayout> // 用于布局
#include <QPushButton> // 用于按钮
#include <QDebug>      // 用于 qDebug()
不出意外会有两个常见的报错,一个是:
遇到<PyType_Slot *slots; object.h(445) : error C2059: 语法错误:“;”object.h(445) : error C2238: 意外的标记位于“;”之前>问题
解决方案:需要将slots改为slots1,原因是变量冲突。
还有一个是找不到dll。
解决方案:
将python文件夹下的python.dll文件复制到QT 项目编译出的 exe 文件同级目录下。
这样正常来说就不会有错误了。
接下来就是使用。
void py_test()
{ // 主函数中调用一下

    //设置 PYTHONHOME 环境变量(C++ 中设置)
    _putenv("PYTHONHOME=D:/study0/4.Programming_Tools/2.Python/2.python_3.11.4"); // Windows

    // 初始化python解释器.C/C++中调用Python之前必须先初始化解释器
    Py_Initialize();
    // 判断python解析器的是否已经初始化完成
    if (!Py_IsInitialized())
        dout << "[db:] Py_Initialize fail";
    else
        dout << "[db:] Py_Initialize success";

    // 执行 python 语句

    FILE* fp = fopen("D:/code/test3333_useing/test_3d.py", "r");
    if (!fp)
    {
        std::cerr << "Cannot open test.py!" << std::endl;
        Py_Finalize();
    }

    int result = PyRun_SimpleFile(fp, "test_3d.py");
    fclose(fp);
    if (result != 0)
    {
        std::cerr << "Error running Python script" << std::endl;
    }

    std::cout << "Python script executed successfully." << std::endl;

    // 并销毁自上次调用Py_Initialize()以来创建并为被销毁的所有子解释器。
    Py_Finalize();
}
直接修改python文件的路径就可以执行你的python代码,在main函数里面调用py_test()函数即可。
我贴出数据保存函数
struct DataPoint3D
{
    double theta; // 极角(仰角) 0°~180°
    double phi;   // 方位角     0°~360°
    double power; // 功率值(dBm)
};
void saveAllDataToJson(const QVector<DataPoint3D>& vtisData, const QVector<DataPoint3D>& rtisData,
    const QVector<DataPoint3D>& htisData, const QString& filename)
{
    auto toJsonArray = [](const QVector<DataPoint3D>& data) {
        QJsonArray arr;
        for (const auto& p : data)
        {
            QJsonObject obj;
            obj["theta"] = p.theta;
            obj["phi"] = p.phi;
            obj["power"] = p.power;
            arr.append(obj);
        }
        return arr;
    };

    QJsonObject root;
    root["vtisData"] = toJsonArray(vtisData);
    root["rtisData"] = toJsonArray(rtisData);
    root["htisData"] = toJsonArray(htisData);

    QJsonDocument doc(root);
    QFile file(filename);
    if (file.open(QIODevice::WriteOnly))
    {
        file.write(doc.toJson());
        file.close();
        qDebug() << "Data saved to" << filename;
    }
    else
    {
        qWarning() << "Cannot open file for writing:" << filename;
    }
}
我将数据写入json文件里面。然后是我的python显示文件
import matplotlib.pyplot as plt
import numpy as np
import json
from scipy.interpolate import griddata

# --- 1. 加载数据 ---
with open('D:/code/test3333_useing/all_data.json', 'r', encoding='utf-8') as f:
    data = json.load(f)


# 提取三组数据
datasets = {}
for key in ['vtisData', 'rtisData', 'htisData']:
    points = []
    values = []
    for item in data[key]:
        points.append([item['theta'], item['phi']])
        values.append(item['power'])
    datasets[key] = {
        'points': np.array(points),
        'values': np.array(values)
    }


# --- 3. 插值函数 ---
def interpolate_sphere(points, values, resolution=(50, 100)):
    theta_grid = np.linspace(0, 180, resolution[0])
    phi_grid = np.linspace(0, 360, resolution[1])
    theta_mesh, phi_mesh = np.meshgrid(theta_grid, phi_grid, indexing='ij')
    grid_points = np.column_stack((theta_mesh.ravel(), phi_mesh.ravel()))

    power_mesh = griddata(
        points=points,
        values=values,
        xi=grid_points,
        method='cubic',
        fill_value=np.mean(values)
    ).reshape(theta_mesh.shape)

    return theta_mesh, phi_mesh, power_mesh

# --- 4. 转换为笛卡尔坐标 ---
def spherical_to_cartesian(theta_mesh, phi_mesh, radius_mesh):
    theta_rad = np.radians(theta_mesh)
    phi_rad = np.radians(phi_mesh)
    x = radius_mesh * np.sin(theta_rad) * np.cos(phi_rad)
    y = radius_mesh * np.sin(theta_rad) * np.sin(phi_rad)
    z = radius_mesh * np.cos(theta_rad)
    return x, y, z

# --- 5. 绘图:三子图布局 ---
fig = plt.figure(figsize=(18, 6))

for idx, (name, dataset) in enumerate(datasets.items()):
    ax = fig.add_subplot(1, 3, idx + 1, projection='3d')

    # 插值 power
    theta_mesh, phi_mesh, power_mesh = interpolate_sphere(
        dataset['points'], dataset['values']
    )

    # 生成凹凸球面
    base_radius = 0.5
    height_scale = 0.005
    radius_mesh = base_radius + height_scale * (power_mesh - power_mesh.min())
    x, y, z = spherical_to_cartesian(theta_mesh, phi_mesh, radius_mesh)

    # 归一化并上色
    norm = plt.Normalize(vmin=power_mesh.min(), vmax=power_mesh.max())
    colors = plt.cm.jet(norm(power_mesh))

    # 绘制表面
    ax.plot_surface(x, y, z, facecolors=colors, alpha=0.9, shade=False, linewidth=0)

    # 添加颜色条
    mappable = plt.cm.ScalarMappable(cmap=plt.cm.jet, norm=norm)
    mappable.set_array(power_mesh)
    plt.colorbar(mappable, ax=ax, shrink=0.6, label="Power (dBm)")

    # 添加 XYZ 坐标轴
    axis_len = 1.2
    ax.plot([0, axis_len], [0, 0], [0, 0], color='red', lw=2)
    ax.plot([0, 0], [0, axis_len], [0, 0], color='green', lw=2)
    ax.plot([0, 0], [0, 0], [0, axis_len], color='blue', lw=2)
    ax.text(axis_len + 0.1, 0, 0, "X", color="red", fontsize=10, weight="bold")
    ax.text(0, axis_len + 0.1, 0, "Y", color="green", fontsize=10, weight="bold")
    ax.text(0, 0, axis_len + 0.1, "Z", color="blue", fontsize=10, weight="bold")

    # 设置
    ax.set_title(f"{name.upper()} 3D Heatmap", fontsize=14)
    ax.set_box_aspect([1, 1, 1])
    ax.set_xlim([-1.4, 1.4])
    ax.set_ylim([-1.4, 1.4])
    ax.set_zlim([-1.4, 1.4])
    ax.view_init(elev=20, azim=45)
    plt.axis('off')

plt.suptitle("Three 3D Heatmap Spheres: VTIS, RTIS, HTIS", fontsize=16)
plt.tight_layout()
plt.show()
代码也很简单,将json文件提取出来,然后差值,转化笛卡尔坐标,绘图,使用power,生成球面,归一上色。

有“AI”的1024 = 2048,欢迎大家加入2048 AI社区
更多推荐

 5
5 0
0- 0


 已为社区贡献2条内容

所有评论(0)