从前端框架到GIS开发系列课程(28)在地图框架mapbox中加载GeoJSON数据绘制点线面
此外,还需在Mapbox样式中加载字体资源,并通过paint设置文本的字体颜色、透明度等属性,最后调整text-offset确保文本位置正确。在OpenLayers中,通过创建点Feature并设置style来添加标记,如icon、image或text。3.使用layout属性中的text-field属性,可以读取properties中的文本字段并显示。2.点图层用于显示点要素,线图层用于显示线要
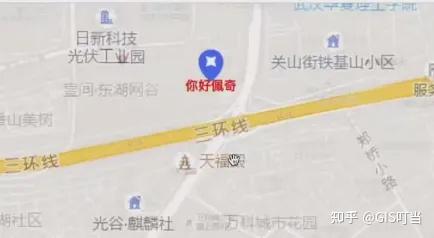
在mapbox中加载点线面数据
- 在OpenLayers中,可以通过创建Feature对象来绘制点、线和面。
- 通常通过加载GeoJSON数据来绘制点、线和面,因为GeoJSON对象中包含type属性,可以表达点线面的关系。
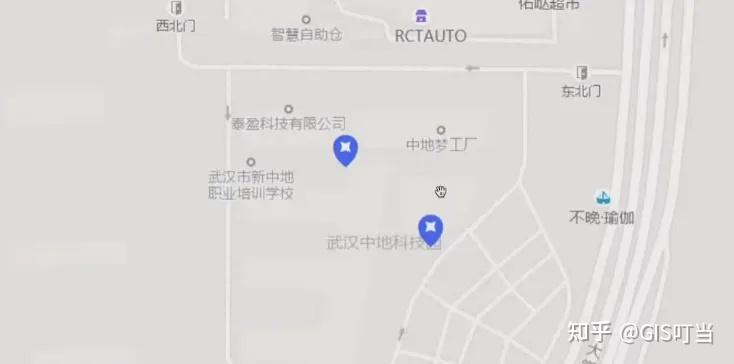
加载geojson数据绘制点
在OpenLayers中,通过创建点Feature并设置style来添加标记,如icon、image或text。
// 绘制点要素 在当前位置上标记一个点(geojson) 这个点上添加一个位置标记
const data = {
    type: "FeatureCollection",
    features: [
        {
            type: "Feature",
            properties: {},
            geometry: {
                type: "Point",
                coordinates: [114.406893, 30.464766],
            },
        },
        {
            type: "Feature",
            properties: {},
            geometry: {
                type: "Point",
                coordinates: [114.407306, 30.464432],
            },
        },
    ],
};
使用map.loadImage方法加载图标,并在图片加载完成后使用map.addImage将图标添加到地图实例中。
map.loadImage(
    "https://docs.mapbox.com/mapbox-gl-js/assets/custom_marker.png",
    (e, image) => {
        if (e) throw e;
        console.log(image);
        map.addImage("marker", image);
        map.addSource("points-source", {
            type: "geojson",
            data: data,
        });
    }
);
添加数据源和图层,将点数据和图标显示在地图上。
// 点要素的图层
map.addLayer({
    id: "points-layer",
    type: "symbol",
    source: "points-source",
    layout: {
        "icon-image": "marker",
    },
});
加载GeoJSON并添加文本
核心在于利用图层的layout属性设置样式,包括读取GeoJSON中properties的title字段以显示文本。
在layout中设置text-field属性时,需正确引用字段名,如"get('title')"。
此外,还需在Mapbox样式中加载字体资源,并通过paint设置文本的字体颜色、透明度等属性,最后调整text-offset确保文本位置正确。
图层layout属性
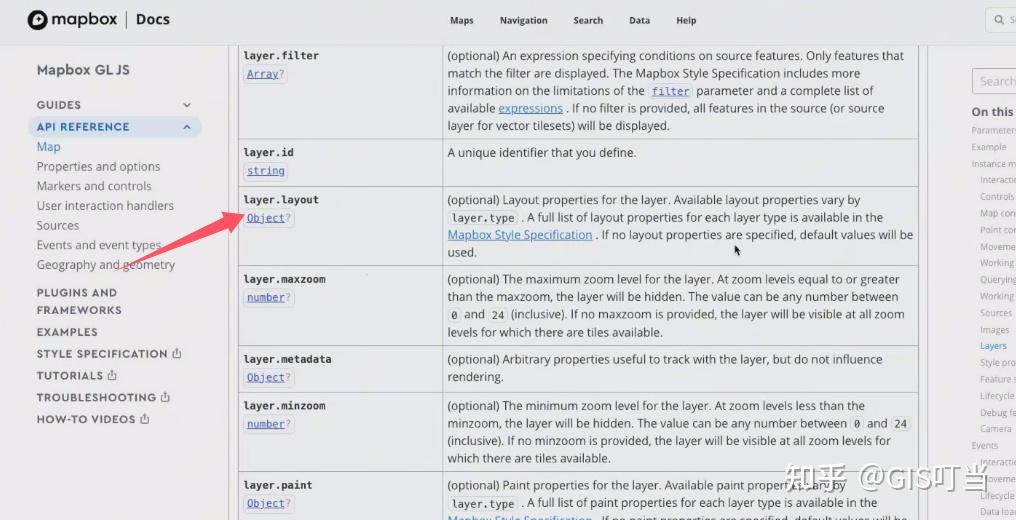
1.layout属性用于设置图层的样式,包括文本标注等。
2.layout属性根据layout time设置,用于设置样式。
3.可以在mybox style specification中查看具体的layout属性。
图层类型
1.图层类型包括点图层、线图层和面图层。
2.点图层用于显示点要素,线图层用于显示线要素,面图层用于显示面要素。
3.不同图层类型适用于不同类型的数据。
在点要素上添加文本
1.可以在点要素上添加文本标注,用于显示文本信息。
2.通过在GeoJSON数据中添加properties属性,可以存储文本信息。
3.使用layout属性中的text-field属性,可以读取properties中的文本字段并显示。
const data = {
    features: [
        {
            geometry: {
                coordinates: [114.407306, 30.464432],
            },
        },
    ],
};

map.loadImage(
    "https://docs.mapbox.com/mapbox-gl-js/assets/custom_marker.png",
    (e, image) => {
        if (e) throw e;
        console.log(image);
        map.addImage("marker", image);
        map.addSource("points-source", {
            type: "geojson",
            data: data,
        });
        // 点要素的图层
        map.addLayer({
            id: "points-layer",
            type: "symbol",
            source: "points-source",
            layout: {
                "icon-image": "marker",
                "text-field": ["get", "title"],
                "text-font": ["Open Sans Semibold", "Arial Unicode MS Bold"],
            },
        });
    }
);
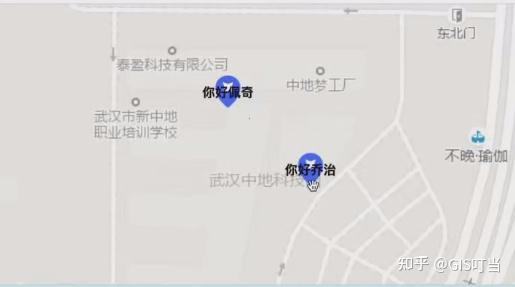
文本样式设置
1.使用text-offset属性,可以调整文本的偏移量。
'text-offset': [0, 1]
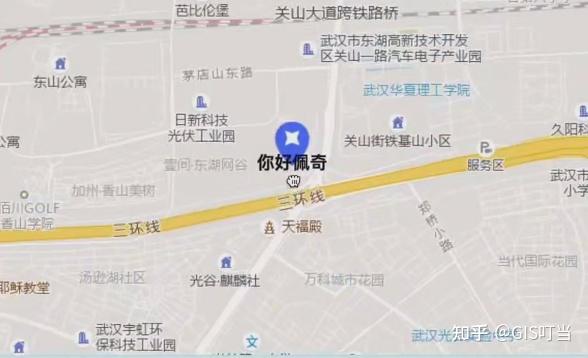
文本的字体、颜色、大小等样式
使用layout属性中的text-color属性,可以设置文本颜色。
// paint: {
    "text-color": "red",
// }
加载GeoJSON数据绘制线
过程包括:首先准备线数据,然后在Mapbox中添加数据源和图层,设置图层类型为线,并指定数据源和样式。
最后在地图加载完毕后添加图层,并可调整线的颜色和宽度等样式。这个过程需要遵循地图的style加载完毕的规则,确保在正确的时间进行数据源和图层的添加。
加载线数据
1.准备线数据:使用工具快速准备线数据,下载线数据并创建线数据文件。
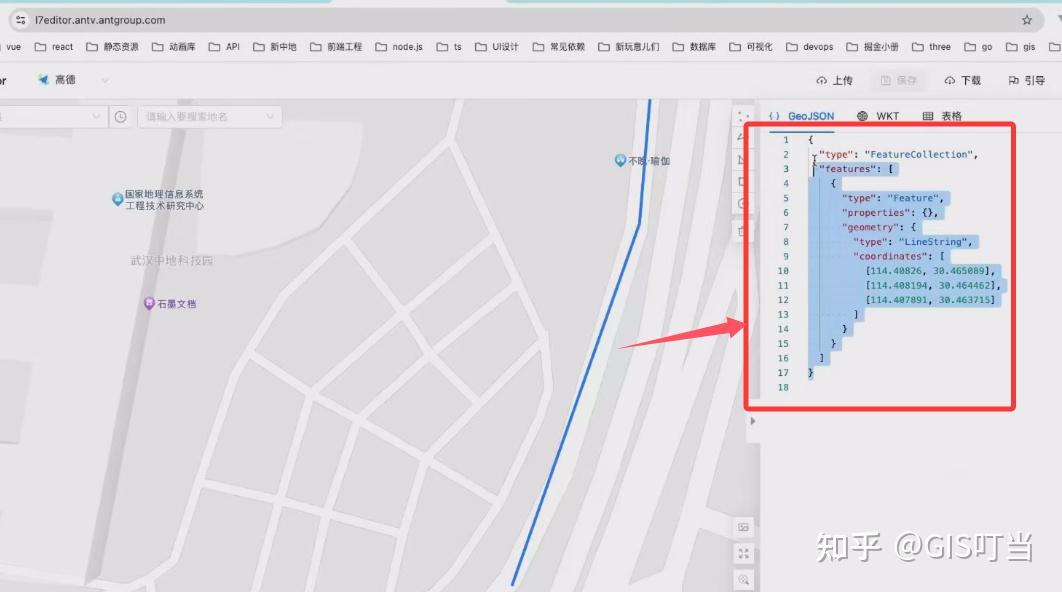
// 加载线数据
const LineData = {
    type: "FeatureCollection",
    features: [
        {
            type: "Feature",
            properties: {},
            geometry: {
                type: "LineString",
                coordinates: [
                    [114.40826, 30.465089],
                    [114.408194, 30.464462],
                    [114.407891, 30.463715],
                ],
            },
        },
    ],
};
添加数据源:
使用mapbox.addSource方法添加数据源,并设置数据源的名称和类型为GEOJSON。
map.on("load", function () {
    map.addSource("line-source", {
        type: "geojson",
        data: LineData,
    });
添加图层:
使用mapbox.addLayer方法添加图层,并设置图层的名称、类型和数据源。设置线样式:通过paint和layout属性设置线的颜色、宽度和端点样式。
    map.addLayer({
        id: "line-layer",
        type: "line",
        source: "line-source",
        paint: {
            "line-color": "blue",
            "line-width": 10,
        },
        layout: {
            "line-cap": "round",
        },
    });
});
geojson绘制面
L7网站上绘制一个多边形:
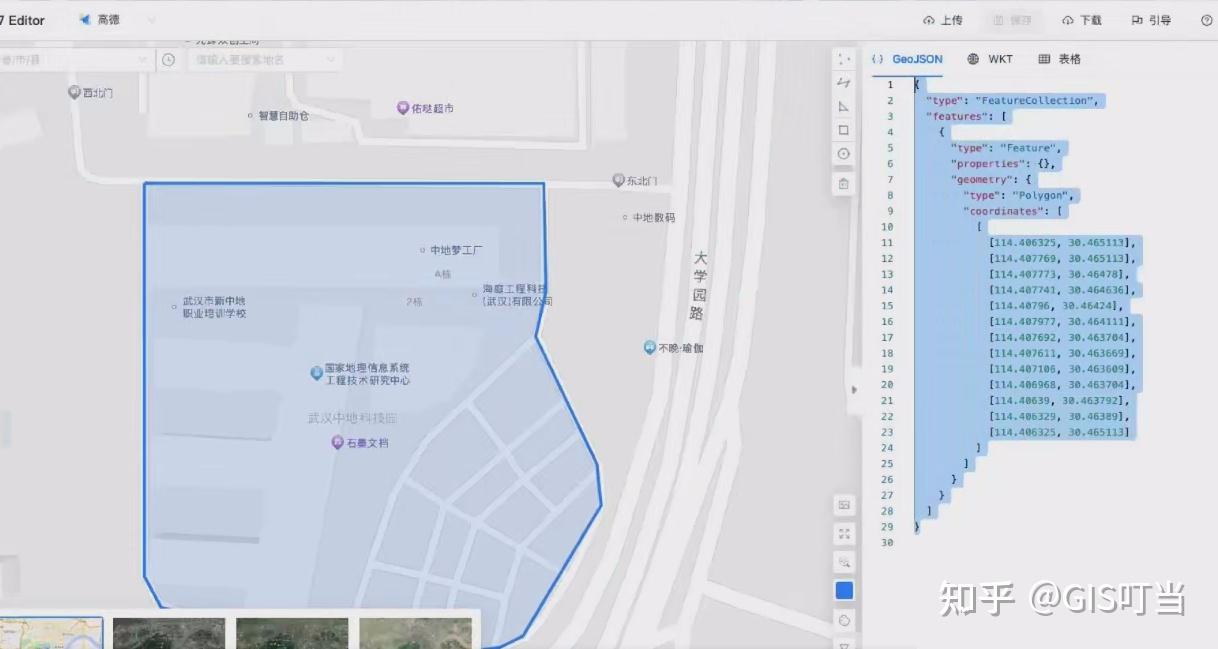
将代码复制到下面:
const polygonData = {
  type: "FeatureCollection",
  features: [
    {
      type: "Feature",
      properties: {},
      geometry: {
        type: "Polygon",
        coordinates: [
          [
            [114.406325, 30.465113],
            [114.407769, 30.465113],
            [114.407773, 30.464781],
            [114.407741, 30.464636],
            [114.40796, 30.464241],
            [114.407977, 30.464111],
            [114.407692, 30.463704],
            [114.407611, 30.463669],
            [114.407106, 30.463609],
            [114.406968, 30.463704],
            [114.40639, 30.463792],
            [114.406329, 30.46389],
            [114.406325, 30.465113],
          ],
        ],
      },
    },
  ],
};
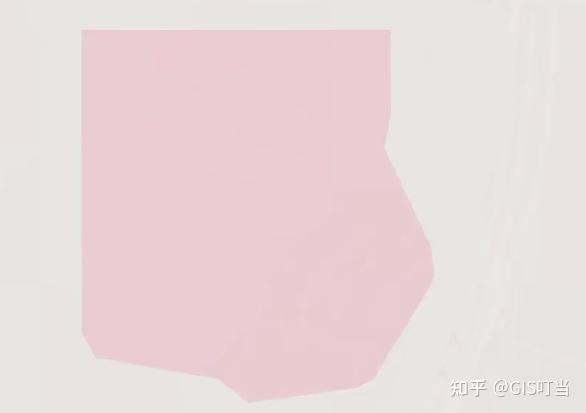
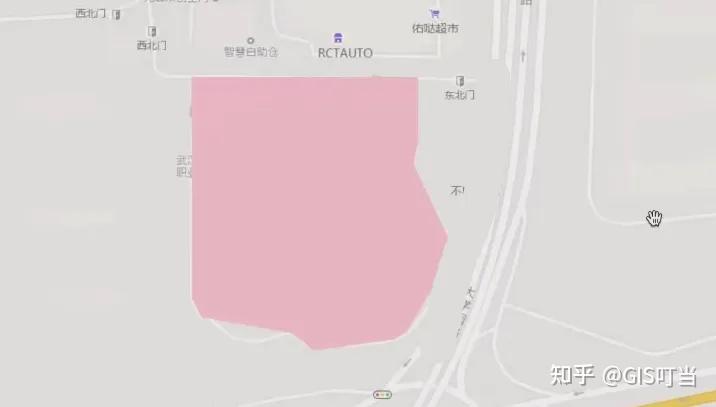
设置图层属性:
- 图层的类型是
"fill",表示这个图层用于填充多边形区域。 source属性设置为"polygon-source",即之前添加的数据源。paint属性定义了图层的样式:"fill-color": "pink"设置多边形的填充颜色为粉红色。"fill-opacity": 0.5设置多边形的填充透明度为 0.5(半透明)。
map.addSource("polygon-source", {
  type: "geojson",
  data: polygonData,
});

map.addLayer({
  id: "polygon-layer",
  type: "fill",
  source: "polygon-source",
  paint: {
    "fill-color": "pink",
    "fill-opacity": 0.5,
  },
});
最后出来的效果
地图点击事件:
我们在这里添加一个点击事件监听器,通过点击地图,实现将前面绘制的半透明多边形变为不透明。
map.on("click", function (e) {
  map.setPaintProperty("polygon-layer", "fill-opacity", 1);
});
若有收获,就点个赞吧!
持续更新webgis开发相关技术/面试/就业内容
关注我学习webgis开发不迷路👇👇👇

有“AI”的1024 = 2048,欢迎大家加入2048 AI社区
更多推荐

 34
34 0
0- 0


 已为社区贡献4条内容

所有评论(0)