红帽 AI 推理服务(vLLM)- 评估 LLM 模型性能
本文介绍了评估LLM模型性能的关键指标和测试方法。主要指标包括每秒请求数(RPS)、请求延迟、首次令牌生成时间(TTFT)、令牌间延迟(ITL)和每秒输出令牌数(TPOT)。文章详细说明了如何使用vLLM工具进行性能测试,包括下载Git仓库、安装依赖库和运行基准测试脚本,并展示了测试结果示例,包含吞吐量、延迟等多个维度的性能数据。这些指标和方法对于评估LLM推理服务的实际表现具有重要意义。
《教程汇总》
在开始本文之前请先完成《 红帽 AI 推理服务 (vLLM) - 入门篇》
评估 LLM 性能的重要指标
以下指标常用来评估 LLM 的性能: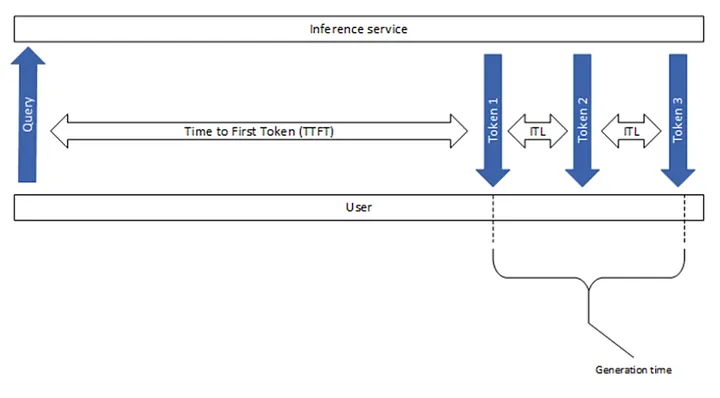
- 每秒请求数(RPS - Requests per second):每秒处理的请求数量。
用例:表示系统处理并发工作负载的能力。 - 请求延迟(Request latency):处理单个请求从开始到结束所花费的时间。
Latency =TTFT + Generation time
用例:是评估系统响应能力的关键指标。 - 首次令牌生成时间(TTFT - Time to first token):生成输出的首个令牌所花费的时间。
用例:表明模型的初始响应时间,这对于面向用户的应用至关重要。 - 令牌间延迟(ITL - Inter-token latency):在输出中生成连续令牌之间的平均时间,不包括首个令牌。
用例:有助于评估令牌生成的流畅性和速度。 - 每秒输出令牌数量(TPOT - Time per Output Token):所有请求的平均每秒生成的输出令牌数量,作为吞吐量指标。
TPOT = Generation time / Total output token
用例:有关服务器在生成输出令牌的性能和效率。
评估模型性能
先运行一个模型。
(myenv) $ vllm serve RedHatAI/Llama-3.2-1B-Instruct-FP8
使用性能测试脚本
vLLM 项目提供了评估测试 LLM 模型性能的脚本。
- 下载 Git Repo,并安装 Python 所需必要的资源。
(myenv) $ git clone https://github.com/vllm-project/vllm.git
(myenv) $ pip install vllm pandas datasets
- 运行模型性能评估脚本,之后可获得模型性能评估结果。
(myenv) $ python vllm/benchmarks/benchmark_serving.py --backend vllm --model RedHatAI/Llama-3.2-1B-Instruct-FP8 --num-prompts 100 --dataset-name random  --random-input 1024 --random-output 512 --port 8000
...
...
============ Serving Benchmark Result ============
Successful requests:                     100
Benchmark duration (s):                  14.47
Total input tokens:                      102300
Total generated tokens:                  40523
Request throughput (req/s):              6.91
Output token throughput (tok/s):         2800.79
Total Token throughput (tok/s):          9871.38
---------------Time to First Token----------------
Mean TTFT (ms):                          4203.60
Median TTFT (ms):                        4355.21
P99 TTFT (ms):                           5347.98
-----Time per Output Token (excl. 1st token)------
Mean TPOT (ms):                          16.16
Median TPOT (ms):                        18.67
P99 TPOT (ms):                           26.27
---------------Inter-token Latency----------------
Mean ITL (ms):                           21.02
Median ITL (ms):                         19.21
P99 ITL (ms):                            106.07
==================================================
使用 GuideLLM
GuideLLM 是一个开源工具包,用于通过模拟真实世界的流量来评估 LLM 的部署性能,并测量诸如吞吐量和延迟等关键指标。它支持关键的测试活动,如部署前的基准测试、回归测试和硬件评估,以确保 LLM 符合服务级别协议(SLO)。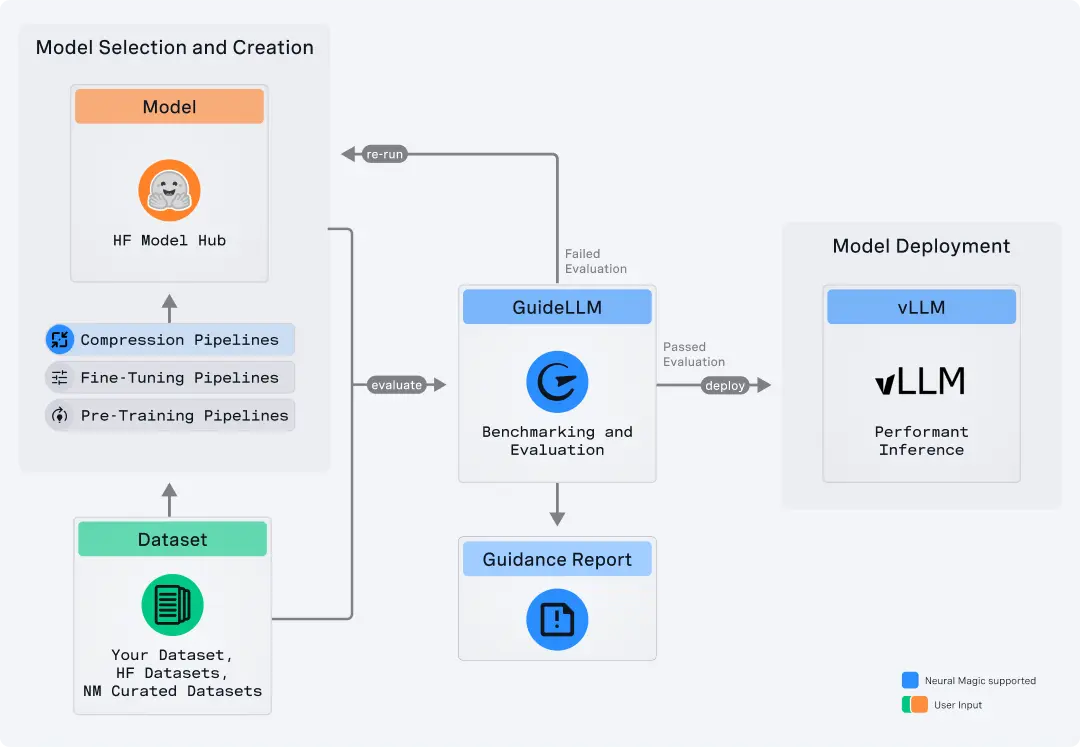
- 安装 GuideLLM。
(myenv) $ pip install guidellm
- 运行
(myenv) $ guidellm benchmark \
  --target "http://localhost:8000" \
  --rate-type sweep \
  --max-seconds 30 \
  --data "prompt_tokens=512,output_tokens=256"
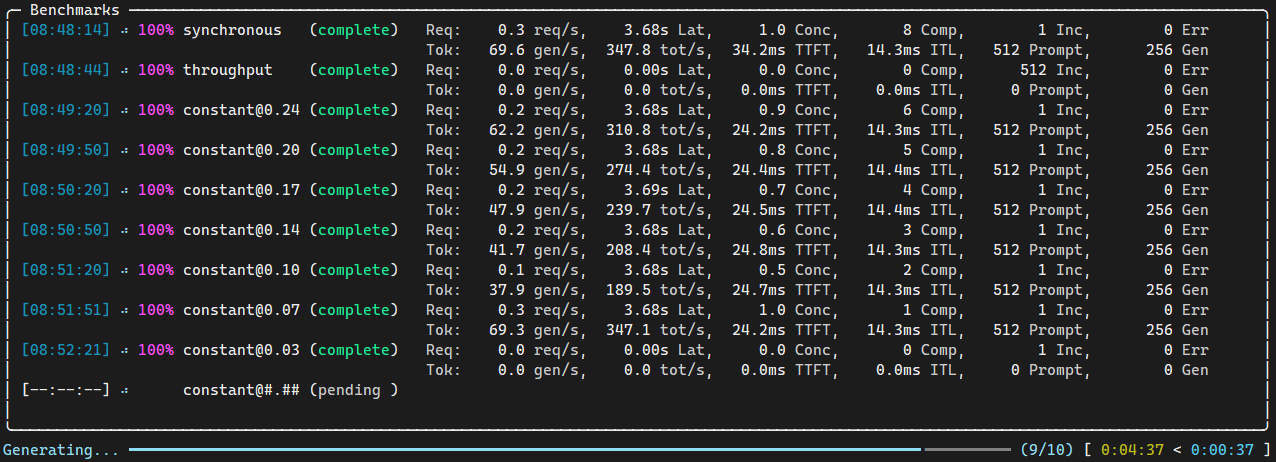
- 查看测试过程。
- 查看测试结果。
Benchmarks Metadata:
    Run id:611412cc-72c9-4c37-8335-0e1fe69d3939
    Duration:307.9 seconds
    Profile:type=sweep, strategies=['synchronous', 'throughput', 'constant', 'constant', 'constant', 'constant', 'constant', 'constant', 'constant', 'constant'], max_concurrency=None
    Args:max_number=None, max_duration=30.0, warmup_number=None, warmup_duration=None, cooldown_number=None, cooldown_duration=None
    Worker:type_='generative_requests_worker' backend_type='openai_http' backend_target='http://localhost:8000' backend_model='RedHatAI/Llama-3.2-1B-Instruct-FP8' backend_info={'max_output_tokens': 16384,
    'timeout': 300, 'http2': True, 'authorization': False, 'organization': None, 'project': None, 'text_completions_path': '/v1/completions', 'chat_completions_path': '/v1/chat/completions'}
    Request Loader:type_='generative_request_loader' data='prompt_tokens=512,output_tokens=256' data_args=None processor='RedHatAI/Llama-3.2-1B-Instruct-FP8' processor_args=None
    Extras:None


Benchmarks Info:
====================================================================================================================================================
Metadata                                      |||| Requests Made  ||| Prompt Tok/Req ||| Output Tok/Req ||| Prompt Tok Total||| Output Tok Total  ||
    Benchmark| Start Time| End Time| Duration (s)|  Comp|  Inc|  Err|  Comp|   Inc| Err|  Comp|   Inc| Err|  Comp|    Inc| Err|   Comp|    Inc|  Err
-------------|-----------|---------|-------------|------|-----|-----|------|------|----|------|------|----|------|-------|----|-------|-------|-----
  synchronous|   09:37:34| 09:38:04|         30.0|    14|    1|    0| 513.0| 512.0| 0.0| 256.0|  60.0| 0.0|  7182|    512|   0|   3584|     60|    0
   throughput|   09:38:04| 09:38:34|         30.3|   161|  510|    0| 513.1| 512.0| 0.0| 256.0| 188.0| 0.0| 82604| 261120|   0|  41216|  95895|    0
constant@1.09|   09:38:39| 09:39:09|         30.0|    31|    2|    0| 513.1| 512.0| 0.0| 256.0| 111.5| 0.0| 15905|   1024|   0|   7936|    223|    0
constant@1.70|   09:39:09| 09:39:39|         30.0|    47|    4|    0| 513.0| 512.0| 0.0| 256.0| 156.5| 0.0| 24113|   2048|   0|  12032|    626|    0
constant@2.31|   09:39:40| 09:40:10|         30.0|    65|    6|    0| 513.1| 512.0| 0.0| 256.0| 127.2| 0.0| 33349|   3072|   0|  16640|    763|    0
constant@2.92|   09:40:10| 09:40:40|         30.0|    82|    7|    0| 513.0| 512.0| 0.0| 256.0| 126.7| 0.0| 42068|   3584|   0|  20992|    887|    0
constant@3.53|   09:40:40| 09:41:10|         30.0|    99|    9|    0| 513.1| 512.0| 0.0| 256.0| 133.9| 0.0| 50793|   4608|   0|  25344|   1205|    0
constant@4.14|   09:41:11| 09:41:41|         30.0|   116|   12|    0| 513.1| 512.0| 0.0| 256.0| 127.3| 0.0| 59521|   6144|   0|  29696|   1528|    0
constant@4.76|   09:41:41| 09:42:11|         30.0|   132|   14|    0| 513.1| 512.0| 0.0| 256.0| 132.4| 0.0| 67728|   7168|   0|  33792|   1854|    0
constant@5.37|   09:42:11| 09:42:41|         30.0|   149|   17|    0| 513.0| 512.0| 0.0| 256.0| 137.8| 0.0| 76441|   8704|   0|  38144|   2342|    0
====================================================================================================================================================


Benchmarks Stats:
========================================================================================================================================================
Metadata     | Request Stats         || Out Tok/sec| Tot Tok/sec| Req Latency (ms)  ||| TTFT (ms)           ||| ITL (ms)         ||| TPOT (ms)        ||
    Benchmark| Per Second| Concurrency|        mean|        mean|  mean| median|   p99|   mean| median|    p99| mean| median|   p99| mean| median|   p99
-------------|-----------|------------|------------|------------|------|-------|------|-------|-------|-------|-----|-------|------|-----|-------|------
  synchronous|       0.47|        1.00|       121.5|       608.1|  2.11|   2.11|  2.11|   24.7|   24.8|   25.2|  8.2|    8.2|   8.2|  8.1|    8.1|   8.1
   throughput|       5.37|      141.45|      1374.0|      6876.5| 26.35|  26.40| 29.78| 1713.3| 1608.3| 3793.7| 96.4|   96.9| 101.9| 96.0|   96.5| 101.5
constant@1.09|       1.04|        2.35|       265.6|      1329.2|  2.26|   2.26|  2.27|   21.6|   21.6|   25.5|  8.8|    8.8|   8.8|  8.8|    8.8|   8.8
constant@1.70|       1.60|        3.72|       408.9|      2046.6|  2.33|   2.33|  2.34|   21.1|   21.0|   25.4|  8.9|    9.0|   9.1|  8.9|    9.0|   9.1
constant@2.31|       2.19|        5.25|       560.7|      2806.0|  2.40|   2.40|  2.41|   22.0|   21.6|   27.9|  9.3|    9.3|   9.4|  9.3|    9.3|   9.3
constant@2.92|       2.75|        6.82|       702.8|      3516.8|  2.48|   2.49|  2.52|   24.9|   23.9|   38.9|  9.6|    9.7|   9.8|  9.6|    9.6|   9.7
constant@3.53|       3.32|        8.85|       849.0|      4248.8|  2.67|   2.68|  2.69|   33.0|   33.4|   38.6| 10.3|   10.4|  10.4| 10.3|   10.3|  10.3
constant@4.14|       3.89|       10.77|       996.3|      4986.3|  2.77|   2.77|  2.80|   34.8|   34.3|   71.1| 10.7|   10.7|  10.8| 10.6|   10.7|  10.8
constant@4.76|       4.43|       12.84|      1133.8|      5674.2|  2.90|   2.90|  2.93|   35.4|   34.8|   75.3| 11.2|   11.3|  11.3| 11.2|   11.2|  11.3
constant@5.37|       4.98|       15.34|      1275.0|      6380.4|  3.08|   3.09|  3.11|   37.3|   35.9|   90.7| 11.9|   12.0|  12.0| 11.9|   11.9|  12.0
========================================================================================================================================================

Saving benchmarks report...
Benchmarks report saved to /root/benchmarks.json

Benchmarking complete.
- 根据以上 Benchmark 结果可评估用户要性能需要何种硬件。例如:如果用户要求 p99 的 TTFT 指标低于 80ms,那么 Benchmark 测试硬件可以支持的 RPS 为4.43。这样如果用户希望 RPS 能够达到 50,则需要大概 12 个当前的硬件服务器。
参考
https://developers.redhat.com/articles/2025/06/20/guidellm-evaluate-llm-deployments-real-world-inference
https://docs.redhat.com/en/documentation/red_hat_ai_inference_server/3.2/html-single/getting_started/index#validating-benefits-with-key-metrics_getting-started
https://medium.com/@kimdoil1211/benchmarking-llm-serving-performance-a-comprehensive-guide-db94b1bfe8cf
https://github.com/vllm-project/guidellm/blob/main/docs/metrics.md
https://github.com/vllm-project/guidellm/blob/main/docs/service_level_objectives.md
https://developers.redhat.com/articles/2025/08/18/optimizing-generative-ai-models-quantization

有“AI”的1024 = 2048,欢迎大家加入2048 AI社区
更多推荐


 12
12 0
0- 0


 已为社区贡献11条内容

所有评论(0)