机器学习(2)鸢尾花三种聚类算法(K-means,AGNES,DBScan)
鸢尾花三种聚类算法(K-means,AGNES,DBScan)的python实现:结果效果比较明显:同一鸢尾花数据集测试结果如图所示,可以看出K-means的聚类效果最好。k-means对于大型数据集也是简单高效、时间复杂度、空间复杂度低。 最重要是数据集大时结果容易局部最优;需要预先设定K值,对最先的K个点选取很敏感;对噪声和离群值非常敏感;只用于numerical类型数据;不能解决非凸数...
·
鸢尾花三种聚类算法(K-means,AGNES,DBScan)的python实现: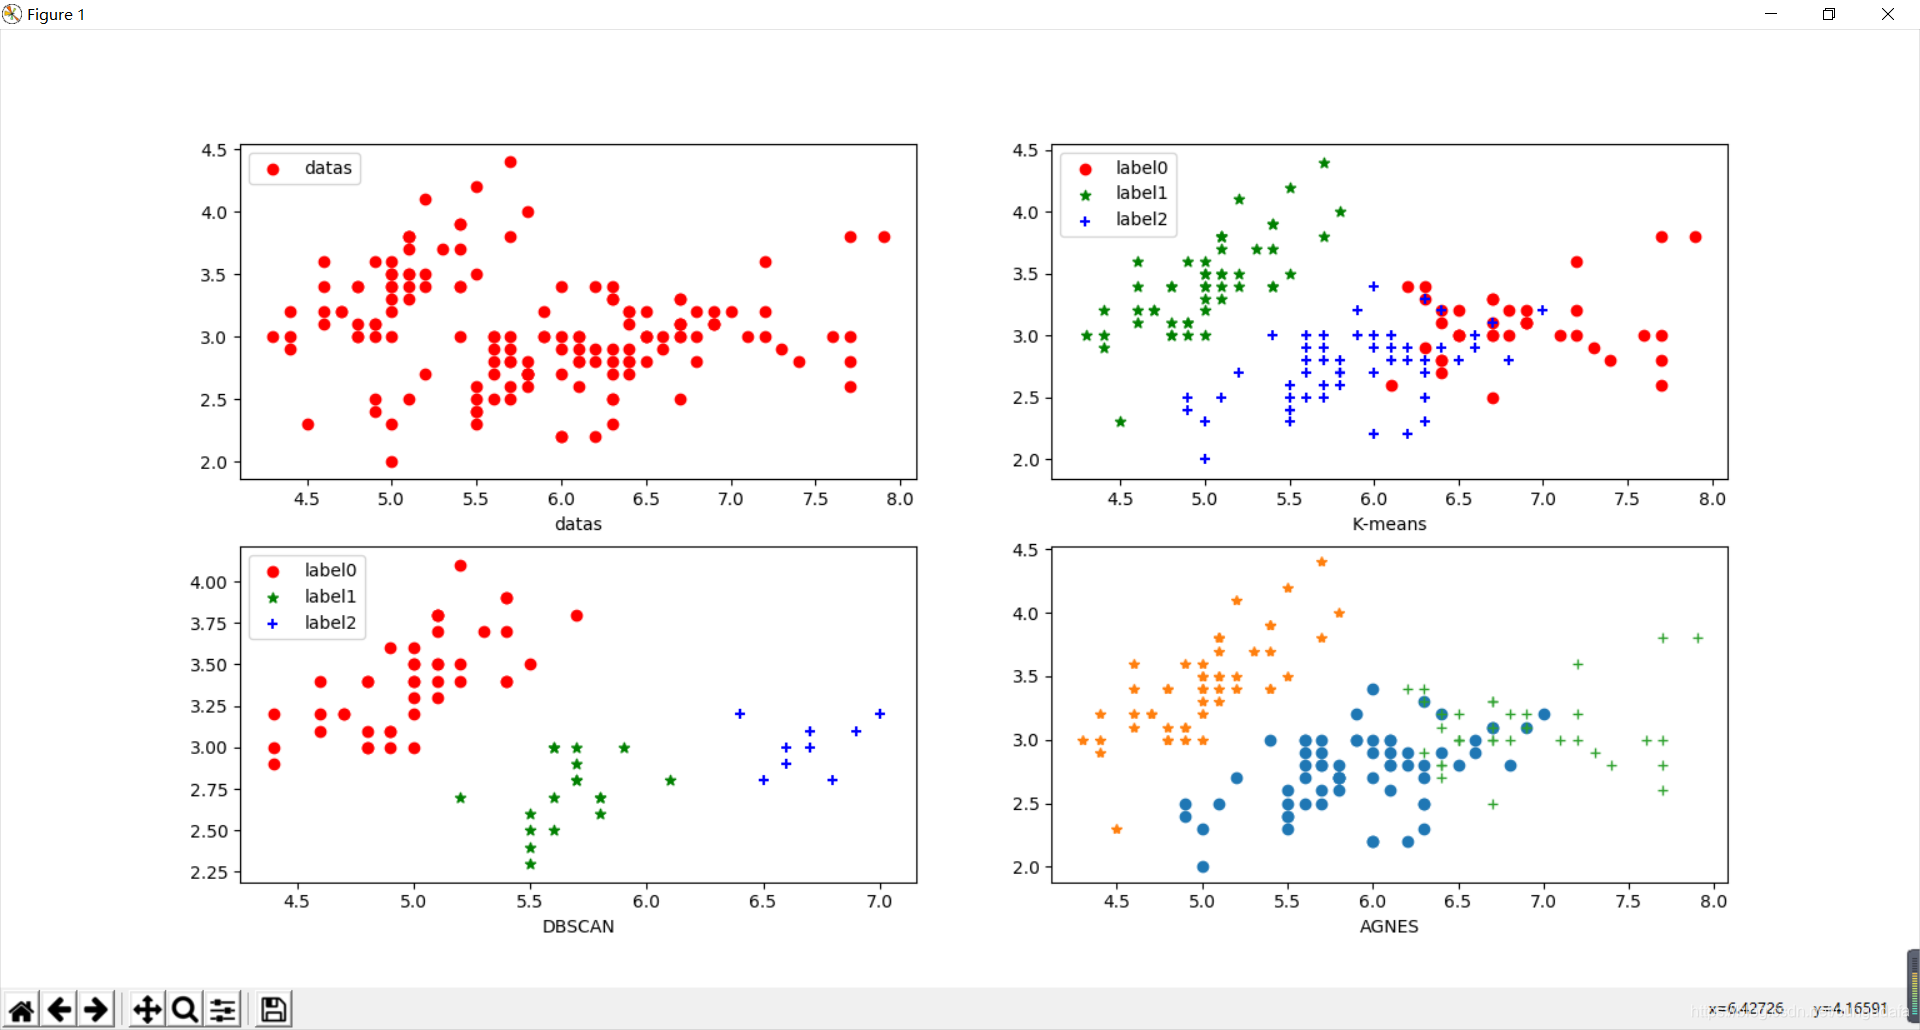
结果效果比较明显:同一鸢尾花数据集测试结果如图所示,可以看出K-means的聚类效果最好。
k-means对于大型数据集也是简单高效、时间复杂度、空间复杂度低。 最重要是数据集大时结果容易局部最优;需要预先设定K值,对最先的K个点选取很敏感;对噪声和离群值非常敏感;只用于numerical类型数据;不能解决非凸数据。(AGNES聚类效果和Kmeans聚类效果差不多,但是调用函数相对麻烦一点)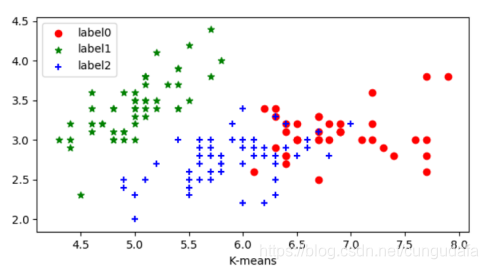
DBSCAN对噪声不敏感;能发现任意形状的聚类。 但是聚类的结果与参数有很大的关系;DBSCAN用固定参数识别聚类,但当聚类的稀疏程度不同时,相同的判定标准可能会破坏聚类的自然结构,即较稀的聚类会被划分为多个类或密度较大且离得较近的类会被合并成一个聚类。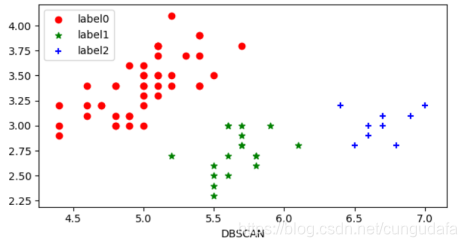
#!/usr/bin/env python3
# -*- coding:utf-8 -*-
import matplotlib.pyplot as plt
import numpy as np
from sklearn.cluster import KMeans
from sklearn import datasets

iris = datasets.load_iris()
X = iris.data[:, :4]  # #表示我们取特征空间中的4个维度
print(X.shape)

# 绘制数据分布图
plt.figure()
plt.subplot(2, 2, 1)
plt.scatter(X[:, 0], X[:, 1], c="red", marker='o', label='datas')
plt.xlabel('datas')
plt.legend(loc=2)
# K-means
print("===K-means聚类===")
estimator = KMeans(n_clusters=3)  # 构造聚类器
estimator.fit(X)  # 聚类
label_pred = estimator.labels_  # 获取聚类标签
# 绘制k-means结果
plt.subplot(2, 2, 2)
x0 = X[label_pred == 0]
x1 = X[label_pred == 1]
x2 = X[label_pred == 2]
plt.scatter(x0[:, 0], x0[:, 1], c="red", marker='o', label='label0')
plt.scatter(x1[:, 0], x1[:, 1], c="green", marker='*', label='label1')
plt.scatter(x2[:, 0], x2[:, 1], c="blue", marker='+', label='label2')
plt.xlabel('K-means')
plt.legend(loc=2)

# 密度聚类之DBSCAN算法
print("===DBSCAN聚类===")
from sklearn.cluster import DBSCAN
dbscan = DBSCAN(eps=0.4, min_samples=9)
dbscan.fit(X)
label_pred = dbscan.labels_
plt.subplot(2, 2, 3)
x0 = X[label_pred == 0]
x1 = X[label_pred == 1]
x2 = X[label_pred == 2]
plt.scatter(x0[:, 0], x0[:, 1], c="red", marker='o', label='label0')
plt.scatter(x1[:, 0], x1[:, 1], c="green", marker='*', label='label1')
plt.scatter(x2[:, 0], x2[:, 1], c="blue", marker='+', label='label2')
plt.xlabel('DBSCAN')
plt.legend(loc=2)

# 结构性聚类(层次聚类)
print("===层次聚类===")
from sklearn.cluster import AgglomerativeClustering
import pandas as pd
from sklearn.metrics import confusion_matrix

iris = datasets.load_iris()
irisdata = iris.data
clustering = AgglomerativeClustering(linkage='ward', n_clusters=3)
res = clustering.fit(irisdata)

print("各个簇的样本数目:")
print(pd.Series(clustering.labels_).value_counts())
print("聚类结果:")
print(confusion_matrix(iris.target, clustering.labels_))

plt.subplot(2, 2, 4)
d0 = irisdata[clustering.labels_ == 0]
plt.plot(d0[:, 0], d0[:, 1], 'o')
d1 = irisdata[clustering.labels_ == 1]
plt.plot(d1[:, 0], d1[:, 1], '*')
d2 = irisdata[clustering.labels_ == 2]
plt.plot(d2[:, 0], d2[:, 1], '+')
plt.xlabel("AGNES")
plt.show()
附:
鸢尾花三种聚类算法(K-means,AGNES,DBScan)的python实现
转载原文链接:https://blog.csdn.net/weixin_42134141/article/details/80413598

有“AI”的1024 = 2048,欢迎大家加入2048 AI社区
更多推荐

 12
12 0
0- 0


 已为社区贡献15条内容

所有评论(0)