实验一 逻辑回归
一、实验目的
(1)学习并掌握常见的机器学习方法;
(2)能够结合所学的python知识实现机器学习算法;
(3)能够用所学的机器学习算法解决实际问题。
二、实验内容与要求
(1)掌握线性回归及逻辑回归的原理;
(2)根据所提供的代码,完成基本的逻辑回归;
(3)能够正确输出结果。
三、实验过程及代码
(1)数据导入及预处理
|
import numpy as np import matplotlib.pyplot as plt import h5py from lr_utils import load_dataset print(train_set_x_orig.shape) print(train_set_y.shape) print(classes.shape) print(classes[0],classes[1]) |
结果:(209, 64, 64, 3) (1, 209) (2,) b'non-cat' b'cat'
(2)显示图片
|
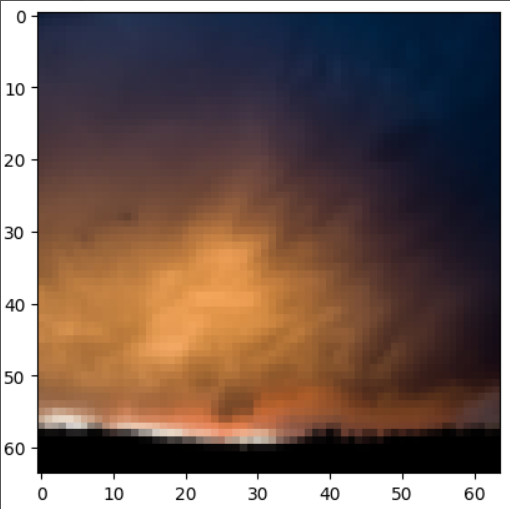
%matplotlib inline plt.imshow(train_set_x_orig[0]) print(train_set_y[0][0]) |
|
plt.imshow(train_set_x_orig[2]) print(train_set_y[0][2]) |

|
print(train_set_y) |
结果:
|
[[0 0 1 0 0 0 0 1 0 0 0 1 0 1 1 0 0 0 0 1 0 0 0 0 1 1 0 1 0 1 0 0 0 0 0 0 0 0 1 0 0 1 1 0 0 0 0 1 0 0 1 0 0 0 1 0 1 1 0 1 1 1 0 0 0 0 0 0 1 0 0 1 0 0 0 0 0 0 0 0 0 0 0 1 1 0 0 0 1 0 0 0 1 1 1 0 0 1 0 0 0 0 1 0 1 0 1 1 1 1 1 1 0 0 0 0 0 1 0 0 0 1 0 0 1 0 1 0 1 1 0 0 0 1 1 1 1 1 0 0 0 0 1 0 1 1 1 0 1 1 0 0 0 1 0 0 1 0 0 0 0 0 1 0 1 0 1 0 0 1 1 1 0 0 1 1 0 1 0 1 0 0 0 0 0 1 0 0 1 0 0 0 1 0 0 0 0 1 0 0 1 0 0 0 0 0 0 0 0]] |
(3)进行图像判断
|
index = 2 print("y=" + str(train_set_y[:,index]) + ", it's a " + classes[np.squeeze(train_set_y)[index]].decode("utf-8") + "' picture") |
结果:y=[1], it's a cat' picture
(4)将训练集的维度降低并转置。
|
train_set_x_flatten = train_set_x_orig.reshape(train_set_x_orig.shape[0],-1).T print(train_set_x_flatten.shape) print(train_set_y.shape) test_set_x_flatten = test_set_x_orig.reshape(test_set_x_orig.shape[0], -1).T print(test_set_x_flatten.shape) print(test_set_y.shape) |
结果:(12288, 209) (1, 209) (12288, 50) (1, 50)
(5)预处理
预处理步骤是对数据集进行居中和标准化,这意味着可以减去每个示例中整个umpy数组的平均值,然后将每个示例除以整个numpy数组的标准偏差。
|
train_set_x = train_set_x_flatten / 255 test_set_x = test_set_x_flatten / 255 |
(6)构建模型
|
def sigmoid(z): s = 1 / (1 + np.exp(-z)) return s sigmoid(0) def initialize_with_zeros(dim): #Please Add Something w = np.zeros((dim,1)) b = 0 return w, b def propagate(w, b, X, Y): #Please Add Something m = X.shape[1] A = sigmoid(np.dot(w.T, X) + b) first = -Y * np.log(A) second = (1 - Y) * np.log(1 - A) cost = np.sum(first - second) / m dw = (1 / m) * np.dot(X, (A - Y).T) db = (1 / m) * np.sum(A - Y) cost = np.squeeze(cost) grads = { "dw": dw, 'db': db } return grads ,cost def optimize(w , b , X , Y , num_iterations , learning_rate , print_cost = False): #Please Add Something costs = [] for i in range(num_iterations): grads, cost = propagate(w, b, X, Y) dw = grads['dw'] db = grads['db'] w = w - learning_rate * dw b = b - learning_rate * db if (i % 100 == 0): costs.append(cost) if (print_cost & (i % 100 == 0)): print('迭代次数:%i 误差值%f' % (i, cost)) params = { 'w': w, 'b': b } grads = { 'dw': dw, 'db': db } return params, grads, costs def predict(w , b , X ): m = X.shape[1] #图片的数量 Y_prediction = np.zeros((1,m)) w = w.reshape(X.shape[0],1) #计预测猫在图片中出现的概率 A = sigmoid(np.dot(w.T , X) + b) for i in range(A.shape[1]): #将概率a [0,i]转换为实际预测p [0,i] Y_prediction[0,i] = 1 if A[0,i] > 0.5 else 0 #使用断言 assert(Y_prediction.shape == (1,m)) return Y_prediction def model(X_train, Y_train, X_test, Y_test, num_iterations = 2000 , learning_rate = 0.5 , print_cost = False): #Please Add Something w, b = initialize_with_zeros(X_train.shape[0]) parameters, grads, costs = optimize(w, b, X_train, Y_train, num_iterations, learning_rate, print_cost) # 从字典“参数”中检索参数w和b w, b = parameters["w"], parameters["b"] # 预测测试/训练集的例子 Y_prediction_test = predict(w, b, X_test) Y_prediction_train = predict(w, b, X_train) # 打印训练后的准确性 print("训练集准确性:", format(100 - np.mean(np.abs(Y_prediction_train - Y_train)) * 100), "%") print("测试集准确性:", format(100 - np.mean(np.abs(Y_prediction_test - Y_test)) * 100), "%") d = { "costs" : costs, "Y_prediction_test" : Y_prediction_test, "Y_prediciton_train" : Y_prediction_train, "w" : w, "b" : b, "learning_rate" : learning_rate, "num_iterations" : num_iterations } return d print("====================测试model====================") #这里加载的是真实的数据,请参见上面的代码部分。 d = model(train_set_x, train_set_y, test_set_x, test_set_y, num_iterations = 2000, learning_rate = 0.005, print_cost = True) |
结果:====================测试model==================== 迭代次数:0 误差值0.693147 迭代次数:100 误差值0.584508 迭代次数:200 误差值0.466949 迭代次数:300 误差值0.376007 迭代次数:400 误差值0.331463 迭代次数:500 误差值0.303273 迭代次数:600 误差值0.279880 迭代次数:700 误差值0.260042 迭代次数:800 误差值0.242941 迭代次数:900 误差值0.228004 迭代次数:1000 误差值0.214820 迭代次数:1100 误差值0.203078 迭代次数:1200 误差值0.192544 迭代次数:1300 误差值0.183033 迭代次数:1400 误差值0.174399 迭代次数:1500 误差值0.166521 迭代次数:1600 误差值0.159305 迭代次数:1700 误差值0.152667 迭代次数:1800 误差值0.146542 迭代次数:1900 误差值0.140872 训练集准确性: 99.04306220095694 % 测试集准确性: 70.0 %
(7)绘制图
|
costs = np.squeeze(d['costs']) plt.plot(costs) plt.ylabel('cost') plt.xlabel('iterations (per hundreds)') plt.title("Learning rate =" + str(d["learning_rate"])) plt.show() |
结果:

四、实验分析及总结
逻辑回归也称作logistic回归分析,是一种广义的线性回归分析模型,属于机器学习中的监督学习。其推导过程与计算方式类似于回归的过程,但实际上主要是用来解决二分类问题(也可以解决多分类问题)。通过给定的n组数据(训练集)来训练模型,并在训练结束后对给定的一组或多组数据(测试集)进行分类。其中每一组数据都是由p 个指标构成。
经过这次的实验初步掌握了逻辑回归算法的使用,使用逻辑回归来解决具体问题,为之后的学习打下了基础。

有“AI”的1024 = 2048,欢迎大家加入2048 AI社区
更多推荐

 0
0 0
0- 0


 已为社区贡献12条内容

所有评论(0)