Python+Opencv2(二)图像的轮廓特征
文章目录一、前言二、Opencv提取图像轮廓1.提取轮廓2.轮廓特征3.凸包轮廓4.直方图5.重心6.傅里叶描述子三、完整代码一、前言博主的毕业设计:图像识别手语相关,这里用到了大量opencv关于图像的处理函数,记录一下。本文是图像轮廓的常用函数。手势本身具有丰富的形变,运动以及纹理特征,选取合理的特征对于手势的识别至关重要。目前 常用的手势特征有:轮廓、边缘、图像矩、图像特征向量以及区...
·
一、前言
博主的毕业设计:图像识别手语相关,这里用到了大量opencv关于图像的处理函数,记录一下。本文是图像轮廓的常用函数。
手势本身具有丰富的形变,运动以及纹理特征,选取合理的特征对于手势的识别至关重要。目前 常用的手势特征有:
轮廓、边缘、图像矩、图像特征向量以及区域直方图特征等等。
而opencv又满足了我大部分的需求。
二、Opencv提取图像轮廓
1.提取轮廓
contours是轮廓参数
import cv2
import numpy as np
import matplotlib.pyplot as plt

path="images/hand/hand.png"
img = cv2.imread(path)
gray = cv2.cvtColor(img, cv2.COLOR_BGR2GRAY)
ret,binary = cv2.threshold(gray, 127, 255, cv2.THRESH_BINARY)

contours, hierarchy = cv2.findContours(binary, cv2.RETR_TREE, cv2.CHAIN_APPROX_SIMPLE)

cv2.drawContours(gray,contours,-1,(255,255,0),3) #绘制白色轮廓


plt.figure(figsize=(10,10))
plt.subplot(1,2,1)
plt.imshow(cv2.cvtColor(img, cv2.COLOR_BGR2RGB))#BGR转RGB
plt.xlabel(u'hand.png')
plt.subplot(1,2,2)
plt.imshow(cv2.cvtColor(gray, cv2.COLOR_BGR2RGB))
plt.xlabel(u'ret.png')
plt.show()
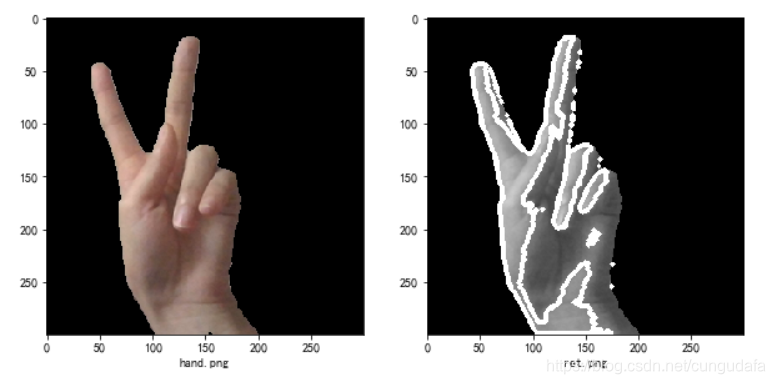
这里效果太差了,采取 肤色检测方法 进行处理,这里不扩展。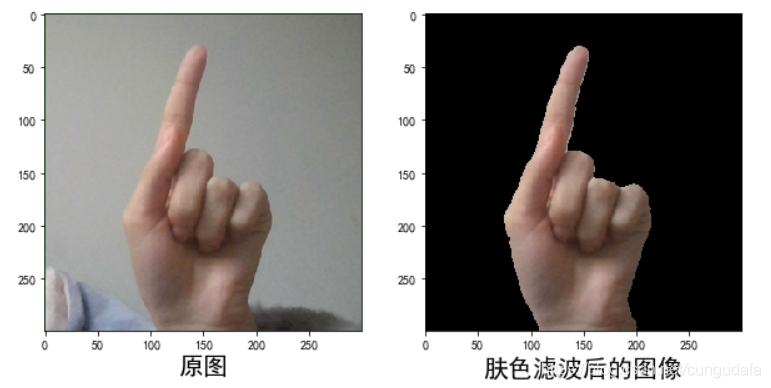
部分代码片段:
def skinMask(roi):
    """YCrCb颜色空间的Cr分量+Otsu法阈值分割算法

    :param res: 输入原图像
    :return: 肤色滤波后图像
    """
    YCrCb = cv2.cvtColor(roi, cv2.COLOR_BGR2YCR_CB) #转换至YCrCb空间
    (y,cr,cb) = cv2.split(YCrCb) #拆分出Y,Cr,Cb值
    cr1 = cv2.GaussianBlur(cr, (5,5), 0)
    _, skin = cv2.threshold(cr1, 0, 255, cv2.THRESH_BINARY + cv2.THRESH_OTSU) #Ostu处理
    res = cv2.bitwise_and(roi,roi, mask = skin)
    plt.figure(figsize=(10,10))
    plt.subplot(1,2,1)
    plt.imshow(cv2.cvtColor(roi, cv2.COLOR_BGR2RGB))
    plt.xlabel(u'原图',fontsize=20)
    plt.subplot(1,2,2)
    plt.imshow(cv2.cvtColor(res, cv2.COLOR_BGR2RGB))
    plt.xlabel(u'肤色滤波后的图像',fontsize=20)
    plt.show()
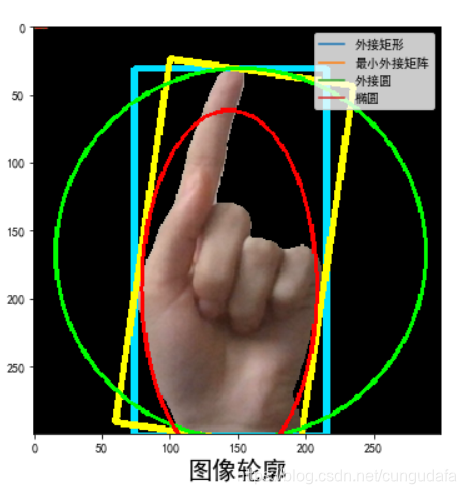
2.轮廓特征
部分代码片段:
def barycenter(img, contour_reconstruct):
    """获取重心

    :param res: 输入图像,轮廓
    :return: 重绘图像
    """
    x, y, w, h = cv2.boundingRect(contour_reconstruct)  # 外接矩形
    cv2.rectangle(img, (x, y), (x + w, y + h), (255, 225,0), 3)

    rect = cv2.minAreaRect(contour_reconstruct)  # 最小外接矩形
    box = np.int0(cv2.boxPoints(rect))  # 矩形的四个角点取整
    cv2.drawContours(img, [box], 0, (0, 255,255), 3)

    (x, y), radius = cv2.minEnclosingCircle(contour_reconstruct)#最小外接圆
    (x, y, radius) = np.int0((x, y, radius))  # 圆心和半径取整
    cv2.circle(img, (x, y), radius, (0,255,0), 2)

    ellipse = cv2.fitEllipse(contour_reconstruct)#拟合椭圆
    cv2.ellipse(img, ellipse, (0, 0, 255), 2)

    df = pd.DataFrame(np.random.rand(10,4), columns = [u'外接矩形',u'最小外接矩阵',u'外接圆',u'椭圆'])
    fig = df.plot(figsize = (6,6))  #创建图表对象,并复制给fig
    plt.imshow(cv2.cvtColor(img, cv2.COLOR_BGR2RGB))
    plt.xlabel(u'图像轮廓',fontsize=20)

    plt.show()
    return img
3.凸包轮廓
白色部分: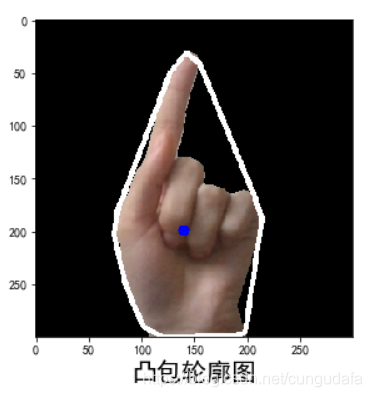
部分相关代码:
    # 凸包
    hull = cv2.convexHull(contour_reconstruct)# 寻找凸包,得到凸包的角点
    print("凸包信息:")
    print(hull[0])  # [[194 299]](坐标)
    hull2 = cv2.convexHull(contour_reconstruct, returnPoints=False)
    print(hull2[0])  # [20](cnt中的索引)
    print(contour_reconstruct[31])  # [[146  33]]
    print(cv2.isContourConvex(hull))  # True是否为凸型
    dist = cv2.pointPolygonTest(contour_reconstruct, (center_x, center_y), True)  # 中心点的最小距离
    print(dist)
    cv2.polylines(img, [hull], True, (255,255, 255), 3)# 绘制凸包

    plt.figure(figsize=(10,10))
    plt.subplot(1,2,1)
    plt.imshow(cv2.cvtColor(img, cv2.COLOR_BGR2RGB))
    plt.xlabel(u'凸包轮廓图',fontsize=20)
    plt.show()
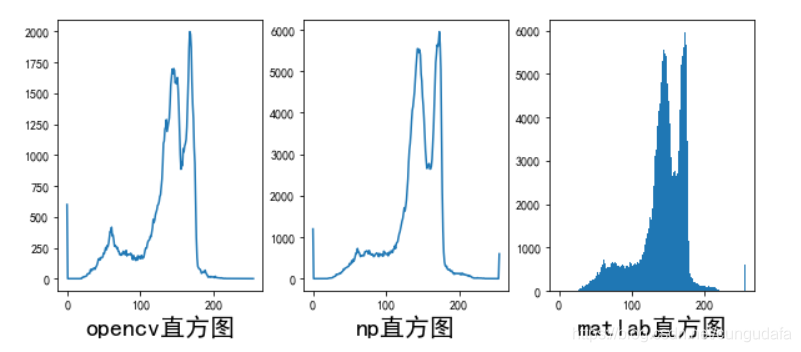
4.直方图
参考于:直方图
部分相关代码:
    plt.figure(figsize=(10,4))
    plt.subplot(1, 3, 1)
    hist1 = cv2.calcHist([roi], [0], None, [256], [0, 256])#直方图opencv
    plt.xlabel(u'opencv直方图',fontsize=20)
    plt.plot(hist1)
    plt.subplot(1, 3, 2)
    hist2 = np.bincount(roi.ravel(), minlength=256) #np直方图
    hist2, bins = np.histogram(roi.ravel(), 256, [0, 256])#np直方图ravel()二维变一维
    plt.plot(hist2)
    plt.xlabel(u'np直方图',fontsize=20)
    plt.subplot(1, 3, 3)
    plt.hist(roi.ravel(), 256, [0, 256])#matlab自带直方图
    plt.xlabel(u'matlab直方图',fontsize=20)
    plt.show()
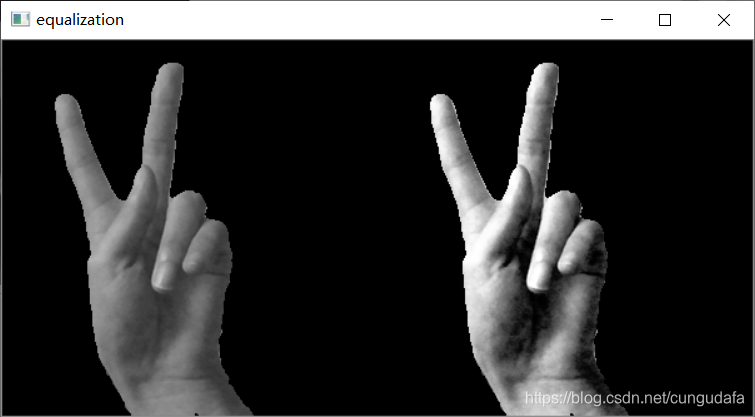
直方图优化:
	equ = cv2.equalizeHist(img)
    cv2.imshow('equalization', np.hstack((img, equ)))  # 并排显示
    cv2.waitKey(0)
    cv2.destroyAllWindows
穿插自适应直方图:
import numpy as np
import cv2 as cv
img = cv.imread('images/hand/hand.png',0)
# create a CLAHE object (Arguments are optional).
clahe = cv.createCLAHE(clipLimit=2.0, tileGridSize=(8,8))
cl1 = clahe.apply(img)
cv.imwrite('images/hand/test.png',cl1)
5.重心
蓝色部分: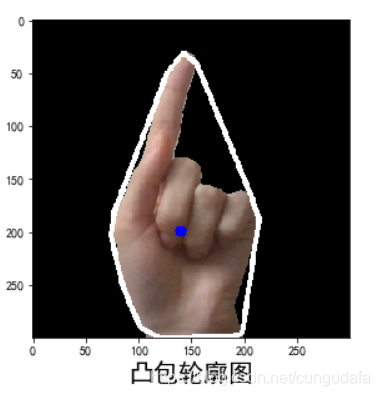
部分代码片段:
	# 中心点
    M = cv2.moments(contour_reconstruct) # 计算第一条轮廓的各阶矩,字典形式
    center_x = int(M["m10"] / M["m00"])
    center_y = int(M["m01"] / M["m00"])

    black_np = np.ones(img.shape, np.uint8) #创建黑色幕布
    black = cv2.drawContours(black_np,contour_reconstruct,-1,(255,255,255),3) #绘制白色轮廓
    black = cv2.circle(black, (center_x, center_y), 4, 255, -1)#绘制中心点
    cv2.circle(img, (center_x, center_y), 5, 255, -1)#绘制中心点
6.傅里叶描述子
我把之前的32特征点标注了一下: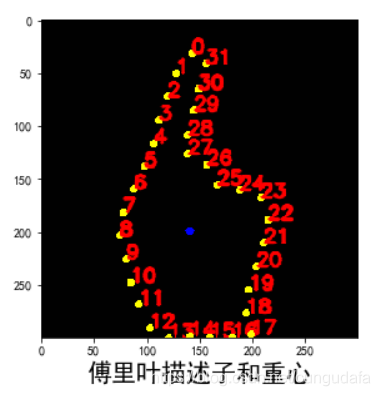
部分代码:
 	black_np = np.ones(img.shape, np.uint8) #创建黑色幕布
    black = cv2.drawContours(black_np,contour_reconstruct,-1,(255,255,255),3) #绘制白色轮廓
    black = cv2.circle(black, (center_x, center_y), 4, 255, -1)#绘制中心点
    cv2.circle(img, (center_x, center_y), 5, 255, -1)#绘制中心点

    point=[]#二维数组转坐标形式
    for idx in range(len(contour_reconstruct)):
        str1=str(contour_reconstruct[idx]).lstrip('[[').rstrip(']]').split(" ")
        while '' in str1:
            str1.remove('')
        point.append((int(str1[0]),int(str1[1])))
        if point[idx]:
            cv2.circle(black, point[idx], 3, (0, 255, 255), thickness=-1,lineType=cv2.FILLED)
            cv2.putText(black, "{}".format(idx),point[idx], cv2.FONT_HERSHEY_SIMPLEX,
                            0.6, (0, 0, 255), 2, lineType=cv2.LINE_AA)
主要是将(二维数组转换成了坐标形式,方便后面的特征计算😎)

三、完整代码
########计算手势库的特征
import cv2
import numpy as np
import pandas as pd
import matplotlib.pyplot as plt
plt.rcParams['font.sans-serif']=['SimHei'] #用来正常显示中文标签
plt.rcParams['axes.unicode_minus']=False #用来正常显示负号

MIN_DESCRIPTOR = 32  # surprisingly enough, 2 descriptors are already enough

def find_contours(Laplacian):
    """获取连通域

    :param: 输入Laplacian算子(空间锐化滤波)
    :return: 最大连通域
    """
    #binaryimg = cv2.Canny(res, 50, 200) #二值化,canny检测
    h = cv2.findContours(Laplacian,cv2.RETR_EXTERNAL,cv2.CHAIN_APPROX_NONE) #寻找轮廓
    contour = h[0]
    contour = sorted(contour, key = cv2.contourArea, reverse=True)#对一系列轮廓点坐标按它们围成的区域面积进行排序
    return contour

def skinMask(roi):
    """YCrCb颜色空间的Cr分量+Otsu法阈值分割算法

    :param res: 输入原图像
    :return: 肤色滤波后图像
    """
    YCrCb = cv2.cvtColor(roi, cv2.COLOR_BGR2YCR_CB) #转换至YCrCb空间
    (y,cr,cb) = cv2.split(YCrCb) #拆分出Y,Cr,Cb值
    cr1 = cv2.GaussianBlur(cr, (5,5), 0)
    _, skin = cv2.threshold(cr1, 0, 255, cv2.THRESH_BINARY + cv2.THRESH_OTSU) #Ostu处理
    res = cv2.bitwise_and(roi,roi, mask = skin)
    plt.figure(figsize=(10,10))
    plt.subplot(1,2,1)
    plt.imshow(cv2.cvtColor(roi, cv2.COLOR_BGR2RGB))
    plt.xlabel(u'原图',fontsize=20)
    plt.subplot(1,2,2)
    plt.imshow(cv2.cvtColor(res, cv2.COLOR_BGR2RGB))
    plt.xlabel(u'肤色滤波后的图像',fontsize=20)
    plt.show()

    plt.figure(figsize=(10,4))
    plt.subplot(1, 3, 1)
    hist1 = cv2.calcHist([roi], [0], None, [256], [0, 256])#直方图opencv
    plt.xlabel(u'opencv直方图',fontsize=20)
    plt.plot(hist1)
    plt.subplot(1, 3, 2)
    hist2 = np.bincount(roi.ravel(), minlength=256) #np直方图
    hist2, bins = np.histogram(roi.ravel(), 256, [0, 256])#np直方图ravel()二维变一维
    plt.plot(hist2)
    plt.xlabel(u'np直方图',fontsize=20)
    plt.subplot(1, 3, 3)
    plt.hist(roi.ravel(), 256, [0, 256])#matlab自带直方图
    plt.xlabel(u'matlab直方图',fontsize=20)
    plt.show()

#     gray= cv2.cvtColor(roi,cv2.IMREAD_GRAYSCALE)
#     equ = cv2.equalizeHist(gray)
#     cv2.imshow('equalization', np.hstack((roi, equ)))  # 并排显示
#     cv2.waitKey(0)
    # 自适应均衡化,参数可选
#     plt.figure()
#     clahe = cv2.createCLAHE(clipLimit=2.0, tileGridSize=(8, 8))
#     cl1 = clahe.apply(roi)
#     plt.show()

    return res

def truncate_descriptor(fourier_result):
    """截短傅里叶描述子

    :param res: 输入傅里叶描述子
    :return: 截短傅里叶描述子
    """
    descriptors_in_use = np.fft.fftshift(fourier_result)

    #取中间的MIN_DESCRIPTOR项描述子
    center_index = int(len(descriptors_in_use) / 2)
    low, high = center_index - int(MIN_DESCRIPTOR / 2), center_index + int(MIN_DESCRIPTOR / 2)
    descriptors_in_use = descriptors_in_use[low:high]

    descriptors_in_use = np.fft.ifftshift(descriptors_in_use)
    return descriptors_in_use

def fourierDesciptor(res):
    """计算傅里叶描述子

    :param res: 输入图片
    :return: 图像,描述子点
    """
    #Laplacian算子进行八邻域检测
    gray = cv2.cvtColor(res, cv2.COLOR_BGR2GRAY)
    dst = cv2.Laplacian(gray, cv2.CV_16S, ksize = 3)
    Laplacian = cv2.convertScaleAbs(dst)
    contour = find_contours(Laplacian)#提取轮廓点坐标
    contour_array = contour[0][:, 0, :]#注意这里只保留区域面积最大的轮廓点坐标
    contours_complex = np.empty(contour_array.shape[:-1], dtype=complex)
    contours_complex.real = contour_array[:,0]#横坐标作为实数部分
    contours_complex.imag = contour_array[:,1]#纵坐标作为虚数部分
    fourier_result = np.fft.fft(contours_complex)#进行傅里叶变换
    #fourier_result = np.fft.fftshift(fourier_result)
    descirptor_in_use = truncate_descriptor(fourier_result)#截短傅里叶描述子
    img1 = res.copy()
    reconstruct(res, descirptor_in_use)# 绘图显示描述子点
    draw_circle(img1, descirptor_in_use)# 相关关定位框架
    return res, descirptor_in_use

def reconstruct(img, descirptor_in_use):
    """由傅里叶描述子重建轮廓图

    :param res: 输入图像,傅里叶描述子
    :return: 重绘图像
    """
    contour_reconstruct = np.fft.ifft(descirptor_in_use)#傅里叶反变换
    contour_reconstruct = np.array([contour_reconstruct.real,contour_reconstruct.imag])
    contour_reconstruct = np.transpose(contour_reconstruct)#转换矩阵
    contour_reconstruct = np.expand_dims(contour_reconstruct, axis = 1)#改变数组维度在axis=1轴上加1
    if contour_reconstruct.min() < 0:
        contour_reconstruct -= contour_reconstruct.min()
    contour_reconstruct *= img.shape[0] / contour_reconstruct.max()
    contour_reconstruct = contour_reconstruct.astype(np.int32, copy = False)
    # 中心点
    M = cv2.moments(contour_reconstruct) # 计算第一条轮廓的各阶矩,字典形式
    center_x = int(M["m10"] / M["m00"])
    center_y = int(M["m01"] / M["m00"])

    black_np = np.ones(img.shape, np.uint8) #创建黑色幕布
    black = cv2.drawContours(black_np,contour_reconstruct,-1,(255,255,255),3) #绘制白色轮廓
    black = cv2.circle(black, (center_x, center_y), 4, 255, -1)#绘制中心点
    cv2.circle(img, (center_x, center_y), 5, 255, -1)#绘制中心点

    point=[]#二维数组转坐标形式
    for idx in range(len(contour_reconstruct)):
        str1=str(contour_reconstruct[idx]).lstrip('[[').rstrip(']]').split(" ")
        while '' in str1:
            str1.remove('')
        point.append((int(str1[0]),int(str1[1])))
        if point[idx]:
            cv2.circle(black, point[idx], 3, (0, 255, 255), thickness=-1,lineType=cv2.FILLED)
            cv2.putText(black, "{}".format(idx),point[idx], cv2.FONT_HERSHEY_SIMPLEX,
                            0.6, (0, 0, 255), 2, lineType=cv2.LINE_AA)
    print(contour_reconstruct)
    print(point)
    # 凸包
    hull = cv2.convexHull(contour_reconstruct)# 寻找凸包,得到凸包的角点
    print("凸包信息:")
    print(hull[0])  # [[194 299]](坐标)
    hull2 = cv2.convexHull(contour_reconstruct, returnPoints=False)
    print(hull2[0])  # [20](cnt中的索引)
    print(contour_reconstruct[31])  # [[146  33]]
    print(cv2.isContourConvex(hull))  # True是否为凸型
    dist = cv2.pointPolygonTest(contour_reconstruct, (center_x, center_y), True)  # 中心点的最小距离
    print(dist)
    cv2.polylines(img, [hull], True, (255,255, 255), 3)# 绘制凸包

    plt.figure(figsize=(10,10))
    plt.subplot(1,2,1)
    plt.imshow(cv2.cvtColor(img, cv2.COLOR_BGR2RGB))
    plt.xlabel(u'凸包轮廓图',fontsize=20)
    plt.subplot(1,2,2)
    plt.imshow(cv2.cvtColor(black, cv2.COLOR_BGR2RGB))
    plt.xlabel(u'傅里叶描述子和重心',fontsize=20)
    plt.show()

    #cv2.imshow("contour_reconstruct", img)
    #cv2.imwrite('recover.png',img)
    return img

def draw_circle(img, descirptor_in_use):
    """获取外接轮廓

    :param res: 输入图像,傅里叶描述子
    :return: 重绘图像
    """
    contour_reconstruct = np.fft.ifft(descirptor_in_use)#傅里叶反变换
    contour_reconstruct = np.array([contour_reconstruct.real,contour_reconstruct.imag])
    contour_reconstruct = np.transpose(contour_reconstruct)#转换矩阵
    contour_reconstruct = np.expand_dims(contour_reconstruct, axis = 1)#改变数组维度在axis=1轴上加1
    if contour_reconstruct.min() < 0:
        contour_reconstruct -= contour_reconstruct.min()
    contour_reconstruct *= img.shape[0] / contour_reconstruct.max()
    contour_reconstruct = contour_reconstruct.astype(np.int32, copy = False)

    x, y, w, h = cv2.boundingRect(contour_reconstruct)  # 外接矩形
    cv2.rectangle(img, (x, y), (x + w, y + h), (255, 225,0), 3)
    rect = cv2.minAreaRect(contour_reconstruct)  # 最小外接矩形
    box = np.int0(cv2.boxPoints(rect))  # 矩形的四个角点取整
    cv2.drawContours(img, [box], 0, (0, 255,255), 3)
    (x, y), radius = cv2.minEnclosingCircle(contour_reconstruct)#最小外接圆
    (x, y, radius) = np.int0((x, y, radius))  # 圆心和半径取整
    cv2.circle(img, (x, y), radius, (0,255,0), 2)
    ellipse = cv2.fitEllipse(contour_reconstruct)#拟合椭圆
    cv2.ellipse(img, ellipse, (0, 0, 255), 2)

    df = pd.DataFrame(np.random.rand(10,4), columns = [u'外接矩形',u'最小外接矩阵',u'外接圆',u'椭圆'])
    fig = df.plot(figsize = (6,6))  #创建图表对象,并复制给fig
    plt.imshow(cv2.cvtColor(img, cv2.COLOR_BGR2RGB))
    plt.xlabel(u'图像轮廓',fontsize=20)

    plt.show()
    return img

if __name__ == "__main__":
    path="images/hand/ROI.png"
    roi = cv2.imread(path)
    res = skinMask(roi) #进行肤色检测
    ret, fourier_result = fourierDesciptor(res)# 傅里叶描述子获取轮廓点
    cv2.waitKey(0)
    cv2.destroyAllWindows
不是不讲原理哦,原理在官方教程都很清楚,快速门。
毕设努力呀,欢迎图像学习方面的盆友一起交流😁~

有“AI”的1024 = 2048,欢迎大家加入2048 AI社区
更多推荐

 13
13 0
0- 0


 已为社区贡献15条内容

所有评论(0)