matplotlib绘制条形图(bar、设置不同的颜色、设置每个条形图文字)
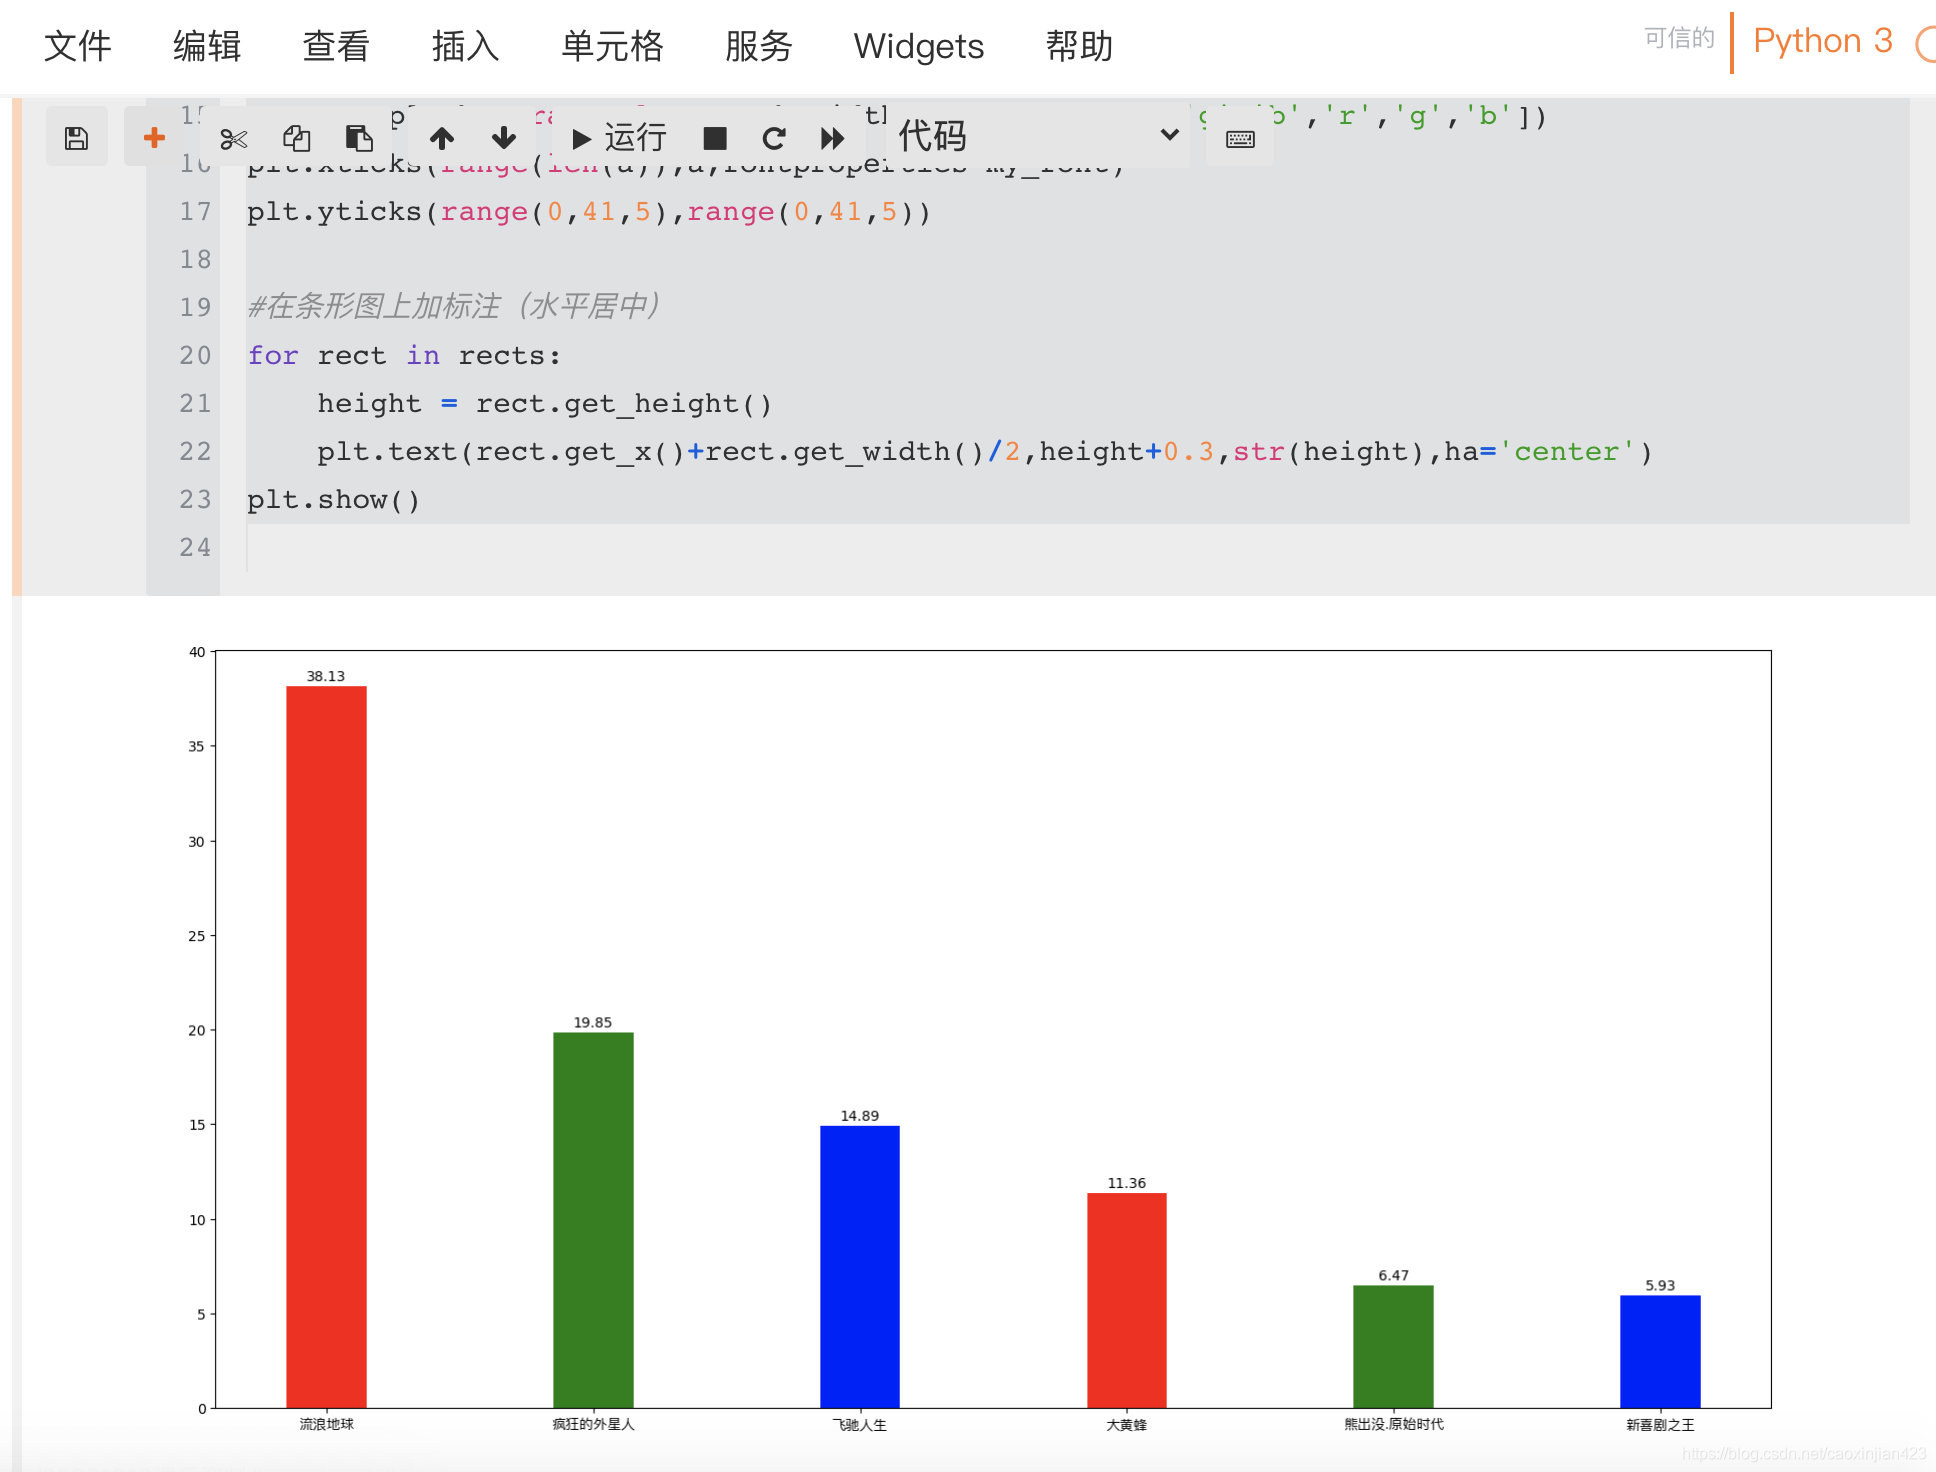
代码示例:'''绘制电影票房条形图a = ['流浪地球', '疯狂的外星人','飞驰人生','大黄蜂','熊出没.原始时代','新喜剧之王']b = ['38.13', '19.85', '14.89', '11.36','6.47','5.93']'''import matplotlib.pyplot as pltimport matplotlib.font_manager as fma = [
·
代码示例:
'''
绘制电影票房条形图
a = ['流浪地球', '疯狂的外星人','飞驰人生','大黄蜂','熊出没.原始时代','新喜剧之王']
b = ['38.13', '19.85', '14.89', '11.36','6.47','5.93']
'''
import matplotlib.pyplot as plt
import matplotlib.font_manager as fm

a = ['流浪地球', '疯狂的外星人','飞驰人生','大黄蜂','熊出没.原始时代','新喜剧之王']
b = [38.13, 19.85, 14.89, 11.36,6.47,5.93]
plt.figure(figsize=(20,10),dpi=100)
my_font = fm.FontProperties(fname='/System/Library/Fonts/PingFang.ttc',size=10)

#绘制条形图
rects = plt.bar(range(len(a)),b,width=0.3,color=['r','g','b','r','g','b'])
plt.xticks(range(len(a)),a,fontproperties=my_font)
plt.yticks(range(0,41,5),range(0,41,5))

#在条形图上加标注(水平居中)
for rect in rects:
    height = rect.get_height()
    plt.text(rect.get_x()+rect.get_width()/2,height+0.3,str(height),ha='center')
plt.show()
效果截图:

更多推荐
 已为社区贡献1条内容


所有评论(0)