MATLAB图像处理:直方图均衡化、直方图规定化
直方图处理是图像增强的核心技术之一,通过调整像素的灰度分布改善图像质量。本文将系统讲解直方图均衡化、直方图匹配原理,并提供详细的MATLAB代码示例。
·
直方图处理是图像增强的核心技术之一,通过调整像素的灰度分布改善图像质量。本文将系统讲解直方图均衡化、直方图匹配原理,并提供详细的MATLAB代码示例。
一、直方图基础
1.1 直方图的定义与数学表达
直方图描述图像中每个灰度级的像素数量分布,公式为:
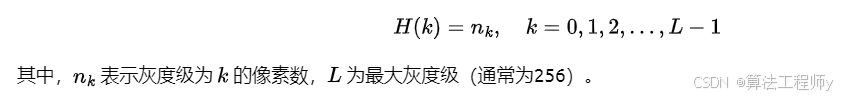
MATLAB绘制直方图:
img = imread('pout.png');
figure, imhist(img), title('原始直方图'); 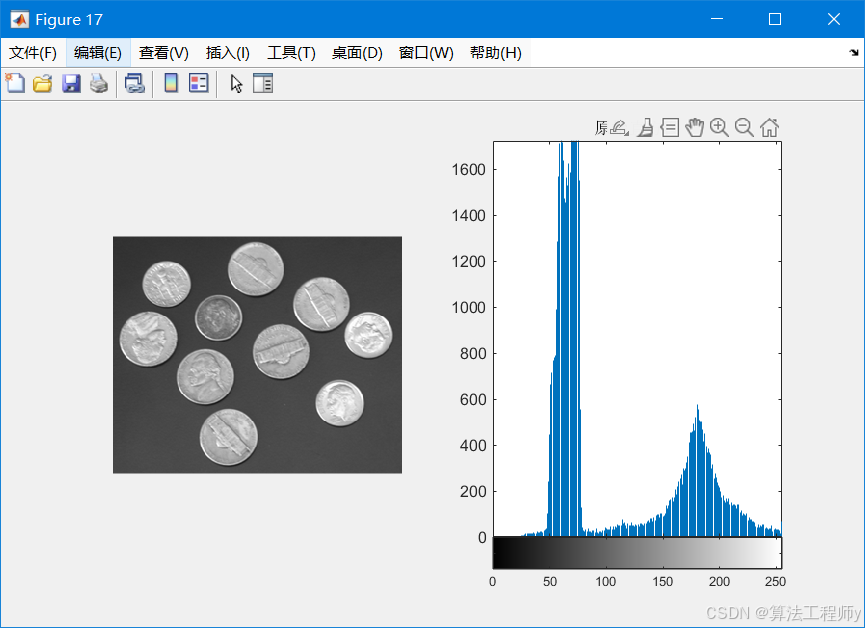
二、直方图均衡化(HE)
2.1 均衡化原理
核心思想:将原直方图的累积分布函数(CDF)线性的映射到均匀分布,拉伸对比度。
转换函数:
% 调用示例
eq_img = manual_histeq(img);
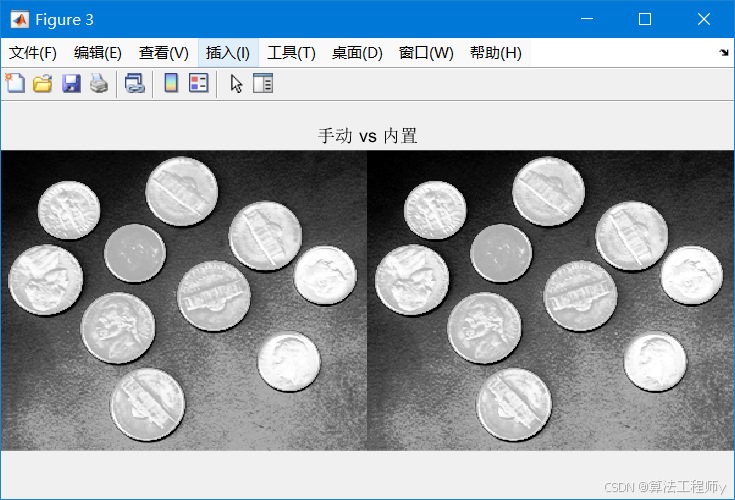
figure, subplot(121), imshow(img), title('原图');
subplot(122), imshow(eq_img), title('均衡化后');
function eq_img = manual_histeq(img)
[counts, ~] = imhist(img); % 计算直方图
cdf = cumsum(counts) / numel(img);% 计算累积分布
s_k = round(255 * cdf); % 映射到0-255
eq_img = uint8(s_k(img + 1)); % 应用映射(注意MATLAB索引从1开始)
end
eq_img_builtin = histeq(img); % 内置函数
figure, imshowpair(eq_img, eq_img_builtin, 'montage'), title('手动 vs 内置');
三、直方图匹配(规定化)
3.1 匹配原理
将原图直方图调整为近似目标分布。核心步骤:
- 计算原图和目标图的CDF。

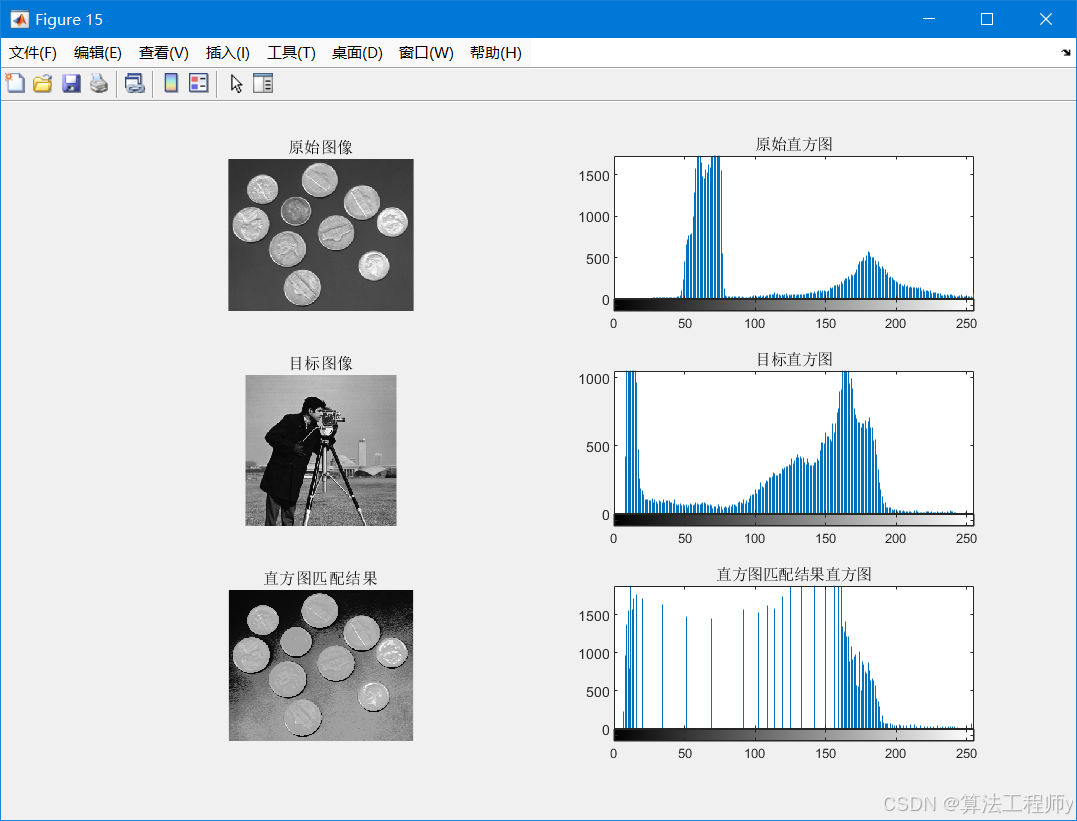
img = imread('coins.png');
target = imread('cameraman.tif'); % 目标图像
matched_img = hist_matching(img, target);
figure, subplot(321);imshow(img);title('原始图像');
subplot(322);imhist(img), title('原始直方图');
subplot(323);imshow(target);title('目标图像');
subplot(324);imhist(target), title('目标直方图');
subplot(325);imshow(matched_img), title('直方图匹配结果');
subplot(326);imhist(matched_img), title('直方图匹配结果直方图');
function matched_img = hist_matching(src_img, target_img)
    % 计算原图与目标图CDF
    src_counts = imhist(src_img);
    src_cdf = cumsum(src_counts) / numel(src_img);

    target_counts = imhist(target_img);
    target_cdf = cumsum(target_counts) / numel(target_img);

    % 构建映射表
    lut = zeros(256,1);
    for k = 1:256
        [~, idx] = min(abs(src_cdf(k) - target_cdf));
        lut(k) = idx - 1; % 灰度索引从0开始
    end

    % 应用查找表
    matched_img = uint8(lut(double(src_img)+1));
end

有“AI”的1024 = 2048,欢迎大家加入2048 AI社区
更多推荐


 5
5 0
0- 0


 已为社区贡献5条内容

所有评论(0)