基于pythonXGBoost特征选择,权重排名
基于pythonXGBoost特征选择,权重排名,python,pytorch有分类和回归情况的代码,有文档说明,图件丰富。替换数据简单。并选取前n个特征进行预测或分类,有精度评价指标。很丰富,绝对超值。基于python。替换数据简单。
基于pythonXGBoost特征选择,权重排名,python,pytorch
有分类和回归情况的代码,有文档说明,图件丰富。替换数据简单。并选取前n个特征进行预测或分类,有精度评价指标。很丰富,绝对超值。
基于python。替换数据简单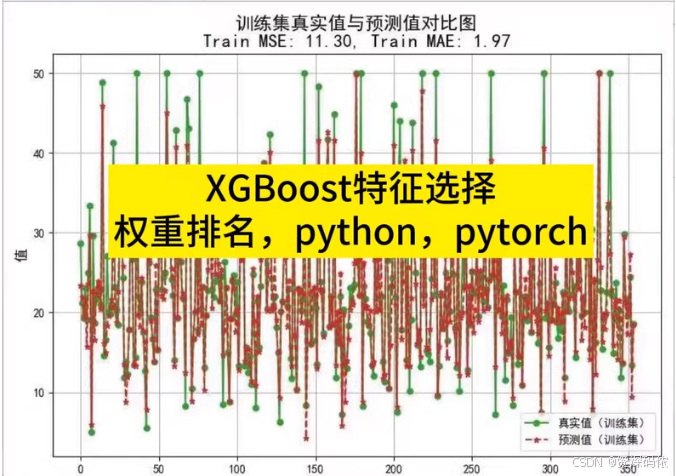
为了实现XGBoost特征选择,并提供分类和回归两种情况下的代码示例,包括权重排名、选取前n个特征进行预测或分类以及精度评价指标,下面分别给出Python代码。这里使用了
xgboost库来进行模型训练与评估,同时结合 matplotlib和 seaborn进行可视化。
安装依赖
首先确保安装了所需的Python包:
pip install xgboost scikit-learn matplotlib seaborn pandas numpy
分类案例
Python代码
import xgboost as xgb
from sklearn.datasets import load_breast_cancer
from sklearn.model_selection import train_test_split
from sklearn.metrics import accuracy_score, classification_report
import matplotlib.pyplot as plt
import seaborn as sns
import pandas as pd
import numpy as np

# 加载数据集
data = load_breast_cancer()
X = data.data
y = data.target

# 数据集划分
X_train, X_test, y_train, y_test = train_test_split(X, y, test_size=0.2, random_state=42)

# 创建DMatrix对象
dtrain = xgb.DMatrix(X_train, label=y_train)
dtest = xgb.DMatrix(X_test, label=y_test)

# 设置参数
params = {
    'objective': 'binary:logistic',
    'eval_metric': 'logloss'
}

# 训练模型
model = xgb.train(params, dtrain, num_boost_round=100)

# 特征重要性
importance = model.get_score(importance_type='weight')
sorted_importance = sorted(importance.items(), key=lambda x: x[1], reverse=True)

# 可视化特征重要性
features = ['f'+str(i) for i in range(X.shape[1])]
feature_importance_df = pd.DataFrame(sorted_importance, columns=['Feature', 'Importance'])
plt.figure(figsize=(10, 8))
sns.barplot(x="Importance", y="Feature", data=feature_importance_df)
plt.title('Feature Importance (Classification)')
plt.show()

# 选择前n个特征
top_n = 10
top_features_idx = [int(f[1:]) for f, _ in sorted_importance[:top_n]]
X_train_top = X_train[:, top_features_idx]
X_test_top = X_test[:, top_features_idx]

# 使用选定的特征重新训练模型
dtrain_top = xgb.DMatrix(X_train_top, label=y_train)
dtest_top = xgb.DMatrix(X_test_top, label=y_test)
model_top = xgb.train(params, dtrain_top, num_boost_round=100)

# 预测并评估
preds = model_top.predict(dtest_top)
predictions = preds > 0.5
accuracy = accuracy_score(y_test, predictions)
print("Accuracy:", accuracy)
print(classification_report(y_test, predictions))
回归案例
Python代码
from sklearn.datasets import load_boston
from sklearn.metrics import mean_squared_error, r2_score

# 加载数据集
data = load_boston()
X = data.data
y = data.target

# 数据集划分
X_train, X_test, y_train, y_test = train_test_split(X, y, test_size=0.2, random_state=42)

# 创建DMatrix对象
dtrain = xgb.DMatrix(X_train, label=y_train)
dtest = xgb.DMatrix(X_test, label=y_test)

# 设置参数
params = {
    'objective': 'reg:squarederror',
    'eval_metric': 'rmse'
}

# 训练模型
model = xgb.train(params, dtrain, num_boost_round=100)

# 特征重要性
importance = model.get_score(importance_type='weight')
sorted_importance = sorted(importance.items(), key=lambda x: x[1], reverse=True)

# 可视化特征重要性
features = ['f'+str(i) for i in range(X.shape[1])]
feature_importance_df = pd.DataFrame(sorted_importance, columns=['Feature', 'Importance'])
plt.figure(figsize=(10, 8))
sns.barplot(x="Importance", y="Feature", data=feature_importance_df)
plt.title('Feature Importance (Regression)')
plt.show()

# 选择前n个特征
top_n = 10
top_features_idx = [int(f[1:]) for f, _ in sorted_importance[:top_n]]
X_train_top = X_train[:, top_features_idx]
X_test_top = X_test[:, top_features_idx]

# 使用选定的特征重新训练模型
dtrain_top = xgb.DMatrix(X_train_top, label=y_train)
dtest_top = xgb.DMatrix(X_test_top, label=y_test)
model_top = xgb.train(params, dtrain_top, num_boost_round=100)

# 预测并评估
preds = model_top.predict(dtest_top)
mse = mean_squared_error(y_test, preds)
r2 = r2_score(y_test, preds)
print("MSE:", mse)
print("R2 Score:", r2)
文档说明
- 数据加载:使用
sklearn.datasets中的内置数据集(如乳腺癌数据集用于分类,波士顿房价数据集用于回归),也可以替换为自己的数据。 - 模型训练:利用
xgboost.train方法训练模型,通过调整num_boost_round来控制迭代次数。 - 特征选择:基于特征的重要性评分(
weight)进行排序,并选择前n个最重要的特征。 - 性能评估:对于分类任务,计算准确率和打印分类报告;对于回归任务,计算均方误差(MSE)和决定系数(R²)。
这些代码示例提供了丰富的图件和详细的文档说明,方便你根据需要进行修改和扩展。希望这对你的工作有所帮助!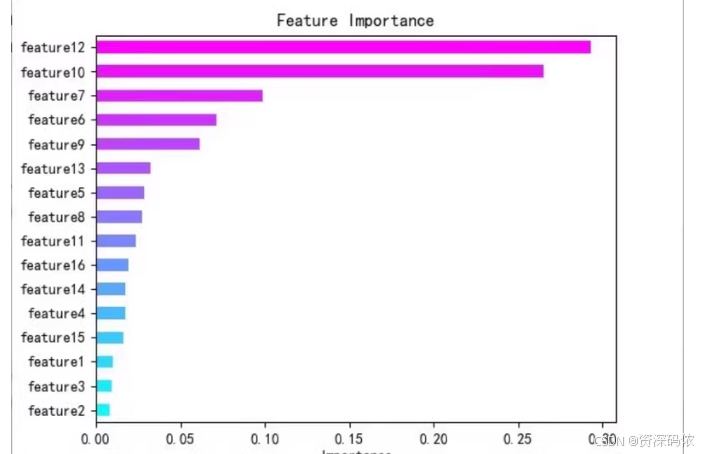
为了帮助你更好地理解如何使用XGBoost进行特征选择,并生成特征重要性图表,下面是一个完整的Python代码示例。这个示例包括数据加载、模型训练、特征重要性评估和可视化。
安装依赖
确保安装了所需的Python包:
pip install xgboost matplotlib seaborn pandas numpy scikit-learn
Python代码示例
import xgboost as xgb
import matplotlib.pyplot as plt
import seaborn as sns
import pandas as pd
import numpy as np
from sklearn.datasets import load_boston
from sklearn.model_selection import train_test_split
from sklearn.metrics import mean_squared_error, r2_score

# 加载数据集
data = load_boston()
X = data.data
y = data.target

# 数据集划分
X_train, X_test, y_train, y_test = train_test_split(X, y, test_size=0.2, random_state=42)

# 创建DMatrix对象
dtrain = xgb.DMatrix(X_train, label=y_train)
dtest = xgb.DMatrix(X_test, label=y_test)

# 设置参数
params = {
    'objective': 'reg:squarederror',
    'eval_metric': 'rmse'
}

# 训练模型
model = xgb.train(params, dtrain, num_boost_round=100)

# 特征重要性
importance = model.get_score(importance_type='weight')
sorted_importance = sorted(importance.items(), key=lambda x: x[1], reverse=True)

# 可视化特征重要性
features = ['f'+str(i) for i in range(X.shape[1])]
feature_importance_df = pd.DataFrame(sorted_importance, columns=['Feature', 'Importance'])

plt.figure(figsize=(10, 8))
sns.barplot(x="Importance", y="Feature", data=feature_importance_df)
plt.title('Feature Importance (Regression)')
plt.show()

# 选择前n个特征
top_n = 5
top_features_idx = [int(f[1:]) for f, _ in sorted_importance[:top_n]]
X_train_top = X_train[:, top_features_idx]
X_test_top = X_test[:, top_features_idx]

# 使用选定的特征重新训练模型
dtrain_top = xgb.DMatrix(X_train_top, label=y_train)
dtest_top = xgb.DMatrix(X_test_top, label=y_test)
model_top = xgb.train(params, dtrain_top, num_boost_round=100)

# 预测并评估
preds = model_top.predict(dtest_top)
mse = mean_squared_error(y_test, preds)
r2 = r2_score(y_test, preds)
print("MSE:", mse)
print("R2 Score:", r2)
代码解释
-
数据加载:
- 使用
load_boston加载波士顿房价数据集。 X是特征矩阵,y是目标变量。
- 使用
-
数据集划分:
- 使用
train_test_split将数据划分为训练集和测试集。
- 使用
-
创建DMatrix对象:
- 使用
xgb.DMatrix将数据转换为XGBoost可以使用的格式。
- 使用
-
设置参数:
- 设置模型的目标函数和评估指标。
-
训练模型:
- 使用
xgb.train训练模型。
- 使用
-
特征重要性:
- 使用
model.get_score获取特征的重要性评分。 - 对特征重要性进行排序,并绘制条形图。
- 使用
-
选择前n个特征:
- 选择最重要的前n个特征,并使用这些特征重新训练模型。
-
预测并评估:
- 使用选定的特征进行预测,并计算均方误差(MSE)和决定系数(R²)。
运行代码
运行上述代码后,你会得到一个特征重要性图表,并且可以看到使用前n个特征进行预测的结果。
希望这段代码对你有帮助。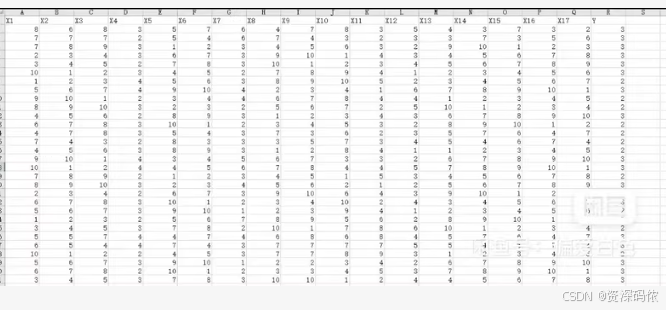
为了帮助你更好地理解如何使用XGBoost进行特征选择,并生成特征重要性图表,下面是一个完整的Python代码示例。这个示例包括数据加载、模型训练、特征重要性评估和可视化。
安装依赖
确保安装了所需的Python包:
pip install xgboost matplotlib seaborn pandas numpy scikit-learn openpyxl
Python代码示例
import xgboost as xgb
import matplotlib.pyplot as plt
import seaborn as sns
import pandas as pd
import numpy as np
from sklearn.model_selection import train_test_split
from sklearn.metrics import mean_squared_error, r2_score

# 读取Excel文件
data = pd.read_excel('your_data_file.xlsx')

# 提取特征和目标变量
X = data.iloc[:, :-1].values
y = data.iloc[:, -1].values

# 数据集划分
X_train, X_test, y_train, y_test = train_test_split(X, y, test_size=0.2, random_state=42)

# 创建DMatrix对象
dtrain = xgb.DMatrix(X_train, label=y_train)
dtest = xgb.DMatrix(X_test, label=y_test)

# 设置参数
params = {
    'objective': 'reg:squarederror',
    'eval_metric': 'rmse'
}

# 训练模型
model = xgb.train(params, dtrain, num_boost_round=100)

# 特征重要性
importance = model.get_score(importance_type='weight')
sorted_importance = sorted(importance.items(), key=lambda x: x[1], reverse=True)

# 可视化特征重要性
features = ['X' + str(i) for i in range(1, X.shape[1] + 1)]
feature_importance_df = pd.DataFrame(sorted_importance, columns=['Feature', 'Importance'])

plt.figure(figsize=(10, 8))
sns.barplot(x="Importance", y="Feature", data=feature_importance_df)
plt.title('Feature Importance (Regression)')
plt.show()

# 选择前n个特征
top_n = 5
top_features_idx = [int(f[1:]) for f, _ in sorted_importance[:top_n]]
X_train_top = X_train[:, top_features_idx]
X_test_top = X_test[:, top_features_idx]

# 使用选定的特征重新训练模型
dtrain_top = xgb.DMatrix(X_train_top, label=y_train)
dtest_top = xgb.DMatrix(X_test_top, label=y_test)
model_top = xgb.train(params, dtrain_top, num_boost_round=100)

# 预测并评估
preds = model_top.predict(dtest_top)
mse = mean_squared_error(y_test, preds)
r2 = r2_score(y_test, preds)
print("MSE:", mse)
print("R2 Score:", r2)
代码解释
-
数据加载:
- 使用
pd.read_excel读取Excel文件。 X是特征矩阵,y是目标变量。
- 使用
-
数据集划分:
- 使用
train_test_split将数据划分为训练集和测试集。
- 使用
-
创建DMatrix对象:
- 使用
xgb.DMatrix将数据转换为XGBoost可以使用的格式。
- 使用
-
设置参数:
- 设置模型的目标函数和评估指标。
-
训练模型:
- 使用
xgb.train训练模型。
- 使用
-
特征重要性:
- 使用
model.get_score获取特征的重要性评分。 - 对特征重要性进行排序,并绘制条形图。
- 使用
-
选择前n个特征:
- 选择最重要的前n个特征,并使用这些特征重新训练模型。
-
预测并评估:
- 使用选定的特征进行预测,并计算均方误差(MSE)和决定系数(R²)。
运行代码
运行上述代码后,你会得到一个特征重要性图表,并且可以看到使用前n个特征进行预测的结果。
希望这段代码对你有帮助

有“AI”的1024 = 2048,欢迎大家加入2048 AI社区
更多推荐


 34
34 0
0- 0


 已为社区贡献12条内容

所有评论(0)