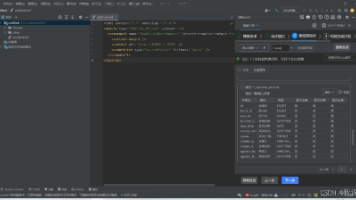
vue2实现任务流程图效果
2、创建一个method.js文件 封装一个方法,在页面上创建节点。有的是在方法里创建,单独写一个比较好修改样式。我使用的是antvx6 1.34.6版本。还可以添加按钮,下载 、删除选择的节点。5、引入依赖 、封装的方法。就可以得到一个示例啦!
·
我使用的是antvx6 1.34.6版本
官网地址:
https://x6.antv.vision/zh/docs/tutorial/getting-started
1、安装插件
npm install @antv/x6@1.34.6  --save
npm install @antv/x6-vue-shape insert-css
2、创建一个method.js文件 封装一个方法,在页面上创建节点
import '@antv/x6-vue-shape'
import { Graph, Shape, Addon, FunctionExt } from '@antv/x6'

export const startDragToGraph = (graph, type, e) => {
  const node = graph.createNode({
    width: 180, //节点的宽
    height: 35, //节点的高
    attrs: {
      label: {
        text: type, //文本
        fill: '#000000',
        fontSize: 14,
        textWrap: {
          width: -10,
          height: -10,
          ellipsis: true,
        },
      },
      body: {
        stroke: '#ccc',
        strokeWidth: 1,
        fill: '#ffffff',
      },
    },
    ports: ports,
  })

  const dnd = new Addon.Dnd({ target: graph })
  dnd.start(node, e)
}
const ports = {
  groups: {
    // 输入链接桩群组定义
    // 可以连接线的点 元素的上下左右
    top: {
      position: 'top',
      attrs: {
        circle: {
          r: 4,
          magnet: true,
          stroke: '#2D8CF0',
          strokeWidth: 2,
          fill: '#fff',
        },
      },
    },
    // 输出链接桩群组定义
    bottom: {
      position: 'bottom',
      attrs: {
        circle: {
          r: 4,
          magnet: true,
          stroke: '#2D8CF0',
          strokeWidth: 2,
          fill: '#fff',
        },
      },
    },
    left: {
      position: 'left',
      attrs: {
        circle: {
          r: 4,
          magnet: true,
          stroke: '#2D8CF0',
          strokeWidth: 2,
          fill: '#fff',
        },
      },
    },
    right: {
      position: 'right',
      attrs: {
        circle: {
          r: 4,
          magnet: true,
          stroke: '#2D8CF0',
          strokeWidth: 2,
          fill: '#fff',
        },
      },
    },
  },
  items: [
    {
      id: 'port1',
      group: 'top',
    },
    {
      id: 'port2',
      group: 'bottom',
    },
    {
      id: 'port3',
      group: 'left',
    },
    {
      id: 'port4',
      group: 'right',
    },
  ],
}
3、创建左侧元素
有的是在方法里创建,单独写一个比较好修改样式
list是元素列表
<li
    v-for="item in list"
    :key="item.value"
    @mousedown="startDrag(item.name, $event)"
>
    <p>{{ item.name }}</p>
</li>
4、创建容器
<div id="containerChart" class="containerChart"></div>5、引入依赖 、封装的方法
import { Graph, Shape, Addon, FunctionExt, DataUri } from '@antv/x6'
import insertCss from 'insert-css'
import '@antv/x6-vue-shape'

import { startDragToGraph } from './methods.js'
6、渲染画布 以及画布上的事件
mounted() {
   this.initX6()
},
initX6() {
      this.graph = new Graph({
        // 开启键盘事件
        keyboard: true,
        panning: true,
        container: document.getElementById('containerChart'),
        //画布
        grid: {
            size: 20, // 大小 10px
            visible: true, // 渲染背景
            type: 'dot',  //dot:点  mesh:网格
            args: {
              color: '#D0D0D0',
              thickness: 2, // 网格线宽度/网格点大小
              factor: 10,
            },
        },
        //小地图 start
        scroller: {
          enabled: true,
        },
        minimap: {
          enabled: true,
          container: document.getElementById('containerChart'),
          graphOptions: {
            async: true,
          },
        },
        //end
        resizing: {
          //调整节点宽高
          enabled: true,
          orthogonal: false,
        },
        selecting: true, //可选
        snapline: true,
        interacting: {
          edgeLabelMovable: true,
        },
        connecting: {
          // 节点连接
          anchor: 'center',
          connectionPoint: 'anchor',
          allowBlank: false,
          snap: true,
          createEdge() {
            return new Shape.Edge({
              attrs: {
                line: {
                  stroke: '#1890ff',
                  strokeWidth: 2,
                  targetMarker: {
                    name: 'classic',
                    size: 8,
                  },
                  strokeDasharray: 0, //虚线
                  style: {
                    animation: 'ant-line 30s infinite linear',
                  },
                },
              },
              label: {
                text: '',
              },
              connector: 'normal',
              router: {
                name: '',
              },
              zIndex: 0,
            })
          },
        },
        highlighting: {
          magnetAvailable: {
            name: 'stroke',
            args: {
              padding: 4,
              attrs: {
                strokeWidth: 4,
                stroke: '#6a6c8a',
              },
            },
          },
        },
      })
      insertCss(`
              @keyframes ant-line {
              to {
                    stroke-dashoffset: -1000
                }
              }
            `)
      this.graph.fromJSON(data)
      this.graph.history.redo()
      this.graph.history.undo()
      // 给画布添加事件
      // 鼠标移入移出节点
      this.graph.on(
        'node:mouseenter',
        FunctionExt.debounce(() => {
          const container = document.getElementById('containerChart')
          const ports = container.querySelectorAll('.x6-port-body')
          this.showPorts(ports, true)
        }),
        500
      )
      this.graph.on('node:mouseleave', () => {
        const container = document.getElementById('containerChart')
        const ports = container.querySelectorAll('.x6-port-body')
        this.showPorts(ports, false)
      })
      this.graph.on('blank:click', () => {
        this.type = 'grid'
      })
      this.graph.on('cell:click', ({ cell }) => {
        this.type = cell.isNode() ? 'node' : 'edge'
      })
      this.graph.on('selection:changed', (args) => {
        args.added.forEach((cell) => {
          this.selectCell = cell
          if (cell.isEdge()) {
            cell.isEdge() && cell.attr('line/strokeDasharray', 5) //虚线蚂蚁线
            cell.addTools([
              {
                name: 'vertices',
                args: {
                  padding: 4,
                  attrs: {
                    strokeWidth: 0.1,
                    stroke: '#2d8cf0',
                    fill: '#ffffff',
                  },
                },
              },
            ])
          }
        })
        args.removed.forEach((cell) => {
          cell.isEdge() && cell.attr('line/strokeDasharray', 0) //正常线
          cell.removeTools()
        })
      })
      // 双击页面节点事件
      this.graph.on('cell:dblclick', ({ cell }) => {
      })
      //添加节点事件
      this.graph.on('node:added', (e) => {
      })
      // delete 键盘删除事件
      this.graph.bindKey(['backspace', 'delete'], () => {
        // 删除选中的元素
        const cells = this.graph.getSelectedCells()
        if (cells.length) {
          this.graph.removeCells(cells)
        }
      })
},
// 拖拽
startDrag(type, e) {
    startDragToGraph(this.graph, type, e)
},
showPorts(ports, show) {
    for (let i = 0, len = ports.length; i < len; i = i + 1) {
        ports[i].style.visibility = show ? 'visible' : 'hidden'
    }
},
就可以得到一个示例啦!
还可以添加按钮,下载 、删除选择的节点,以及设置默认数据
<el-button
   type="primary"
   icon="el-icon-download"
   circle
   @click="saveToPNG"
></el-button>
<el-button
    type="primary"
    icon="el-icon-delete"
    circle
    @click="deleteNode"
></el-button>
下载和删除方法
//下载
saveToPNG() {
      this.$nextTick(() => {
        this.graph.toPNG(
          (dataUri) => {
            // 下载
            DataUri.downloadDataUri(dataUri, '下载名称.png')
          },
          {
            backgroundColor: 'white',
            padding: {
              top: 50,
              right: 50,
              bottom: 50,
              left: 50,
            },
            quality: 1,
            copyStyles: false,
          }
        )
      })
},
 // 删除节点
deleteNode() {
      const cell = this.graph.getSelectedCells()
      if (cell.length) {
        this.graph.removeCells(cell)
      }
},
给流程图添加默认数据
ports数据就是method.js文件里ports数据,重新复制一份
数据多了可以封装一个方法
this.graph.addNode({
          width: 180,
          height: 35,
          id: '1',
          x: item.x,
          y: item.y,
          attrs: {
            label: {
              text: '文本',
              fill: '#000000',
              fontSize: 14,
              textWrap: {
                width: -10,
                height: -10,
                ellipsis: true,
              },
            },
            body: {
              stroke: '#ccc',
              strokeWidth: 1,
              fill: '#ffffff',
            },
          },
          ports: this.ports,
 })

this.graph.addNode({
          width: 180,
          height: 35,
          id: '2',
          x: item.x,
          y: item.y,
          attrs: {
            label: {
              text: '文本2',
              fill: '#000000',
              fontSize: 14,
              textWrap: {
                width: -10,
                height: -10,
                ellipsis: true,
              },
            },
            body: {
              stroke: '#ccc',
              strokeWidth: 1,
              fill: '#ffffff',
            },
          },
          ports: this.ports,
 })
给这两条数据添加线连接
source来源节点 target目标节点
cell是节点的id
port是节点连接线的位置,有4个上下左右,和method.js里props的items数据对应
 // 设置默认连线数据
        this.graph.addEdge({
          source: { cell: '1', port: 'port2' },
          target: { cell: '2', port: 'port3' },
          attrs: {
            line: {
              stroke: '#1890ff',
              strokeWidth: 2,
              targetMarker: {
                name: 'classic',
                size: 8,
              },
              strokeDasharray: 0,
              style: {
                animation: 'ant-line 30s infinite linear',
              },
            },
          },
        })
有“AI”的1024 = 2048,欢迎大家加入2048 AI社区
更多推荐

 4
4 0
0- 0


 已为社区贡献2条内容

所有评论(0)