进阶应用DIFY 中 Echarts插件生成多样式或多维统计图表
进阶应用在DIFY 中利用 Echarts插件生成饼图、线图,同时支持多维表
·
一、同时生成线图、饼图、柱图
1、调整数据流,在原有柱状图基础上添加线性图表和饼图,如下图:

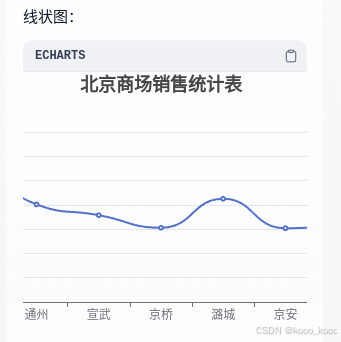
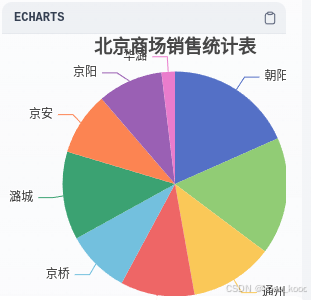
2、参照柱状图设置线图及饼图。

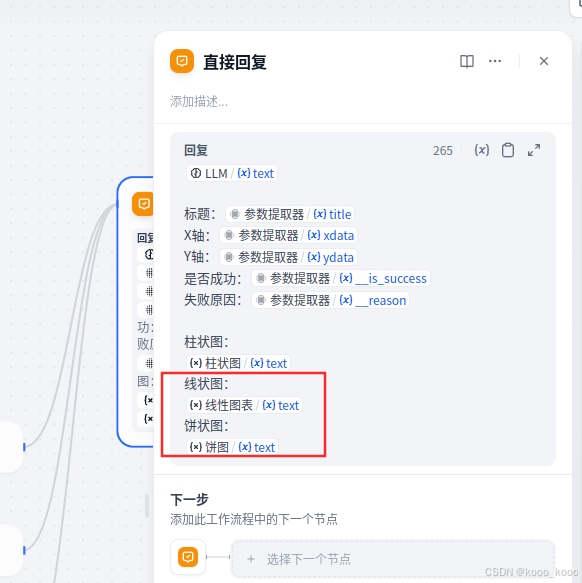
3、修改直接回复,增加线性图表及饼图输出
4、导入数据进行验证
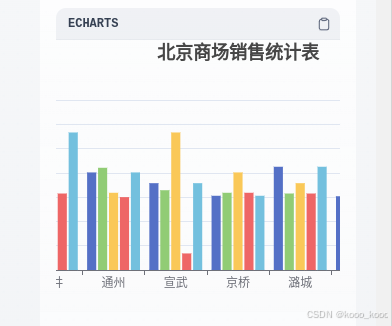
二、生成多维柱状图或线性图
目前提供插件,暂时未找到生成多维图的方法,参考网络其他大侠代码,将Echarts插件改为代码执行,使用python3代码实现需求功能:
1、删除Echarts插件、增加代码执行组件,修改后流程入下:

2、修改参数提取器,增加csv_data参数,提示词指令增加输出数值为CSV格式并赋值。

你是一位数据抽取专家;请根据{{#1743643949037.text#}}的数据,进行抽取,将标题赋值给title,y轴的数据赋值给ydata,x轴的数据赋值给xdate,其中每个ydata与xdata每个文本用单引号引起之间用 "," 分隔。并按CSV格式赋值给csv_data。3、修改代码执行,增加三个变量(第三个想作为图例,暂未实现,有回弄的说一声),在python代码中输入解析代码(参考网络大侠,加了点东西)
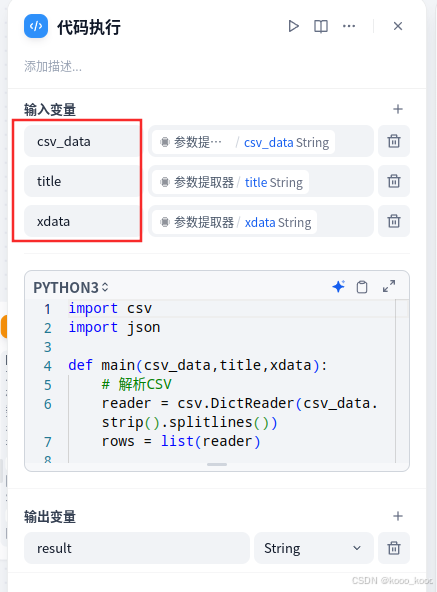
import csv
import json

def main(csv_data,title,xdata):
    # 解析CSV
    reader = csv.DictReader(csv_data.strip().splitlines())
    rows = list(reader)

    # 自动识别列结构
    headers = reader.fieldnames
    if not headers or len(headers) < 2:
        return {'result': 'Error: 需要至少两列数据(1个分类列+1个数值列)'}

    # 默认第一列为分类轴,其余为数值列
    category_col = headers[0]
    value_columns = headers[1:]

    # 提取数据
    categories = [row[category_col] for row in rows]
    series_data = [
        {
            "name": col,
            "type": "bar",#line为线图
            "data": [float(row[col]) for row in rows]  # 处理浮点数
        } for col in value_columns
    ]

    # 构建ECharts配置
    echarts_config = {
        "title": {"left": "center",
        "text": title},
        "legend": {"data": [xdata]},
        "xAxis": {"type": "category", "data": categories},
        "yAxis": {"type": "value"},
        "series": series_data
    }

    # 返回结果
    return {'result': f'```echarts\n{json.dumps(echarts_config, ensure_ascii=False)}\n```'}
4、修改直接恢复,增加代码执行返回结果

5、导入多维表进行验证:
| 北京商场销售统计表(样例) | |||||
| 商场名 | 1月 | 2月 | 3月 | 4月 | 5月 |
| 朝阳 | 12318 | 12408 | 8418 | 6299 | 12318 |
| 高井 | 11326 | 11802 | 6570 | 6299 | 11326 |
| 通州 | 8035 | 8418 | 6360 | 6001 | 8035 |
| 宣武 | 7150 | 6570 | 11326 | 1364 | 7150 |
| 京桥 | 6113 | 6360 | 8035 | 6360 | 6113 |
| 潞城 | 8502 | 6299 | 7150 | 6299 | 8502 |
| 京安 | 6073 | 6299 | 6113 | 6299 | 6073 |
| 京阳 | 6298 | 6001 | 6298 | 6001 | 6298 |
| 华潞 | 1294 | 6360 | 8035 | 11326 | 11802 |
三、导出DSL文件供大家分享,欢迎批评指正,谢谢
app:
description: 利用内置Echart插件,借助deepseek参数提取器,自动提取文本、csv、excel文件相关信息,生成统计图表
icon: 🤖
icon_background: '#FFEAD5'
mode: advanced-chat
name: 多维统计图表测试ByEchart
use_icon_as_answer_icon: false
dependencies:
- current_identifier: null
type: package
value:
plugin_unique_identifier: langgenius/openai_api_compatible:0.0.5@188b29121e708c1d0b26841bc2e66874a06c6cae73a2049c9215f57cb6cbca44
kind: app
version: 0.1.5
workflow:
conversation_variables: []
environment_variables: []
features:
file_upload:
allowed_file_extensions:
- .JPG
- .JPEG
- .PNG
- .GIF
- .WEBP
- .SVG
allowed_file_types:
- image
allowed_file_upload_methods:
- local_file
- remote_url
enabled: false
fileUploadConfig:
audio_file_size_limit: 50
batch_count_limit: 5
file_size_limit: 15
image_file_size_limit: 10
video_file_size_limit: 100
workflow_file_upload_limit: 10
image:
enabled: false
number_limits: 3
transfer_methods:
- local_file
- remote_url
number_limits: 3
opening_statement: ''
retriever_resource:
enabled: true
sensitive_word_avoidance:
enabled: false
speech_to_text:
enabled: false
suggested_questions: []
suggested_questions_after_answer:
enabled: false
text_to_speech:
enabled: false
language: ''
voice: ''
graph:
edges:
- data:
isInLoop: false
sourceType: start
targetType: document-extractor
id: 1743643939754-source-1743643949037-target
source: '1743643939754'
sourceHandle: source
target: '1743643949037'
targetHandle: target
type: custom
zIndex: 0
- data:
isInLoop: false
sourceType: document-extractor
targetType: parameter-extractor
id: 1743643949037-source-1743643957985-target
source: '1743643949037'
sourceHandle: source
target: '1743643957985'
targetHandle: target
type: custom
zIndex: 0
- data:
isInLoop: false
sourceType: parameter-extractor
targetType: code
id: 1743643957985-source-1743651304269-target
source: '1743643957985'
sourceHandle: source
target: '1743651304269'
targetHandle: target
type: custom
zIndex: 0
- data:
isInLoop: false
sourceType: code
targetType: answer
id: 1743651304269-source-answer-target
source: '1743651304269'
sourceHandle: source
target: answer
targetHandle: target
type: custom
zIndex: 0
- data:
isInLoop: false
sourceType: parameter-extractor
targetType: code
id: 1743643957985-source-17436714603540-target
source: '1743643957985'
sourceHandle: source
target: '17436714603540'
targetHandle: target
type: custom
zIndex: 0
- data:
isInLoop: false
sourceType: code
targetType: answer
id: 17436714603540-source-answer-target
source: '17436714603540'
sourceHandle: source
target: answer
targetHandle: target
type: custom
zIndex: 0
nodes:
- data:
desc: ''
selected: false
title: 开始
type: start
variables:
- allowed_file_extensions: []
allowed_file_types:
- document
allowed_file_upload_methods:
- local_file
- remote_url
label: 请上传包含统计数据的文件
max_length: 48
options: []
required: true
type: file
variable: efiles
height: 90
id: '1743643939754'
position:
x: 221.00000000000028
y: 210
positionAbsolute:
x: 221.00000000000028
y: 210
selected: false
sourcePosition: right
targetPosition: left
type: custom
width: 244
- data:
answer: '文档提取:{{#1743643949037.text#}}
标题:{{#1743643957985.title#}}
Y轴数值:{{#1743643957985.ydata#}}
X轴名称:{{#1743643957985.xdata#}}
是否成功:{{#1743643957985.__is_success#}}
错误原因:{{#1743643957985.__reason#}}
CSV文件:
{{#1743643957985.csv_data#}}
柱状图:
{{#1743651304269.result#}}
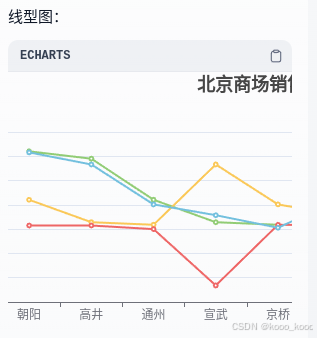
线型图:
{{#17436714603540.result#}}'
desc: ''
selected: false
title: 直接回复
type: answer
variables: []
height: 280
id: answer
position:
x: 937.6858015640123
y: 243.84674531236243
positionAbsolute:
x: 937.6858015640123
y: 243.84674531236243
selected: false
sourcePosition: right
targetPosition: left
type: custom
width: 244
- data:
desc: ''
is_array_file: false
selected: false
title: 文档提取器
type: document-extractor
variable_selector:
- '1743643939754'
- efiles
height: 92
id: '1743643949037'
position:
x: 313.0000000000002
y: 350
positionAbsolute:
x: 313.0000000000002
y: 350
selected: false
sourcePosition: right
targetPosition: left
type: custom
width: 244
- data:
desc: ''
instruction: 你是一位数据抽取专家;请根据{{#1743643949037.text#}}的数据,进行抽取,将标题赋值给title,y轴的数据赋值给ydata,x轴的数据赋值给xdate,其中每个ydata与xdata每个文本用单引号引起之间用
"," 分隔。并按CSV格式赋值给csv_data。
model:
completion_params:
temperature: 0.7
mode: chat
name: deepseek-r1
provider: langgenius/openai_api_compatible/openai_api_compatible
parameters:
- description: 标题
name: title
required: false
type: string
- description: Y轴数值
name: ydata
required: false
type: string
- description: X轴名称
name: xdata
required: false
type: string
- description: csv_data
name: csv_data
required: false
type: string
query:
- '1743643949037'
- text
reasoning_mode: prompt
selected: false
title: 参数提取器
type: parameter-extractor
variables: []
vision:
enabled: false
height: 90
id: '1743643957985'
position:
x: 525
y: 185.99999999999983
positionAbsolute:
x: 525
y: 185.99999999999983
selected: false
sourcePosition: right
targetPosition: left
type: custom
width: 244
- data:
code: "import csv\nimport json\n\ndef main(csv_data,title,xdata):\n # 解析CSV\n\
\ reader = csv.DictReader(csv_data.strip().splitlines())\n rows =\
\ list(reader)\n \n # 自动识别列结构\n headers = reader.fieldnames\n \
\ if not headers or len(headers) < 2:\n return {'result': 'Error:\
\ 需要至少两列数据(1个分类列+1个数值列)'}\n \n # 默认第一列为分类轴,其余为数值列\n category_col\
\ = headers[0]\n value_columns = headers[1:]\n \n # 提取数据\n categories\
\ = [row[category_col] for row in rows]\n series_data = [\n {\n\
\ \"name\": col,\n \"type\": \"bar\",#line为线图\n \
\ \"data\": [float(row[col]) for row in rows] # 处理浮点数\n \
\ } for col in value_columns\n ]\n \n # 构建ECharts配置\n echarts_config\
\ = {\n \"title\": {\"left\": \"center\",\n \"text\": title},\n\
\ \"legend\": {\"data\": [xdata]},\n \"xAxis\": {\"type\"\
: \"category\", \"data\": categories},\n \"yAxis\": {\"type\": \"\
value\"},\n \"series\": series_data\n }\n \n # 返回结果\n \
\ return {'result': f'```echarts\\n{json.dumps(echarts_config, ensure_ascii=False)}\\\
n```'}\n\n"
code_language: python3
desc: ''
outputs:
result:
children: null
type: string
selected: false
title: 代码执行
type: code
variables:
- value_selector:
- '1743643957985'
- csv_data
variable: csv_data
- value_selector:
- '1743643957985'
- title
variable: title
- value_selector:
- '1743643957985'
- xdata
variable: xdata
height: 54
id: '1743651304269'
position:
x: 634.0000000000002
y: 426.99999999999983
positionAbsolute:
x: 634.0000000000002
y: 426.99999999999983
selected: true
sourcePosition: right
targetPosition: left
type: custom
width: 244
- data:
code: "import csv\nimport json\n\ndef main(csv_data,title,xdata):\n # 解析CSV\n\
\ reader = csv.DictReader(csv_data.strip().splitlines())\n rows =\
\ list(reader)\n \n # 自动识别列结构\n headers = reader.fieldnames\n \
\ if not headers or len(headers) < 2:\n return {'result': 'Error:\
\ 需要至少两列数据(1个分类列+1个数值列)'}\n \n # 默认第一列为分类轴,其余为数值列\n category_col\
\ = headers[0]\n value_columns = headers[1:]\n \n # 提取数据\n categories\
\ = [row[category_col] for row in rows]\n series_data = [\n {\n\
\ \"name\": col,\n \"type\": \"line\",#bar为柱图\n \
\ \"data\": [float(row[col]) for row in rows] # 处理浮点数\n \
\ } for col in value_columns\n ]\n \n # 构建ECharts配置\n echarts_config\
\ = {\n \"title\": {\"left\": \"center\",\n \"text\": title},\n\
\ \"legend\": {\"data\": [xdata]},\n \"xAxis\": {\"type\"\
: \"category\", \"data\": categories},\n \"yAxis\": {\"type\": \"\
value\"},\n \"series\": series_data\n }\n \n # 返回结果\n \
\ return {'result': f'```echarts\\n{json.dumps(echarts_config, ensure_ascii=False)}\\\
n```'}\n\n"
code_language: python3
desc: ''
outputs:
result:
children: null
type: string
selected: false
title: 代码执行 (线图)
type: code
variables:
- value_selector:
- '1743643957985'
- csv_data
variable: csv_data
- value_selector:
- '1743643957985'
- title
variable: title
- value_selector:
- '1743643957985'
- xdata
variable: xdata
height: 54
id: '17436714603540'
position:
x: 778.2055214624788
y: 98.22360589976859
positionAbsolute:
x: 778.2055214624788
y: 98.22360589976859
selected: false
sourcePosition: right
targetPosition: left
type: custom
width: 244
viewport:
x: -112.68580156400935
y: 148.15325468763865
zoom: 0.9999999999999972

有“AI”的1024 = 2048,欢迎大家加入2048 AI社区
更多推荐


 14
14 0
0- 0


 已为社区贡献1条内容

所有评论(0)