关于echarts中折线图配置(设置折线的宽度,折线颜色渐变,折线上数字的颜色,以及不显示y轴,改变x轴的颜色等)
<!DOCTYPE html><html><head><title></title></head><style type="text/css">#trend {width: 700px;height: 500px;}</style&g...
<!DOCTYPE html>
<html>
<head>
<title></title>
</head>
<style type="text/css">
#trend {
width: 700px;
height: 500px;
}
</style>
<body>
<div id="trend">
</div>
<script type="text/javascript" src="./js/echarts.js"></script>
<script type="text/javascript">
let this_ = this;
//折线
let myTrend = echarts.init(document.getElementById('trend'));
var optionTrend = {
title: {
text: '平安指数趋势',
x: 'center',
// y: '10%',
textStyle:{ //标题样式
fontSize: '18',
fontFamily:'FZLTZCHK--GBK1-0',
color:'rgba(255,255,255,1)',
}
},
xAxis: {
type: 'category',
boundaryGap: false,
data: ['1月','2月','3月'],
axisTick:{
"show":false //去掉x轴刻度线
},
axisLabel: {
color: "#BACCF4" //坐标轴的文本颜色
}
},
yAxis: {
type: 'value',
splitLine: { //分割线
show: true, //控制分割线是否显示
lineStyle:{ //分割线的样式
color: ['rgba(43,70,126,1)'],
width: 2,
type: 'solid'
}
},
axisLine: { //y轴不显示
"show":false
},
axisTick:{ //y轴刻度线不显示
"show":false
},
axisLabel: {
color: "#BACCF4", //刻度线标签颜色
fontSize : 14
}
},
grid: { //设置图表显示在区域的哪个位置,控制图表的位置,可以是具体数值或者百分比
left: '67px',
right: '100px',
bottom: '10%',
containLabel: true, //containLabel(grid 区域是否包含坐标轴的刻度标签,默认不包含)为true的情况下,无法使图表紧贴着画布显示,但可以防止标签标签长度动态变化时溢出容器或者覆盖其他组件,将containLabel设置为false即可解决
},
tooltip: {
trigger: 'axis'
},
color:'#0B1D56',
series: [{
"data": [10,24,57],
type: 'line',
smooth: true, //设置折线为圆滑曲线,false则有转折点
// symbol: "none", //默认显示折点,为none时不显示
areaStyle: {
color: 'rgba(46,82,212,0.2)' //折线区域的背景颜色
},
label: {
normal: {
show: true,
}
},
itemStyle: {
normal: {
color: '#fff',
fontSize: 14,
lineStyle:{
width:3, //折线宽度
//折线颜色渐变
color: new echarts.graphic.LinearGradient(0, 0, 1, 0, [{
offset: 0,
color: 'rgba(45,105,249,1)'
},
{
offset: 1,
color: 'rgba(89,205,253,1)'
}])
}
},
emphasis: { //鼠标经过时折点小圆圈样式
borderColor: 'rgba(0,196,132,0.2)',
borderWidth: 10
}
},
}]
};
myTrend.setOption(optionTrend);
window.addEventListener('resize',function() {myTrend.resize()});
</script>
</body>
</html>
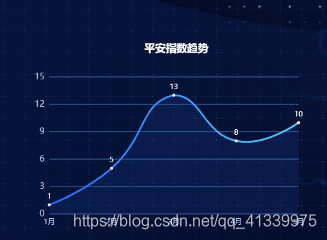
效果如下:
补充,网格线虚线显示
yAxis: {
splitLine :{ //网格线
lineStyle:{
type:'dashed' //设置网格线类型 dotted:虚线 solid:实线
},
show:true //隐藏或显示
}
}
效果如图:

有“AI”的1024 = 2048,欢迎大家加入2048 AI社区
更多推荐
 7
7 0
0- 0


 已为社区贡献1条内容

所有评论(0)